写在前面
关于数据科学环境的建立,可以参考我的博客:
【深耕 Python】Data Science with Python 数据科学(1)环境搭建
往期数据科学博文一览:
【深耕 Python】Data Science with Python 数据科学(2)jupyter-lab和numpy数组
【深耕 Python】Data Science with Python 数据科学(3)Numpy 常量、函数和线性空间
【深耕 Python】Data Science with Python 数据科学(4)(书337页)练习题及解答
【深耕 Python】Data Science with Python 数据科学(5)Matplotlib可视化(1)
【深耕 Python】Data Science with Python 数据科学(6)Matplotlib可视化(2)
【深耕 Python】Data Science with Python 数据科学(7)书352页练习题
【深耕 Python】Data Science with Python 数据科学(8)pandas数据结构:Series和DataFrame
【深耕 Python】Data Science with Python 数据科学(9)书361页练习题
【深耕 Python】Data Science with Python 数据科学(10)pandas 数据处理(一)
【深耕 Python】Data Science with Python 数据科学(11)pandas 数据处理(二)
【深耕 Python】Data Science with Python 数据科学(12)pandas 数据处理(三)
【深耕 Python】Data Science with Python 数据科学(13)pandas 数据处理(四):书377页练习题
【深耕 Python】Data Science with Python 数据科学(14)pandas 数据处理(五):泰坦尼克号亡魂 Perished Souls on “RMS Titanic”
【深耕 Python】Data Science with Python 数据科学(15)pandas 数据处理(六):书385页练习题
【深耕 Python】Data Science with Python 数据科学(16)Scikit-learn机器学习(一)
代码说明: 由于实机运行的原因,可能省略了某些导入(import)语句。
本期博客为Scikit-learn机器学习的最入门之介绍,更深入的理解和应用请待后续更新。本期内容开始之前,首先分享一则机器学习相关的名人名言。
名人名言
【匈牙利】约翰·冯·诺伊曼,计算科学之父 John von Neumann 1903-1957

“With four parameters I can fit an elephant, and with five I can make him wiggle his trunk.”
“给我四个参数,我可以拟合出一头大象;给我五个参数,我可以让他甩动他的象鼻。”
一、读取数据表格
import numpy as np
import pandas as pd
import matplotlib.pyplot as plt

URL = "https://learnenough.s3.amazonaws.com/titanic.csv"
titanic = pd.read_csv(URL)
二、导入机器学习模型
Scikit-learn提供的机器学习模型(部分,附介绍链接):
逻辑斯蒂回归 Logistic Regression
朴素贝叶斯 Naive Bayes
感知机 Perceptron
决策树 Decision Tree
随机森林 Random Forest
导入上述机器学习模型:
from sklearn.linear_model import LogisticRegression
from sklearn.naive_bayes import GaussianNB
from sklearn.linear_model import Perceptron
from sklearn.tree import DecisionTreeClassifier
from sklearn.ensemble import RandomForestClassifier
三、数据预处理
将除了舱级Pclass、性别Sex、年龄Age和生还Survived之外的列全部去除:
dropped_columns = ["PassengerId", "Name", "Cabin", "Embarked", "SibSp", "Parch", "Ticket", "Fare"]
for column in dropped_columns:
    titanic = titanic.drop(column, axis=1)
然后,将剩余列中的NaN和NaT值去除:
for column in ["Age", "Sex", "Pclass"]:
    titanic = titanic[titanic[column].notna()]
还需将分类变量(Categorical Variable),比如性别,映射为数值变量(Numerical Variable):
sexes = {"male": 0, "female": 1}
titanic["Sex"] = titanic["Sex"].map(sexes)
准备自变量和因变量:
X = titanic.drop("Survived", axis=1)
Y = titanic["Survived"]
观察自变量和因变量的数据结构:
print(X.head(), "\n----\n")
print(Y.head(), "\n----\n")
程序输出:
# 3个自变量
   Pclass  Sex   Age
0       3    0  22.0
1       1    1  38.0
2       3    1  26.0
3       1    1  35.0
4       3    0  35.0
----

# 因变量
0    0
1    1
2    1
3    1
4    0
Name: Survived, dtype: int64
----
接下来,将原数据划分为训练集和测试集,需导入 train_test_split() 方法:
from sklearn.model_selection import train_test_split

(X_train, X_test, Y_train, Y_test) = train_test_split(X, Y, random_state=1)
四、定义、训练和评估模型
逻辑斯蒂回归模型
logreg = LogisticRegression()
logreg.fit(X_train, Y_train)
accuracy_logreg = logreg.score(X_test, Y_test)
(高斯)朴素贝叶斯模型
naive_bayes = GaussianNB()
naive_bayes.fit(X_train, Y_train)
accuracy_naive_bayes = naive_bayes.score(X_test, Y_test)
感知机模型
perceptron = Perceptron()
perceptron.fit(X_train, Y_train)
accuracy_perceptron = perceptron.score(X_test, Y_test)
决策树模型
decision_tree = DecisionTreeClassifier()
decision_tree.fit(X_train, Y_train)
accuracy_decision_tree = decision_tree.score(X_test, Y_test)
随机森林模型
random_forest = RandomForestClassifier()
random_forest.fit(X_train, Y_train)
accuracy_random_forest = random_forest.score(X_test, Y_test)
模型评估:
results = pd.DataFrame({
    "Model": ["Logistic Regression", "Naive Bayes", "Perceptron",
              "Decision Tree", "Random Forest"],
    "Score": [accuracy_logreg, accuracy_naive_bayes, accuracy_perceptron,
              accuracy_decision_tree, accuracy_random_forest]
})

result_df = results.sort_values(by="Score", ascending=False)
result_df = result_df.set_index("Score")
print(result_df)
模型准确率:
# 准确率        模型
Score           Model
0.854749        Decision Tree
0.854749        Random Forest
0.787709  Logistic Regression
0.770950          Naive Bayes
0.743017           Perceptron
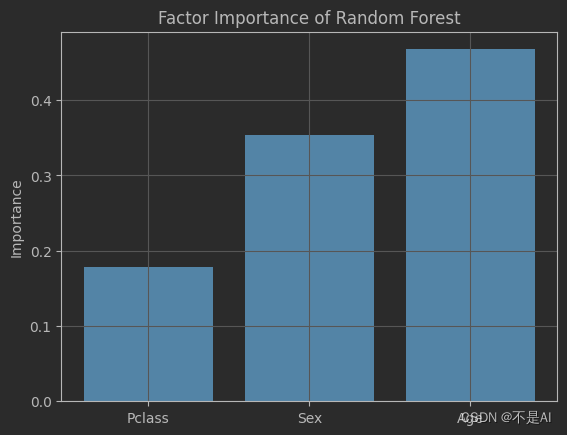
对随机森林模型中的3个因素的权重进行分析并绘制柱状图:
print(random_forest.feature_importances_)
print(X_train.columns)
fig, ax = plt.subplots()
ax.bar(X_train.columns, random_forest.feature_importances_)
plt.title("Factor Importance of Random Forest")
plt.ylabel("Importance")
plt.grid()
plt.show()
程序输出:
[0.17858357 0.35377705 0.46763938]
Index(['Pclass', 'Sex', 'Age'], dtype='object')
五、交叉验证
对随机森林模型进行K折交叉验证(默认值为K=5):
from sklearn.model_selection import cross_val_score

random_forest = RandomForestClassifier(random_state=1)
scores = cross_val_score(random_forest, X, Y)
print(scores)
print(scores.mean())
print(scores.std())
程序输出:
[0.75524476 0.8041958  0.82517483 0.83216783 0.83098592]  # 5次交叉验证
0.8095538264552349  # 平均准确率
0.028958338744358988  # 标准差
参考文献 Reference
《Learn Enough Python to be Dangerous——Software Development, Flask Web Apps, and Beginning Data Science with Python》, Michael Hartl, Boston, Pearson, 2023.






![[HNOI2003]激光炸弹](https://img-blog.csdnimg.cn/direct/4b9f37466d494471bfd12a444a93d721.png)
