1、工业场景
无论使用什么样的钢材,其机械性能都非常重要,主要性能通常是屈服强度和抗拉强度、延伸率和断面收缩率。力学性能可以通过试验室试验评估,使用钢材成品试样在类似的轧制条件下进行拉力试验。本文旨在利用数学模型构建了一种基于工业大数据为基础的钢坯力学性能预测模型。钢坯力学性能预测对于缩短产品研发周期,提高质量稳定性,提高生产效率,减排降耗等方面具有重要显示意义。
2、数学模型
钢坯力学性能主要受自身的化学成分以及生产过程控制参数的影响,即各种微量金属成分的含量、温度控制以及轧制厚度等工艺控制参数。由于各个钢种成分不一样,影响钢卷最终性能的工艺参数也不一样。常规来说主要影响其性能的为C、Si、Mn、S、P元素含量以及终轧温度、卷取温度等有关。我们将这些与产品性能相关的参数以及实际检测性能结果关联起来,建立性能预测模型,研究模型实时预测产品的性能部分替代传统取样方法的可行性。
本次研究主要采用随机森林算法。随机森林就是通过集成学习的思想将多棵树集成的一种算法,它的基本单元是决策树,而它的本质属于机器学习的一大分支——集成学习(Ensemble Learning)方法。
随机森林随机的主要是2个方面,一个是随机选取特征,一个是随机样本。比如我们有N条数据,每条数据M个特征,随机森林会随机X条选取样本数据和Y个特征,然后组成多个决策树。
随机森林的生成方法:
1.从样本集中通过重采样的方式产生n个样本。
2.假设样本特征数目为a,对n个样本选择a中的k个特征,用建立决策树的方式获得最佳分割点。
3.重复m次,产生m棵决策树。
4.多数投票机制来进行预测。
通过对历史数据分析,选取了在炉时长、部分在炉取样点温度、粗轧出口温度、精轧入口温度、精轧出口温度、冷却水温度、卷取温度等42个特征值,进行钢坯伸展性、延伸率、弯曲折断3个性能值进行预测。
3、数据清洗
本次研究以钢坯型号SPHC为例,通过对采集数据进行异常值处理最终获取3325条数据用于本次研究。

4、模型构建
from sklearn.ensemble import  RandomForestRegressor
from sklearn.model_selection import train_test_split
from sklearn.metrics import mean_squared_error
import pandas as pd
import numpy as np


def open_excel():
    """
    打开数据集,进行数据处理
    :return:特征集数据、标签集数据
    """
    read_data = pd.read_csv(f'D:\\LIHAOWORK\\1.csv')
    labels = read_data.iloc[0:,[7, 9, 12]].to_numpy()
    labels = np.float64(labels)
    features = read_data.iloc[0:,[2, 3, 13, 14, 15, 16, 17, 18, 19, 20, 21, 22, 23, 24, 25, 26, 27, 28, 30, 31, 32, 33, 34, 35, 36, 37, 38, 39, 40, 41, 42, 43, 44, 45, 46, 47, 48, 49, 50, 51, 52, 53]].to_numpy()
    features = np.float64(features)
    return features, labels


# 加载数据
X, y = open_excel()

# 处理nan值
#for idx, val in enumerate(X):
    #is_nan = np.isnan(val)
    #if(is_nan.any()) :
        #print(val)
        #print(idx)

# 样本分割
X_train, X_test, y_train, y_test = train_test_split(X, y, test_size=0.2, random_state=1)

# 建立模型
rf = RandomForestRegressor(n_estimators=10)

# 训练模型
rf.fit(X_train, y_train)

# 预测结果
y_pred = rf.predict(X_test)
print("预测结果为:", y_pred[:10])
print("实际结果为:", y_test[:10])
# 模型评估
print("MSE:", mean_squared_error(y_test, y_pred))
RandomForestRegressor 参数
def __init__(
        self,
        n_estimators=100,
        *,
        criterion="squared_error",
        max_depth=None,
        min_samples_split=2,
        min_samples_leaf=1,
        min_weight_fraction_leaf=0.0,
        max_features=1.0,
        max_leaf_nodes=None,
        min_impurity_decrease=0.0,
        bootstrap=True,
        oob_score=False,
        n_jobs=None,
        random_state=None,
        verbose=0,
        warm_start=False,
        ccp_alpha=0.0,
        max_samples=None,
    ):
其中关于决策树的参数:
criterion: “mse”来选择最合适的节点。
max_features: 选择最适属性时划分的特征不能超过此值。
当为整数时,即最大特征数;当为小数时,训练集特征数*小数;
if “auto”, then max_features=sqrt(n_features).
If “sqrt”, thenmax_features=sqrt(n_features).
If “log2”, thenmax_features=log2(n_features).
If None, then max_features=n_features.

max_depth: (default=None)设置树的最大深度,默认为None,这样建树时,会使每一个叶节点只有一个类别,或是达到min_samples_split。

min_samples_split: 根据属性划分节点时,每个划分最少的样本数。

min_samples_leaf: 叶子节点最少的样本数。

max_leaf_nodes: (default=None)叶子树的最大样本数。

min_weight_fraction_leaf: (default=0) 叶子节点所需要的最小权值

verbose: (default=0) 是否显示任务进程
关于随机森林特有的参数:
n_estimators=10: 决策树的个数,越多越好,但是性能就会越差,至少100左右(具体数字忘记从哪里来的了)可以达到可接受的性能和误差率。

bootstrap=True: 是否有放回的采样。

oob_score=False: oob(out of band,带外)数据,即:在某次决策树训练中没有被bootstrap选中的数据。多单个模型的参数训练,我们知道可以用cross validation(cv)来进行,但是特别消耗时间,而且对于随机森林这种情况也没有大的必要,所以就用这个数据对决策树模型进行验证,算是一个简单的交叉验证。性能消耗小,但是效果不错。

n_jobs=1: 并行job个数。这个在ensemble算法中非常重要,尤其是bagging(而非boosting,因为boosting的每次迭代之间有影响,所以很难进行并行化),因为可以并行从而提高性能。1=不并行;n:n个并行;-1:CPU有多少core,就启动多少job。

warm_start=False: 热启动,决定是否使用上次调用该类的结果然后增加新的。

min_impurity_decrease :一个阈值,表示一个节点分裂的条件是:如果这次分裂纯度的减少大于等于这这个值.。

random_state :如果是int数值表示它就是随机数产生器的种子.如果指定RandomState实例,它就是随机产生器的种子.如果是None,随机数产生器是np.random所用的RandomState实例; [int, RandomState instance or None, optional (default=None)]
5.网格搜索交叉验证进行参数调优。
(1)调参n_estimators
from sklearn.ensemble import  RandomForestRegressor
from sklearn.model_selection import train_test_split, cross_val_score
import matplotlib.pyplot as plt
import pandas as pd
import numpy as np


def open_excel():
    """
    打开数据集,进行数据处理
    :return:特征集数据、标签集数据
    """
    read_data = pd.read_csv(f'D:\\LIHAOWORK\\1.csv')
    labels = read_data.iloc[0:,[7, 9, 12]].to_numpy()
    labels = np.float64(labels)
    features = read_data.iloc[0:,[2, 3, 13, 14, 15, 16, 17, 18, 19, 20, 21, 22, 23, 24, 25, 26, 27, 28, 30, 31, 32, 33, 34, 35, 36, 37, 38, 39, 40, 41, 42, 43, 44, 45, 46, 47, 48, 49, 50, 51, 52, 53]].to_numpy()
    features = np.float64(features)
    return features, labels


# 加载数据
X, y = open_excel()

# 处理nan值
#for idx, val in enumerate(X):
    #is_nan = np.isnan(val)
    #if(is_nan.any()) :
        #print(val)
        #print(idx)

# 样本分割
X_train, X_test, y_train, y_test = train_test_split(X, y, test_size=0.2, random_state=1)


mse_list = []
for i in range(0,200,10):
    rf = RandomForestRegressor(n_estimators=i+1)
    mse = cross_val_score(rf,X_train,y_train,cv=10,scoring='neg_mean_squared_error')
    print(mse.mean())
    mse_list.append(mse.mean())

plt.figure(figsize=[20,5])
plt.plot(range(1,201,10), mse_list)
plt.show()
运行结果


均方误差数学上永远为正,但是sklearn当中使用均方误差作为评判标准时,却是计算”负均方误差“即 neg_mean_squared_error,所以这里是mse越接近0越好。随着决策树的增加,mes越接近0。在这里我们选择n_estimators=200,后面有时间可以再跑一下200-500的曲线。
(2)调参max_depth
from sklearn.ensemble import  RandomForestRegressor
from sklearn.model_selection import train_test_split, cross_val_score
import matplotlib.pyplot as plt
import pandas as pd
import numpy as np


def open_excel():
    """
    打开数据集,进行数据处理
    :return:特征集数据、标签集数据
    """
    read_data = pd.read_csv(f'D:\\LIHAOWORK\\1.csv')
    labels = read_data.iloc[0:,[7, 9, 12]].to_numpy()
    labels = np.float64(labels)
    features = read_data.iloc[0:,[2, 3, 13, 14, 15, 16, 17, 18, 19, 20, 21, 22, 23, 24, 25, 26, 27, 28, 30, 31, 32, 33, 34, 35, 36, 37, 38, 39, 40, 41, 42, 43, 44, 45, 46, 47, 48, 49, 50, 51, 52, 53]].to_numpy()
    features = np.float64(features)
    return features, labels


# 加载数据
X, y = open_excel()

# 处理nan值
#for idx, val in enumerate(X):
    #is_nan = np.isnan(val)
    #if(is_nan.any()) :
        #print(val)
        #print(idx)

# 样本分割
X_train, X_test, y_train, y_test = train_test_split(X, y, test_size=0.2, random_state=1)


mse_list = []
for i in range(10,30,1):
    rf = RandomForestRegressor(n_estimators=200,max_depth=i)
    mse = cross_val_score(rf,X_train,y_train,cv=10,scoring='neg_mean_squared_error')
    print(mse.mean())
    mse_list.append(mse.mean())

plt.figure(figsize=[20,5])
plt.plot(range(10,30,1), mse_list)
plt.show()

 考虑到整体性能本次max_depth选择13
(3)剩余参数大家有兴趣可以调一下。在此就不一个一个调了。
6.训练
from sklearn.ensemble import  RandomForestRegressor
from sklearn.model_selection import train_test_split, cross_val_score
from sklearn.metrics import mean_squared_error
import pandas as pd
import numpy as np


def open_excel():
    """
    打开数据集,进行数据处理
    :return:特征集数据、标签集数据
    """
    read_data = pd.read_csv(f'D:\\LIHAOWORK\\1.csv')
    labels = read_data.iloc[0:,[7, 9, 12]].to_numpy()
    labels = np.float64(labels)
    features = read_data.iloc[0:,[2, 3, 13, 14, 15, 16, 17, 18, 19, 20, 21, 22, 23, 24, 25, 26, 27, 28, 30, 31, 32, 33, 34, 35, 36, 37, 38, 39, 40, 41, 42, 43, 44, 45, 46, 47, 48, 49, 50, 51, 52, 53]].to_numpy()
    features = np.float64(features)
    return features, labels


# 加载数据
X, y = open_excel()

# 处理nan值
#for idx, val in enumerate(X):
    #is_nan = np.isnan(val)
    #if(is_nan.any()) :
        #print(val)
        #print(idx)

# 样本分割
X_train, X_test, y_train, y_test = train_test_split(X, y, test_size=0.2, random_state=1)

# 建立模型
rf = RandomForestRegressor(n_estimators=200,max_depth=13)

# 训练模型
rf.fit(X_train, y_train)

# 预测结果
y_pred = rf.predict(X_test)
print("预测结果为:", y_pred[:100])
print("实际结果为:", y_test[:100])
# 模型评估
print("MSE:", mean_squared_error(y_test, y_pred))
 最后MSE在35左右。
7.测评
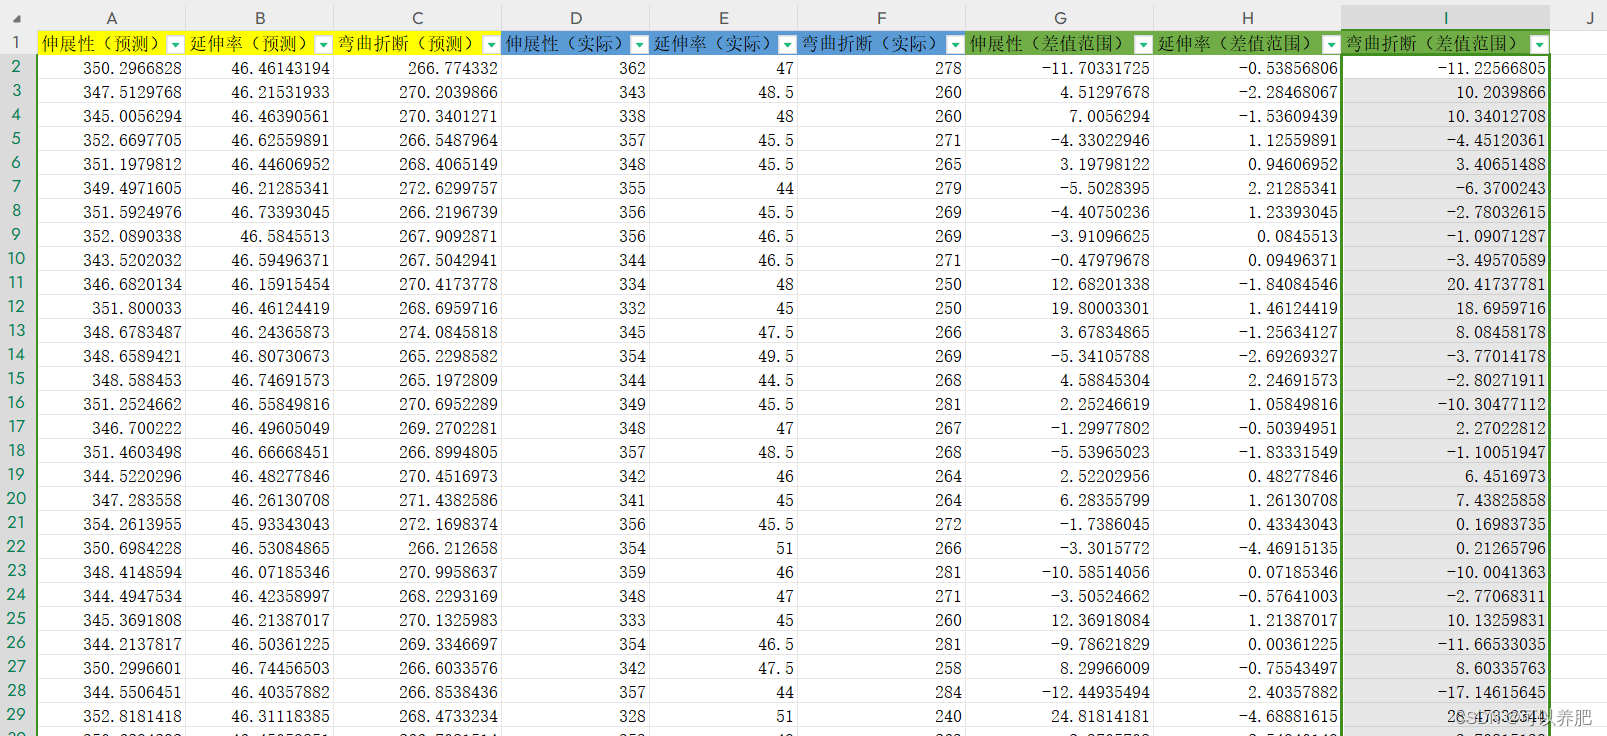
伸展性预测和实际偏差在±26左右
延伸率预测和实际偏差在±4左右
弯曲折断预测和实际偏差在±23左右
本次研究比较粗糙,模型在算法和调参上整体优化的空间还是较大。
