前言
在地图绘制领域,非规则投影的示例相对较少,通过几个python的示例可以更好地理解如何在不同投影类型和边界形状下绘制地图。
以下提供了一系列示例,演示了如何在地图中添加非规则边界和边框。这些示例涵盖了不同的投影类型和边界形状,包括近景透视投影、兰伯特等角投影、正交投影和等经纬度投影。其中,示例6还提供了一个方便的函数,可以在等经纬度投影下添加斑马线边框,使得地图更加生动和引人注目。
导入必要的库
from cartopy.mpl.gridliner import LONGITUDE_FORMATTER, LATITUDE_FORMATTER
import cartopy.feature as cf
import cartopy
import os
import xarray as xr
import glob
import numpy as np
import cartopy.feature as cfeature
import matplotlib.pyplot as plt
import cartopy.crs as ccrs
import matplotlib.ticker as mticker
import matplotlib.path                 as mpath
import cartopy.mpl.ticker              as ctk
import matplotlib.patches as patches
import itertools
import matplotlib.patheffects as pe
# ================================================================================================
# Author: %(Jianpu)s | Affiliation: Hohai
# Email : %(email)s
# Last modified: 2024-03-30 22:28:06
# Filename: 非规则矩形投影.py
# =================================================================================================
示例1:近景透视投影-非规则投影区域
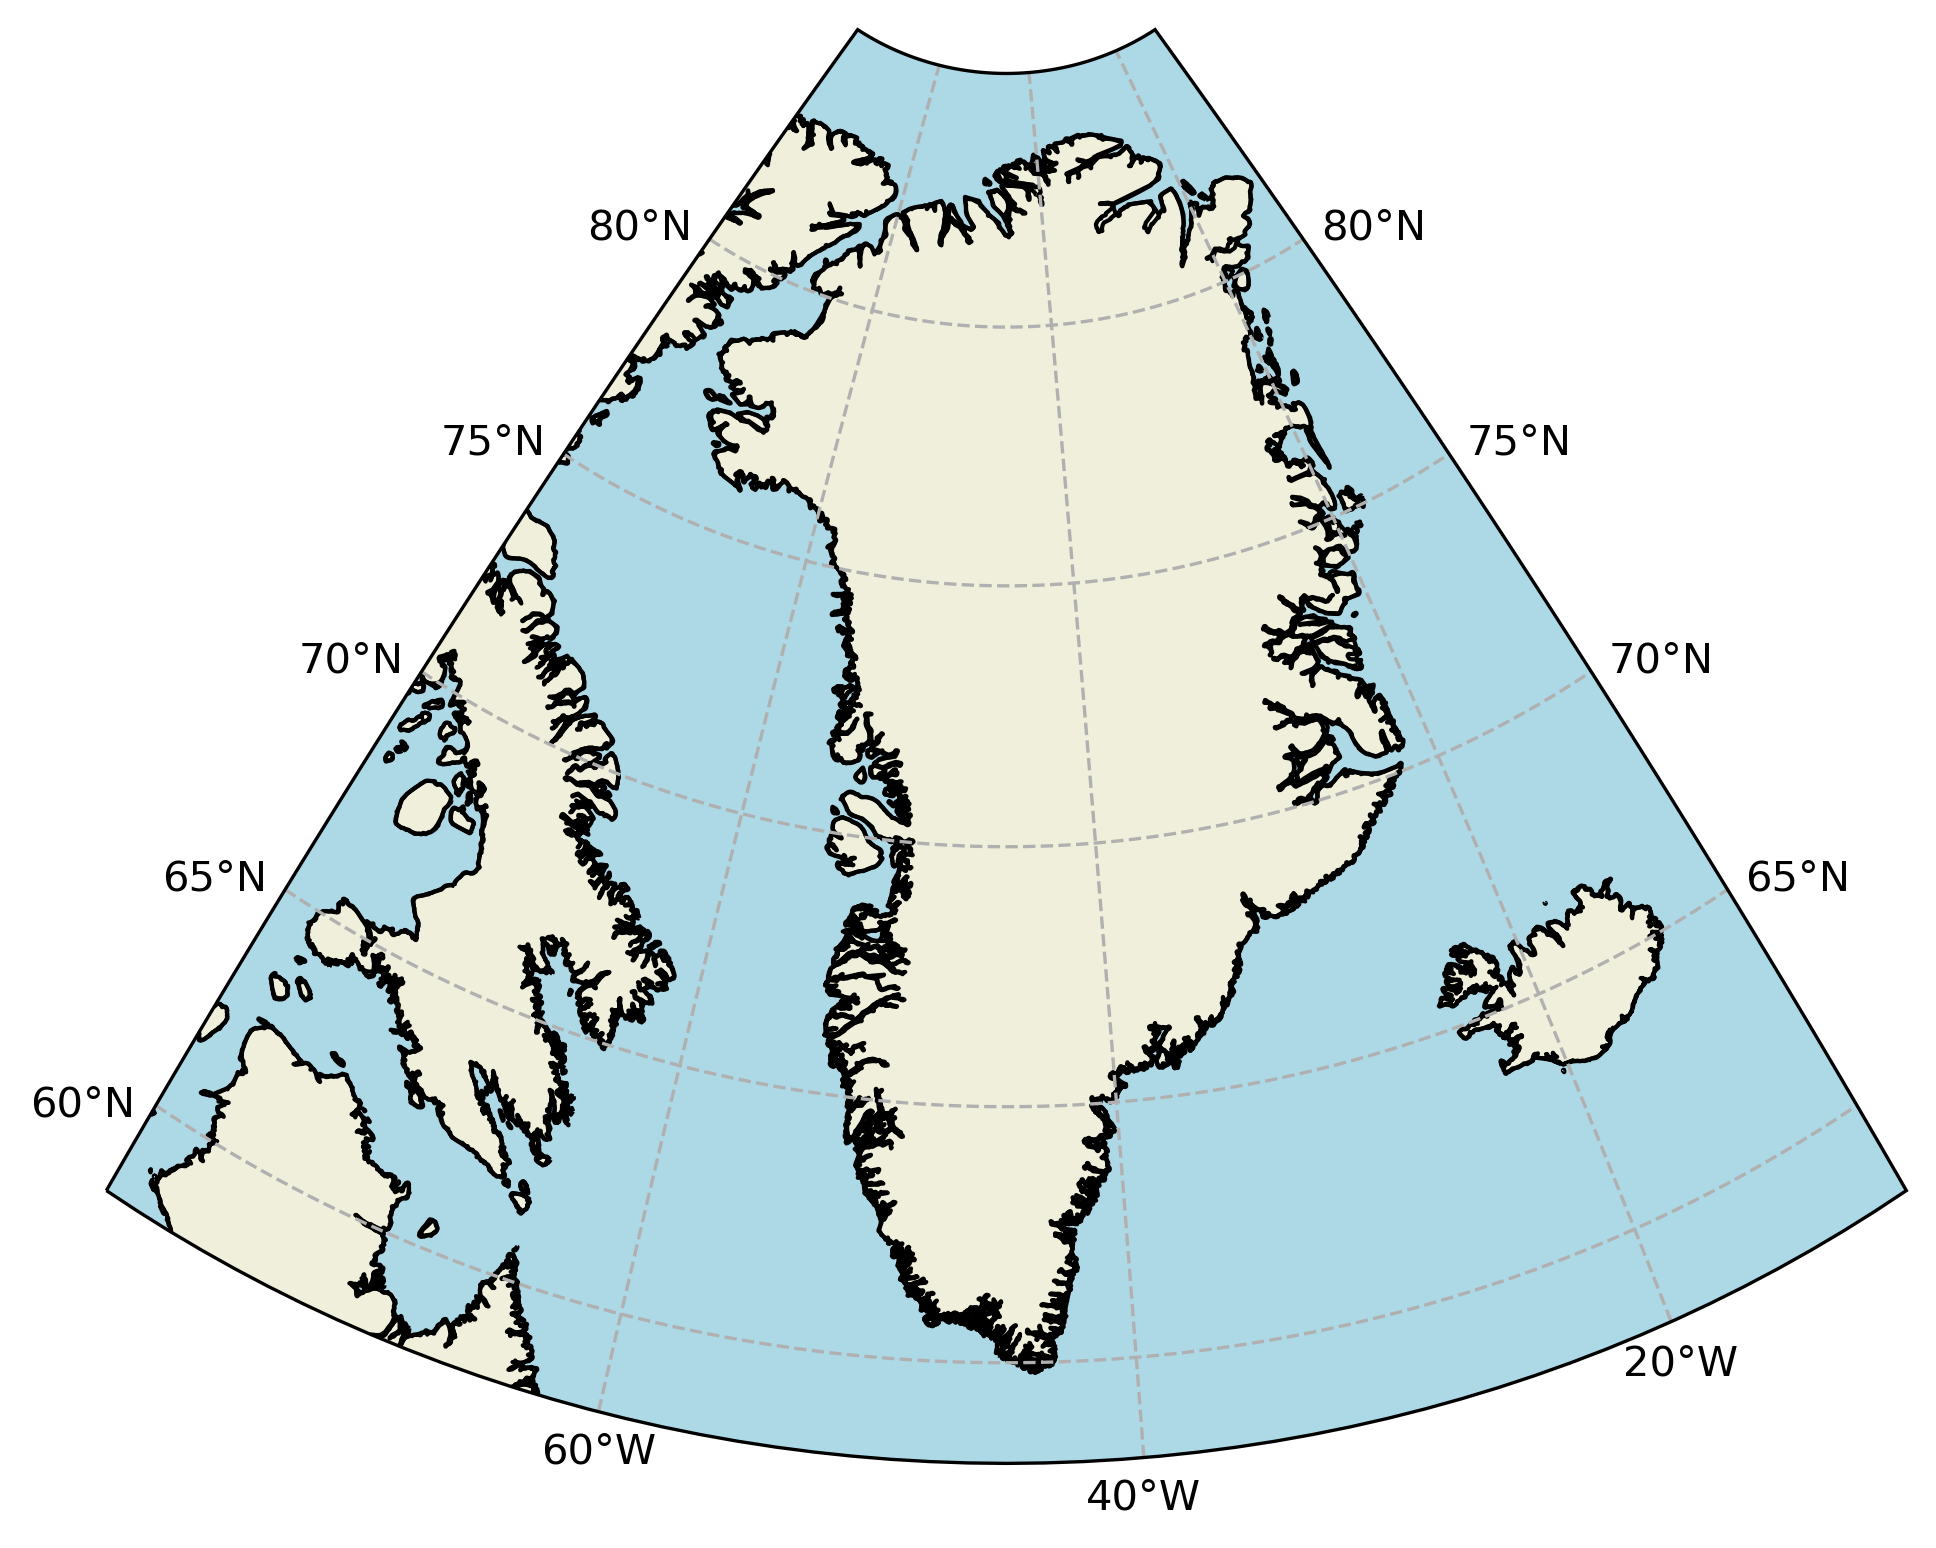
Code
# # -----------------------------------------------------------------------------
# #                自定义非矩形投影区域
# # -----------------------------------------------------------------------------
# 定义了地图的经度和纬度范围,即左侧经度、右侧经度、下方纬度和上方纬度。
leftlon, rightlon, lowerlat, upperlat = [-80, -10, 58, 85]
# 创建了一个矩形路径,用于表示地图的边界范围,并使用50个插值点对其进行插值处理。
rect = mpath.Path([[leftlon, lowerlat], [rightlon, lowerlat],
    [rightlon, upperlat], [leftlon, upperlat], [leftlon, lowerlat]]).interpolated(50)
# 定义了一个近景透视投影,设置了中心经度和中心纬度为地图范围的中心点。
proj=ccrs.NearsidePerspective(central_longitude=(leftlon+rightlon)*0.5,
    central_latitude=(lowerlat+upperlat)*0.5)
# 创建一个新的Matplotlib图形对象,指定了图形的大小和分辨率。
fig= plt.figure(figsize = (12,10),dpi=300)
# 在图形上添加一个轴,指定了轴的位置和投影类型。
ax= fig.add_axes([0.2,0.3,0.5,0.5],projection =proj)
# 在地图上添加海岸线特征,使用10m的比例尺。
ax.add_feature(cfeature.COASTLINE.with_scale('10m'))
# 创建一个转换对象,用于将地图投影坐标系转换为数据坐标系。
proj_to_data = ccrs.PlateCarree()._as_mpl_transform(ax) - ax.transData
# 将矩形边界路径转换为目标投影坐标系下的路径。
rect_in_target = proj_to_data.transform_path(rect)
# 设置地图的边界范围为转换后的目标路径。
ax.set_boundary(rect_in_target)
# 设置地图的横向范围为目标路径的最小和最大横坐标。
ax.set_xlim(rect_in_target.vertices[:,0].min(), rect_in_target.vertices[:,0].max())
# 设置地图的纵向范围为目标路径的最小和最大纵坐标。
ax.set_ylim(rect_in_target.vertices[:,1].min(), rect_in_target.vertices[:,1].max())
# 在地图上添加海洋特征,设置线宽和颜色。
ax.add_feature(cartopy.feature.OCEAN, linewidth=.3, color='lightblue')
# 在地图上添加陆地特征,设置显示顺序和边界颜色。
ax.add_feature(cartopy.feature.LAND, zorder=1, edgecolor='black')
# 添加经纬网格线,设置是否显示标签、线型等参数。
gl=ax.gridlines(draw_labels=True, x_inline=False, y_inline=False, linestyle='dashed')
gl.top_labels=False
gl.right_labels=False
gl.rotate_labels=False
gl.xlocator=ctk.LongitudeLocator(4)
gl.ylocator=ctk.LatitudeLocator(6)
gl.xformatter=ctk.LongitudeFormatter(zero_direction_label=True)
gl.yformatter=ctk.LatitudeFormatter()
示例2:兰伯特等角投影-高纬度非矩形投影(与示例1类似)
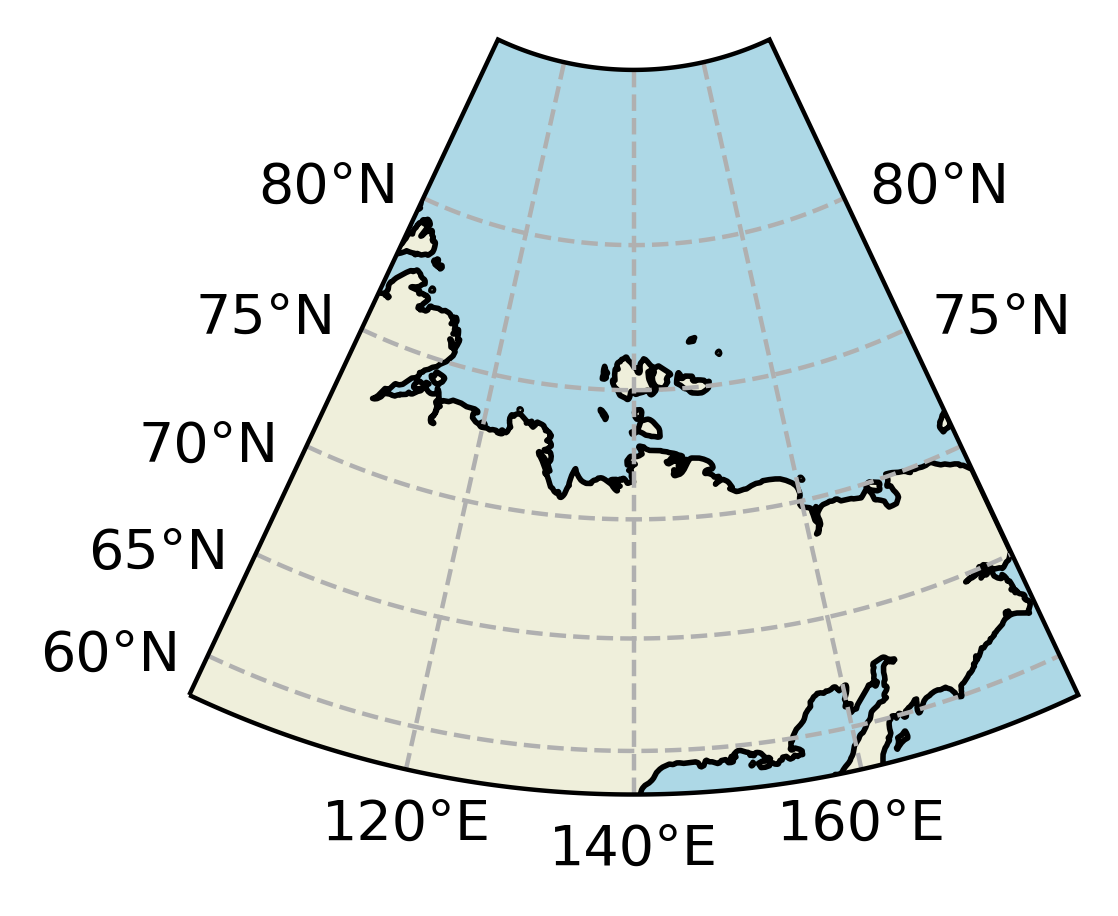
# # -----------------------------------------------------------------------------
# #                高纬度非矩形投影
# # -----------------------------------------------------------------------------

# 创建figure对象
fig = plt.figure(figsize=(3, 2.5), dpi=400, linewidth=1)
# 定义了地图的经度和纬度范围,即左侧经度、右侧经度、下方纬度和上方纬度。
lon1, lon2, lat1, lat2 = [100, 180, 58, 85]
# -----------------------------------------------------------------------------
# 创建了一个矩形路径,用于表示地图的边界范围,并使用150个插值点对其进行插值处理。
rect = mpath.Path([[lon1, lat1], [lon2, lat1],
                    [lon2, lat2], [lon1, lat2], [lon1, lat1]]).interpolated(150)
# 定义了一个兰伯特等角投影,设置了中心经度和中心纬度为地图范围的中心点。
proj = ccrs.LambertConformal(central_longitude=(lon1 + lon2) * 0.5,
                              central_latitude=(lat1 + lat2) * 0.5)
# 在图形上创建一个子图,指定了投影类型为之前定义的兰伯特等角投影。
ax = fig.subplots(1, 1, subplot_kw = {'projection': proj})
# ---关键部分-------关键部分------------------关键部分-------------------关键部分----------
proj_to_data = ccrs.PlateCarree()._as_mpl_transform(ax) - ax.transData
rect_in_target = proj_to_data.transform_path(rect)
ax.set_boundary(rect_in_target)
ax.set_xlim(rect_in_target.vertices[:, 0].min(), rect_in_target.vertices[:, 0].max())
ax.set_ylim(rect_in_target.vertices[:, 1].min(), rect_in_target.vertices[:, 1].max())
# 在地图上添加海洋特征,设置线宽和颜色。
ax.add_feature(cartopy.feature.OCEAN, linewidth=.3, color='lightblue')
# 在地图上添加陆地特征,设置显示顺序和边界颜色。
ax.add_feature(cartopy.feature.LAND, zorder=1, edgecolor='black')

ax.add_feature(cfeature.COASTLINE.with_scale('50m'), linewidth=0.1)
ax.spines['bottom'].set_linewidth('0.2')
gl=ax.gridlines(draw_labels=True, x_inline=False, y_inline=False, linestyle='dashed')
gl.top_labels=False
gl.right_labels=False
gl.rotate_labels=False
gl.xlocator=ctk.LongitudeLocator(4)
gl.ylocator=ctk.LatitudeLocator(6)
gl.xformatter=ctk.LongitudeFormatter(zero_direction_label=True)
gl.yformatter=ctk.LatitudeFormatter()
前两个示例,实现的过程基本一致,通过一个坐标转换对象加上边界限制实现非规则矩形的投影。这里可以将代码展开,进而了解其中的运行逻辑:
解析
- 创建一个子图,得到如下的一个底图:
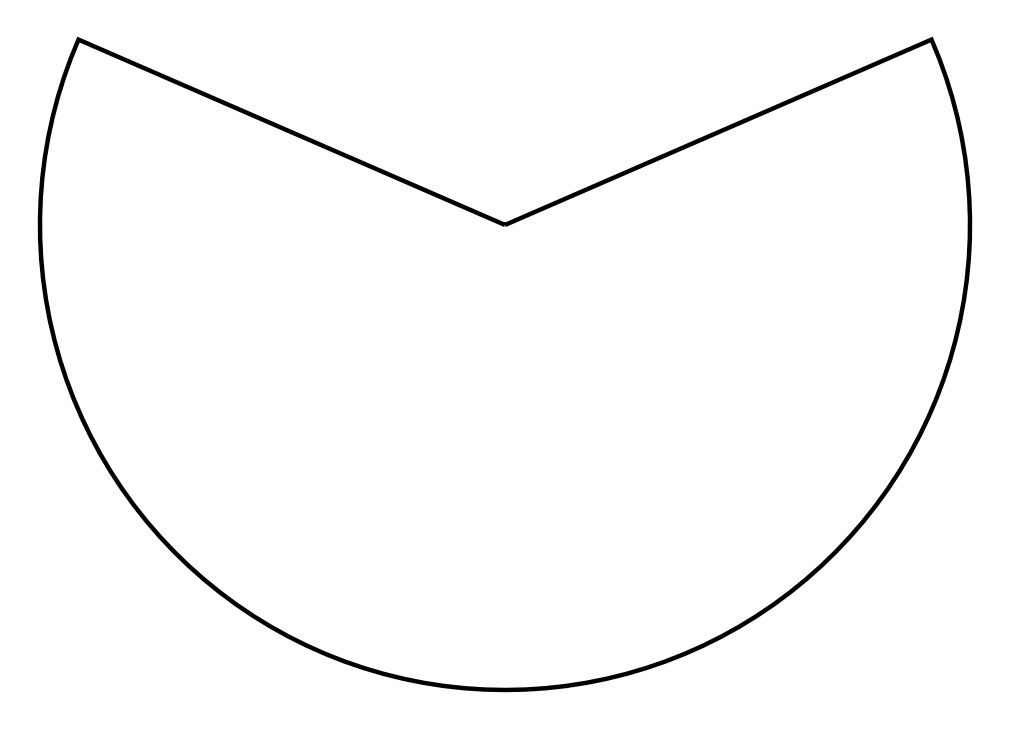
# 创建figure对象
fig = plt.figure(figsize=(3, 2.5), dpi=400, linewidth=4)
# 定义了地图的经度和纬度范围,即左侧经度、右侧经度、下方纬度和上方纬度。
lon1, lon2, lat1, lat2 = [100, 180, 58, 85]
# -----------------------------------------------------------------------------
# 创建了一个矩形路径,用于表示地图的边界范围,并使用150个插值点对其进行插值处理。
rect = mpath.Path([[lon1, lat1], [lon2, lat1],
                    [lon2, lat2], [lon1, lat2], [lon1, lat1]]).interpolated(150)
# 定义了一个兰伯特等角投影,设置了中心经度和中心纬度为地图范围的中心点。
proj = ccrs.LambertConformal(central_longitude=(lon1 + lon2) * 0.5,
                              central_latitude=(lat1 + lat2) * 0.5)
# 在图形上创建一个子图,指定了投影类型为之前定义的兰伯特等角投影。
ax = fig.subplots(1, 1, subplot_kw = {'projection': proj})
- 坐标转换并添加边界限制
值得注意的是在坐标转换中需要进行ccrs.PlateCarree()的转换,因为在使用 ax.set_boundary() 方法时,需要将路径(rect)从其当前的投影坐标系转换为与地图子图(ax)相同的坐标系。这是因为 set_boundary() 方法要求提供的路径必须与地图子图的坐标系相匹配。
在这种情况下,ccrs.PlateCarree()._as_mpl_transform(ax) 的作用是创建一个从地理坐标系(PlateCarree)到地图子图坐标系的转换。这个转换对象(proj_to_data)然后被用来将路径 rect 从地理坐标系转换到地图子图坐标系,以确保它与地图子图的坐标系相匹配。
因此,ccrs.PlateCarree() 用于创建一个地理坐标系到地图子图坐标系的转换对象,以确保正确地转换路径;虽然在理论上可以使用其他投影进行转换,但这可能会导致更多的复杂性和可能的误差。其他投影通常会在地图的不同区域产生不同的变形,因此在使用其他投影进行转换时,你需要确保理解其在特定区域内的变形特性,并相应地处理。

proj_to_data = ccrs.PlateCarree()._as_mpl_transform(ax) - ax.transData
rect_in_target = proj_to_data.transform_path(rect)
ax.set_boundary(rect_in_target)
- 设置边界范围与目标区域的边界范围一致
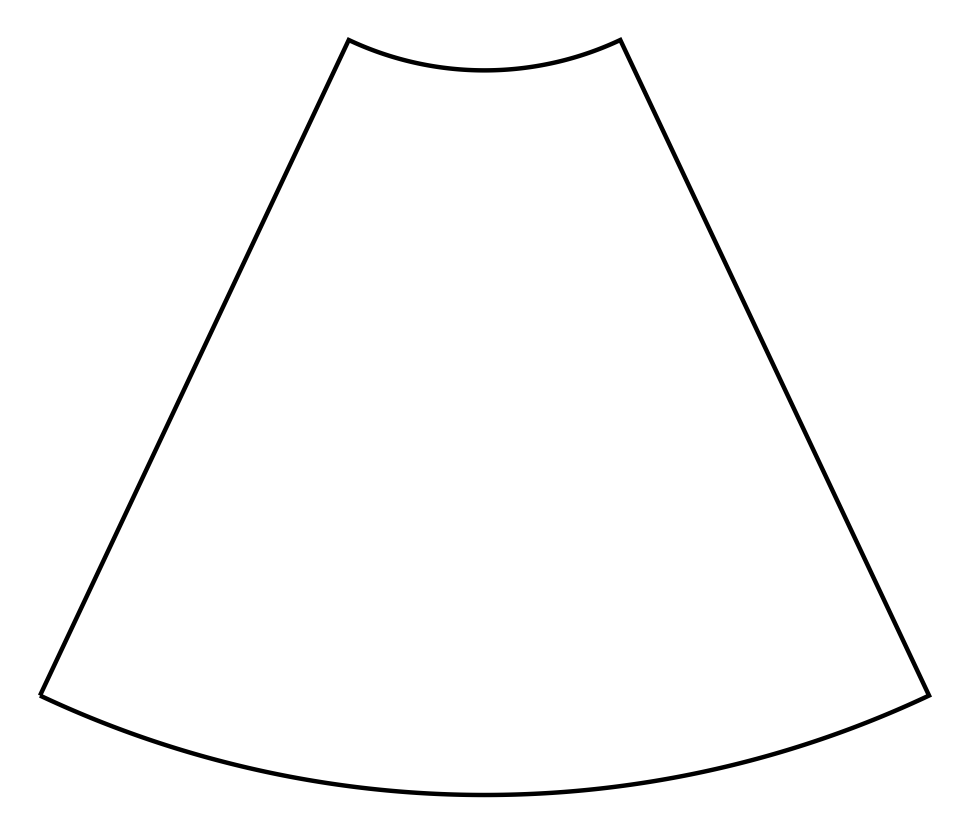
ax.set_xlim(rect_in_target.vertices[:, 0].min(), rect_in_target.vertices[:, 0].max())
ax.set_ylim(rect_in_target.vertices[:, 1].min(), rect_in_target.vertices[:, 1].max())
- 添加地图要素信息,以及标签等
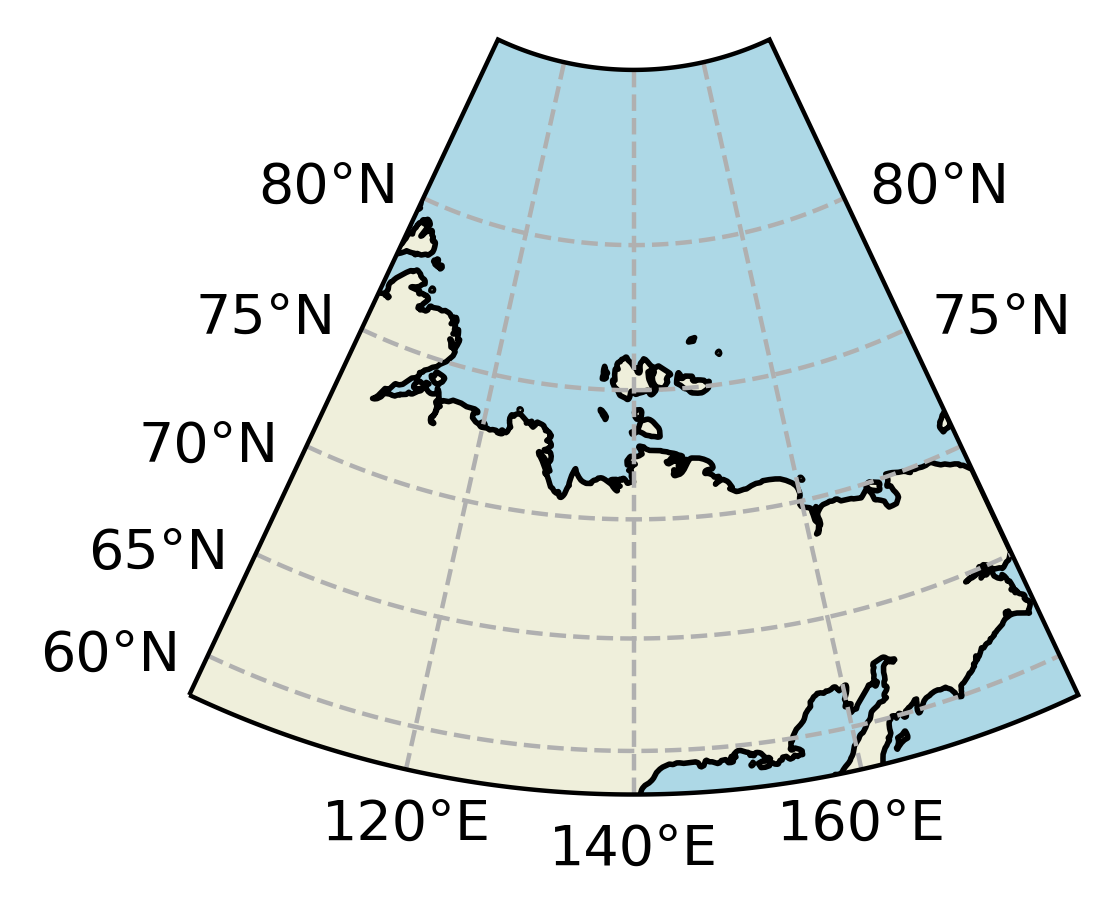
# 在地图上添加海洋特征,设置线宽和颜色。
ax.add_feature(cartopy.feature.OCEAN, linewidth=.3, color='lightblue')
# 在地图上添加陆地特征,设置显示顺序和边界颜色。
ax.add_feature(cartopy.feature.LAND, zorder=1, edgecolor='black')

ax.add_feature(cfeature.COASTLINE.with_scale('50m'), linewidth=0.1)
ax.spines['bottom'].set_linewidth('4')
gl=ax.gridlines(draw_labels=True, x_inline=False, y_inline=False, linestyle='dashed')
gl.top_labels=False
gl.right_labels=False
gl.rotate_labels=False
gl.xlocator=ctk.LongitudeLocator(4)
gl.ylocator=ctk.LatitudeLocator(6)
gl.xformatter=ctk.LongitudeFormatter(zero_direction_label=True)
gl.yformatter=ctk.LatitudeFormatter()
plt.show()
示例3: 非规则矩形投影 - 无坐标转换
- 与前两个代码相比代码更简洁一点
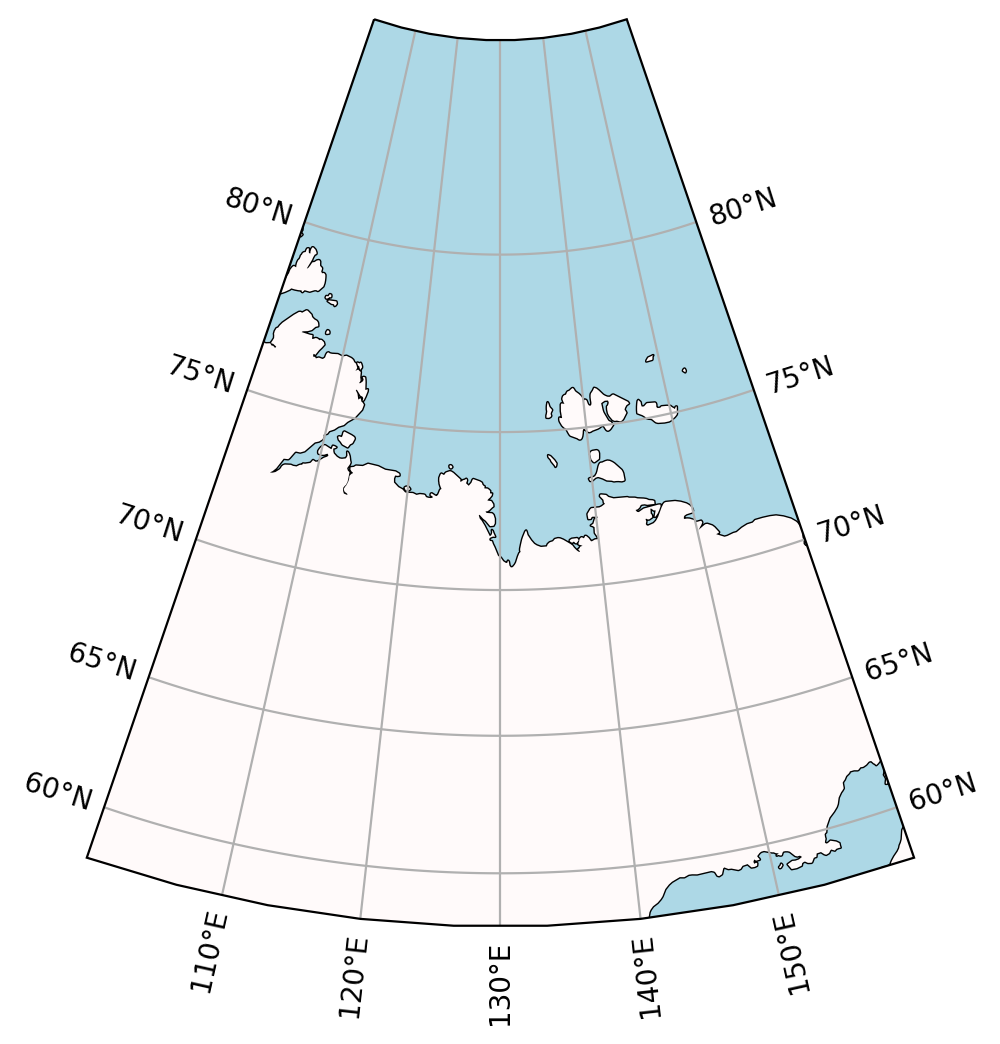
fig = plt.figure(figsize=(8,6),dpi= 200)
# 定义了地图的经度和纬度范围
xmin,xmax,ymin,ymax = [100, 160, 58, 85]
proj = ccrs.LambertConformal(central_longitude=(xmin+xmax)/2, central_latitude=(ymin+ymax)/2)
# 在图形上创建一个子图,指定了投影类型为之前定义的兰伯特等角投影。
ax = fig.add_subplot(1, 1, 1, projection=proj)
n = 10
# 创建了一个表示感兴趣区域(AOI)的路径,通过连接一系列经纬度坐标点形成闭合区域。
aoi = mpath.Path(
    list(zip(np.linspace(xmin,xmax, n), np.full(n,ymax))) + \
    list(zip(np.full(n,xmax), np.linspace(ymax,ymin, n))) + \
    list(zip(np.linspace(xmax,xmin, n), np.full(n,ymin))) + \
    list(zip(np.full(n,xmin), np.linspace(ymin,ymax, n)))
)
# 设置地图的边界范围为之前定义的感兴趣区域路径,并指定了路径的坐标系转换。
ax.set_boundary(aoi, transform=ccrs.PlateCarree())
# Plot Ocean Borders
ocean = cf.NaturalEarthFeature('physical','ocean',scale='50m',edgecolor='k',facecolor='lightblue',lw=1,linestyle='-')
ax.add_feature(ocean)
# Colored Land Background
land = cf.NaturalEarthFeature('physical','land',scale='50m',facecolor='snow',lw=1,linestyle='--')
ax.add_feature(land)
# 设置地图的显示范围为之前定义的经纬度范围,并指定了坐标系。
ax.set_extent([xmin,xmax,ymin,ymax],crs=ccrs.PlateCarree())
# Set gridlines to variable so you can manipulate them
gl = ax.gridlines(draw_labels=True,crs=ccrs.PlateCarree(),x_inline=False,y_inline=False)
# gl.xlocator = mticker.FixedLocator([110,130,150])
# gl.ylocator = mticker.FixedLocator([50,55,60,65,70])
gl.xformatter = LONGITUDE_FORMATTER
gl.yformatter = LATITUDE_FORMATTER
gl.top_labels=False
plt.show()
示例4:高纬度非规则投影添加黑色斑马线边框- 正交投影
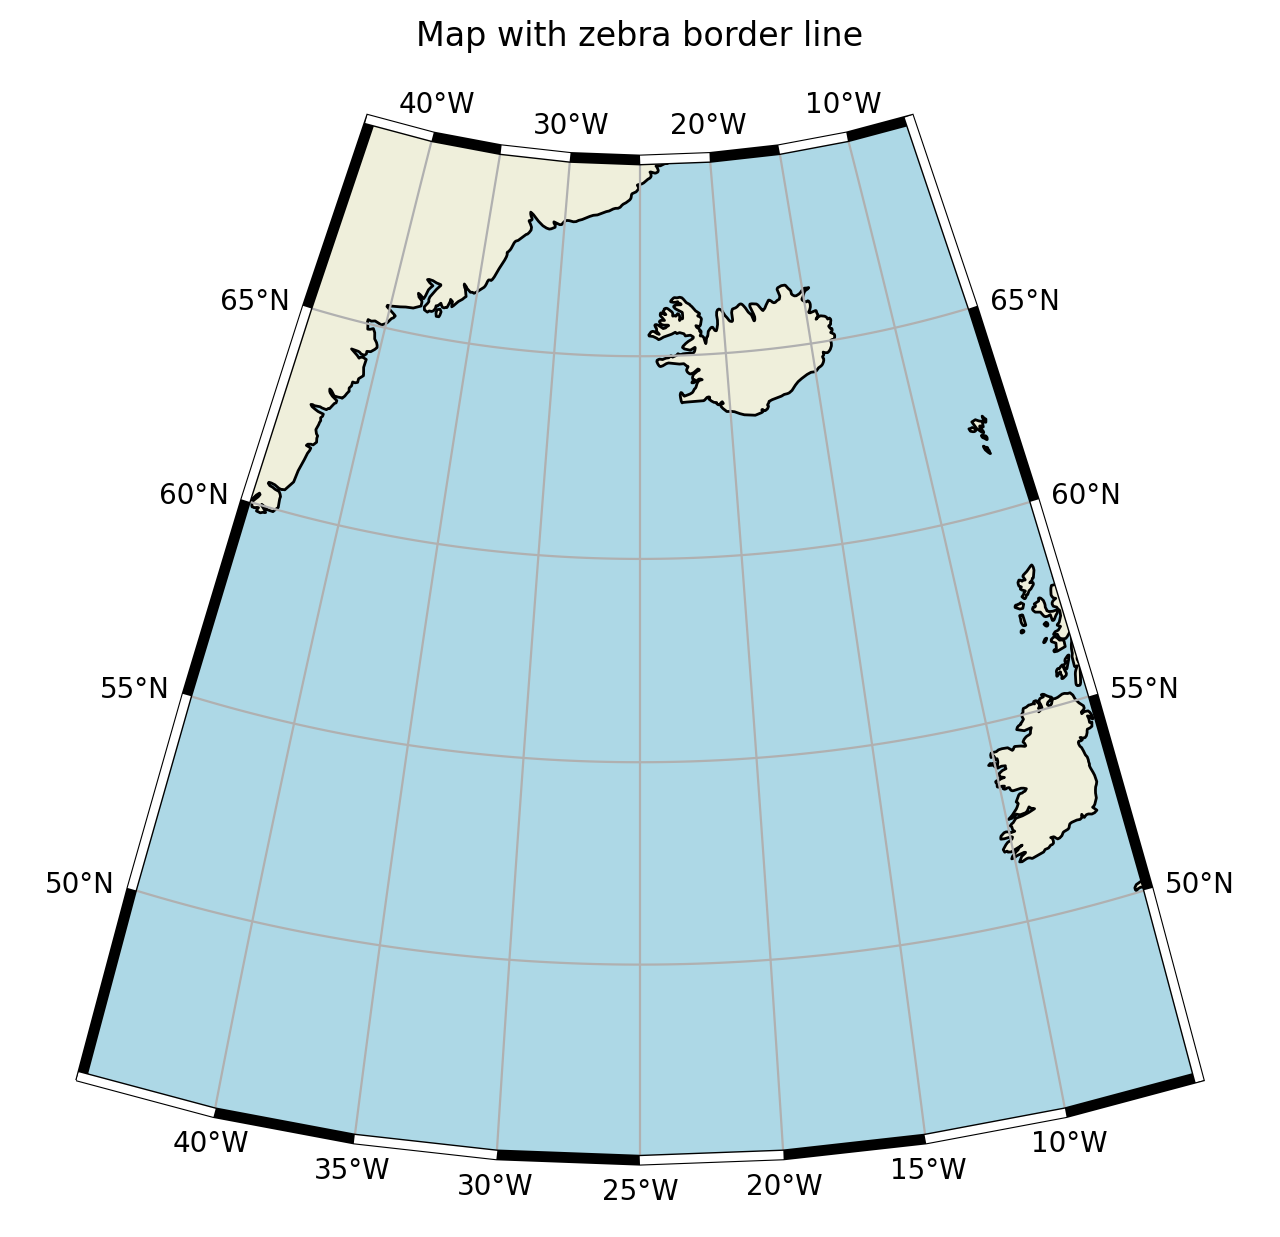
# # -----------------------------------------------------------------------------
# #                高纬度非矩形投影,添加黑色斑马线边框(matlab风格)
# # -----------------------------------------------------------------------------
# # 平面直角坐标系,中心经度设置为0度。
noProj = ccrs.PlateCarree(central_longitude=0)
# 定义了一个正交投影的地理坐标系,中心经纬度分别设置为经度-25度、纬度58度。
myProj = ccrs.Orthographic(central_longitude=-25, central_latitude=58)
# 调整了正交投影的阈值,以提高绘图的精度。
myProj._threshold = myProj._threshold/40.
fig = plt.figure(figsize=(8,12),dpi= 200)
# 在图形上创建一个子图,指定了投影类型为之前定义的正交投影。
ax = fig.add_subplot(1, 1, 1, projection=myProj)
# 使用plot函数绘制了一个多边形边界线,通过一系列经纬度坐标点来定义多边形的形状。
[ax_hdl] = ax.plot(
    [
        -45, -40, -35, -30, -25, -20, -15, -10, -5,
        -5,-5,-5,-5,-5,
        -10,-15,-20,-25,-30,-35,-40,-45,
        -45, -45, -45, -45, -45
    ],
    [
        45, 45, 45, 45, 45, 45, 45, 45, 45,
        50, 55, 60, 65, 70,
        70,70,70,70,70,70,70,70,
        65, 60, 55, 50, 45
    ],
    color='black', linewidth=0.5,
    transform=noProj)
# 获取了绘制多边形边界线后的路径,并将其转换为数据坐标系。
tx_path = ax_hdl._get_transformed_path()
# 创建了一个路径对象,表示多边形边界线的形状。
path_in_data_coords, _ = tx_path.get_transformed_path_and_affine()
# 创建了一个路径对象,表示多边形边界线的形状,
polygon1s = mpath.Path( path_in_data_coords.vertices)
vcode = [1,2,1,2,1,2,1,2,1,2,1,2,1,2,1,2,1,2,1,2,1,2,1,2,1,2,1]  #Path-code
# 创建了一个带有路径代码的路径对象。
polygon1v = mpath.Path( path_in_data_coords.vertices, vcode)
# 设置地图的边界范围为多边形边界线的形状,用于遮罩地图的不需要部分。
ax.set_boundary(polygon1s)
# 创建一个路径补丁对象,用于绘制多边形边界线的线条。
patch1s = patches.PathPatch(polygon1s, facecolor='none', ec="black", lw=7, zorder=100)
# 创建另一个路径补丁对象,用于绘制多边形边界线的虚线。
patch1v = patches.PathPatch(polygon1v, facecolor='none', ec="white", lw=6, zorder=101)
# 在地图上添加多边形边界线的线条。
ax.add_patch(patch1s)
# 在地图上添加多边形边界线的虚线。
ax.add_patch(patch1v)
# # 添加经纬网格线,设置是否显示标签等参数。
ax.gridlines(draw_labels=True, x_inline=False, y_inline=False)
# 在地图上添加海洋\陆地特征。
ax.add_feature(cartopy.feature.OCEAN, linewidth=.3, color='lightblue')
ax.add_feature(cartopy.feature.LAND, zorder=1, edgecolor='black')
ax.title.set_text("Map with zebra border line")
plt.show()
示例5:高纬度非规则投影添加黑色斑马线边框- 等经纬度投影
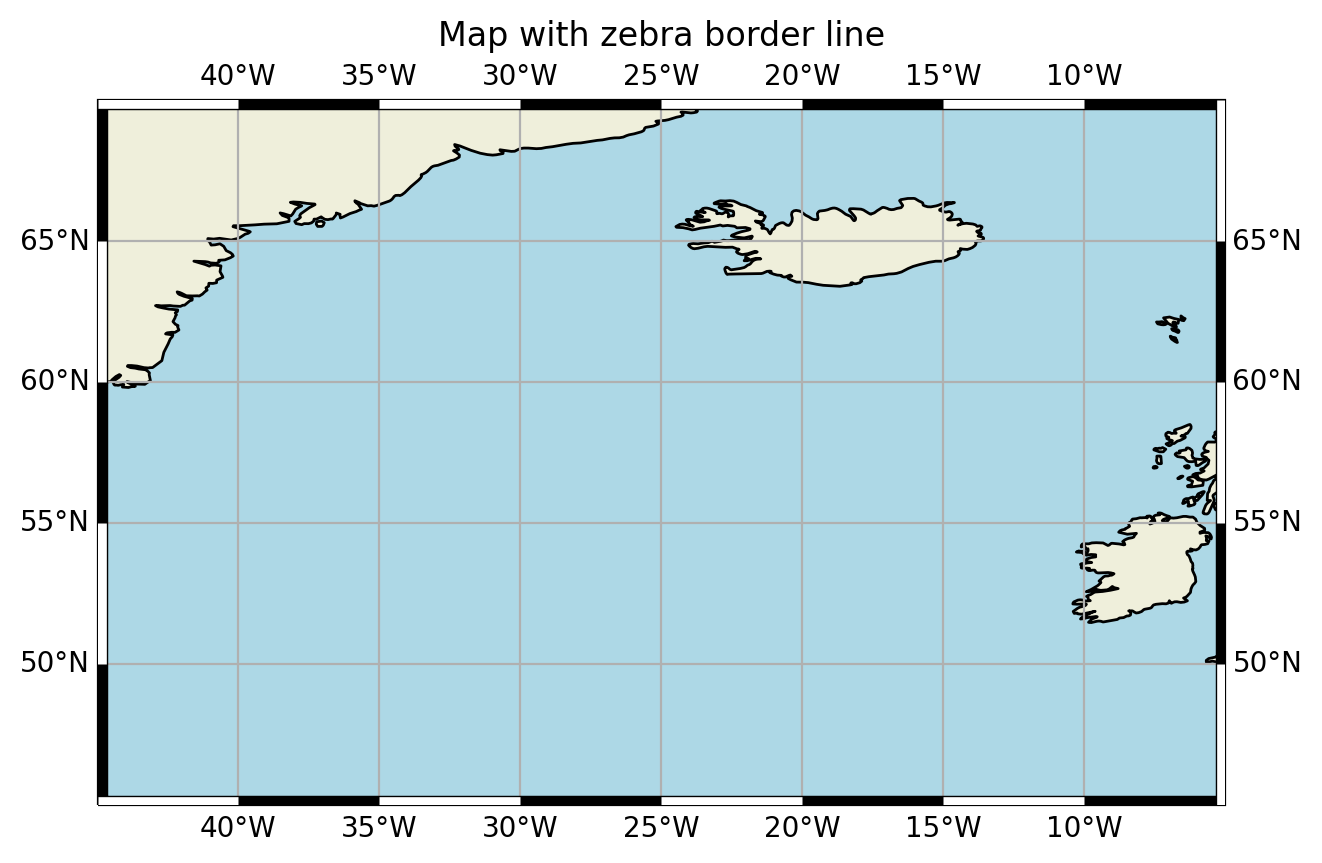
只需要在示例4的基础上将myProj = ccrs.Orthographic(central_longitude=-25, central_latitude=58),修改为myProj = ccrs.PlateCarree(central_longitude=180)即可。
当然,在我的测试下,示例4-5的代码不太友好,如果需要更换区域的话需要手动去调整,更适用于一种添加边框的思路。下面解释的这种方法,更加简便。
示例6: 等经纬度投影添加斑马线边框
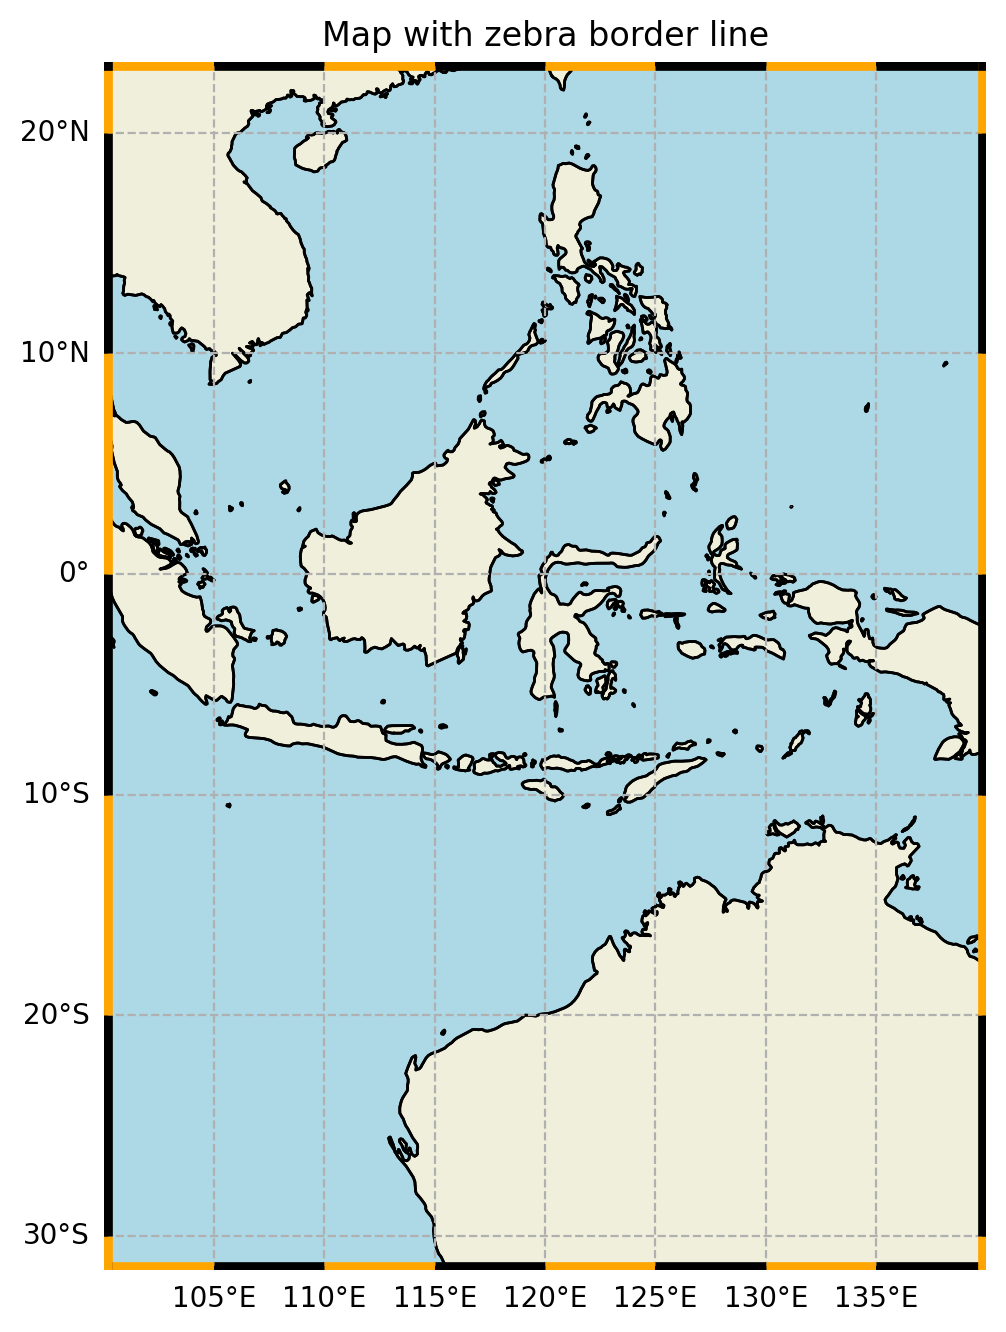
-
通过一个函数来实现边框的添加,函数首先隐藏了地图坐标轴的边框,然后获取地图的范围(左、右、底、顶)。
-
接下来,使用 itertools.cycle 创建一个交替生成黑色和橙色的迭代器,用于绘制交替的线段。
-
然后,对经度和纬度分别进行循环处理,绘制横向和纵向的线段。对于经度,线段的起点和终点在纬度范围内(底部到顶部);对于纬度,线段的起点和终点在经度范围内(左侧到右侧)。
-
对于第一个和最后一个线段,采用了 “projecting” 线段末端的样式,使得它们更突出。
-
最后,将线段绘制在地图上,使用了一些参数来控制线段的样式和外观,例如线段宽度、裁剪、投影类型等。同时,通过添加路径效果(path_effects)来增强线段的视觉效果,如增加黑色边框以突出白色线段。
通过函数的裁剪后,可以非常方便的修改ax.set_extent((100, 140, -30, 22))中的区域范围,实现区域的调整。缺点是只在等经纬度投影下的效果较好,在其他投影的效果还需要进行调整
def add_zebra_frame(ax, lw=2, crs="PlateCarree", zorder=None):
    ax.spines["geo"].set_visible(False)
    left, right, bot, top = ax.get_extent()
    # Alternate black and white line segments
    bws = itertools.cycle(["k", "orange"])
    xticks = sorted([left, *ax.get_xticks(), right])
    xticks = np.unique(np.array(xticks))
    yticks = sorted([bot, *ax.get_yticks(), top])
    yticks = np.unique(np.array(yticks))
    for ticks, which in zip([xticks, yticks], ["lon", "lat"]):
        for idx, (start, end) in enumerate(zip(ticks, ticks[1:])):
            bw = next(bws)
            if which == "lon":
                xs = [[start, end], [start, end]]
                ys = [[bot, bot], [top, top]]
            else:
                xs = [[left, left], [right, right]]
                ys = [[start, end], [start, end]]
            # For first and lastlines, used the "projecting" effect
            capstyle = "butt" if idx not in (0, len(ticks) - 2) else "projecting"
            for (xx, yy) in zip(xs, ys):
                ax.plot(
                    xx,
                    yy,
                    color=bw,
                    linewidth=6,
                    clip_on=True,
                    transform=crs,
                    zorder=zorder,
                    solid_capstyle=capstyle,
                    # Add a black border to accentuate white segments
                    path_effects=[
                        pe.Stroke(linewidth=lw + 1, foreground="black"),
                        pe.Normal(),
                    ],
                )


crs = ccrs.PlateCarree()
fig = plt.figure(figsize=(10, 8),dpi=200)
ax = fig.add_subplot(111,projection=crs)
ax.coastlines()
ax.set_extent((100, 140, -30, 22))
ax.add_feature(cfeature.OCEAN, linewidth=.3, color='lightblue')
ax.add_feature(cfeature.LAND, zorder=1, edgecolor='black')

gl = ax.gridlines(draw_labels=True, x_inline=False, y_inline=False, linestyle='dashed')
gl.top_labels = False
gl.right_labels = False
gl.rotate_labels = False
gl.xlocator = ctk.LongitudeLocator(8)
gl.ylocator = ctk.LatitudeLocator(6)
gl.xformatter = ctk.LongitudeFormatter(zero_direction_label=True)
gl.yformatter = ctk.LatitudeFormatter()
add_zebra_frame(ax, crs=crs)
ax.set_title("Map with zebra border line")
plt.show()
参考:
https://stackoverflow.com/questions/57313303/how-to-plot-zebra-style-axis-in-matplotlib
https://stackoverflow.com/questions/74124975/cartopy-fancy-box文字部分解释和代码均来自于gpt~











![[C/C++] -- 二叉树](https://img-blog.csdnimg.cn/direct/40d3967febde4c3486c9e53cbfcc084d.jpeg)
