背景
Prometheus是业内有名的开源监控工具,我所在的公司也是采用Prometheus+Grafana方式构建监控系统,并且不只是监控运维层面的数据,业务层面的服务状态也通过Java代码的客户端micrometer向Prometheus提交数据并在Grafana上配置出图,方便运营和技术同学进行查看。
在有业务数据场景下监控体系的高可用性显得尤为重要,为此特意调研各个时序数据库,力求实现简单方便的高可用方案。
在调研时看到了influxdb,虽然influxdb3.0还未发布集群开源方案,但通过订阅的方式仍然可以做到高可用的方式。
比起使用TDengine集群的方式我认为本方案更节省机器资源和维护成本。
架构
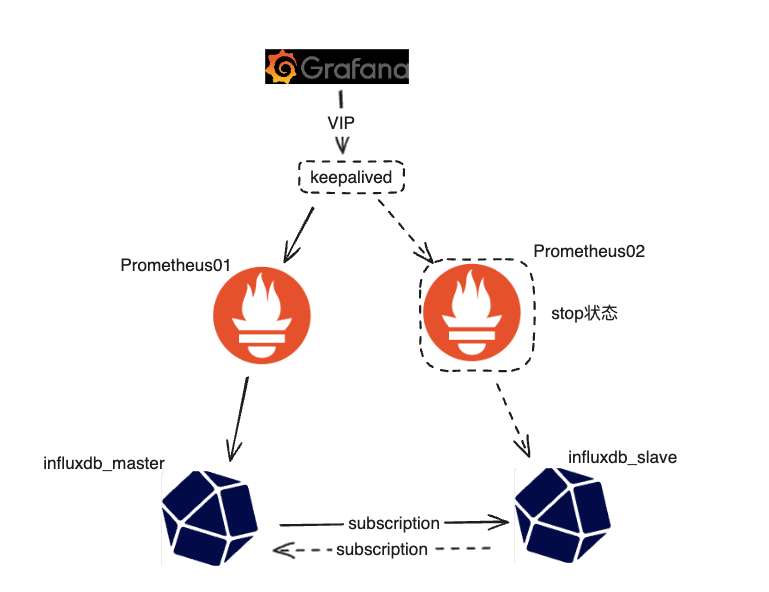
解释:虚线代表Prometheus master节点的Prometheus服务故障之后的线路。
| IP地址 | 主机名 | 操作系统 | 软件 | 网卡名 |
|---|---|---|---|---|
| 10.0.0.10 | grafana | Ubuntu 20.04.4 LTS arm64架构 | grafana_10.3.1 | ens160 |
| 10.0.0.11 | prometheus01 | Ubuntu 20.04.4 LTS arm64架构 | node_exporter-1.7.0, prometheus 2.45.3, keepalived | ens160 |
| 10.0.0.12 | influxdb-master | Ubuntu 20.04.4 LTS arm64架构 | influxdb-1.8.10 | ens160 |
| 10.0.0.13 | prometheus02 | Ubuntu 20.04.4 LTS arm64架构 | node_exporter-1.7.0, prometheus 2.45.3, keepalived | ens160 |
| 10.0.0.14 | influxdb-slave | Ubuntu 20.04.4 LTS arm64架构 | influxdb-1.8.10 | ens160 |
解释:
在10.0.0.11和10.0.0.12上分别部署node_exporter-1.7.0, prometheus 2.45.3, keepalived,并且将Prometheus01的权重调高,Prometheus02处于stop状态;
Grafana连接Prometheus的VIP地址;
Prometheus01 读写设置为influxdb_master节点;
Prometheus02 读写设置为influxdb_slave节点;
编写Keepalived脚本 实现当Prometheus01故障时 自动开启Prometheus02;
influxdb_master和influxdb_slave通过subscription的方式实现数据实时传送。
操作步骤
1.修改主机名
hostnamectl set-hostname grafana
hostnamectl set-hostname prometheus01
hostnamectl set-hostname influxdb-master
hostnamectl set-hostname prometheus02
hostnamectl set-hostname influxdb-slave
2.设置时区以及同步时间
全部都要机器都要操作
# 设置时区
timedatectl set-timezone Asia/Shanghai
# 安装基础软件
apt install -y lrzsz net-tools ntpdate
# 同步时间
/usr/sbin/ntpdate ntp1.aliyun.com
crontab -l > crontab_conf ; echo "*/5 * * * * /usr/sbin/ntpdate ntp1.aliyun.com >/dev/null 2>&1" >> crontab_conf && crontab crontab_conf && rm -f crontab_conf
timedatectl set-local-rtc 1
3.安装prometheus
只是安装Prometheus暂时不要启动,后面对配置文件更改后再启动prometheus01,02不启动;
wget https://github.com/prometheus/prometheus/releases/download/v2.45.3/prometheus-2.45.3.linux-arm64.tar.gz
mv prometheus-2.45.3.linux-arm64.tar.gz /etc/
cd /etc
tar -zxvf prometheus-2.45.3.linux-arm64.tar.gz
mv prometheus-2.45.3.linux-arm64 prometheus
rm -rf prometheus-2.45.3.linux-arm64.tar.gz
cd prometheus
mkdir data
mv prometheus promtool  /usr/local/bin/

cat > /etc/systemd/system/prometheus.service << EOF
[Unit]
Description=Prometheus
Documentation=https://prometheus.io/
After=network.target
[Service]
ExecStart=/usr/local/bin/prometheus --config.file=/etc/prometheus/prometheus.yml --storage.tsdb.path=/etc/prometheus/data --web.listen-address=0.0.0.0:9090
WorkingDirectory=/etc/prometheus/
Restart=on-failure
[Install]
WantedBy=multi-user.target
EOF

# 安装influxdb-client
apt install -y influxdb-client
4.安装node_export
我这里只安装在Prometheus所在机器作为示例,实际情况请按需配置。
wget https://github.com/prometheus/node_exporter/releases/download/v1.7.0/node_exporter-1.7.0.linux-arm64.tar.gz
tar -xvzf node_exporter-1.7.0.linux-arm64.tar.gz
cp node_exporter-1.7.0.linux-arm64/node_exporter /usr/local/bin/node_exporter
rm -rf  node_exporter-1.7.0.linux-arm64*
cat > /etc/systemd/system/node_exporter.service << EOF
[Unit]
Description=node_exporter
Documentation=https://prometheus.io/
After=network.target

[Service]
ExecStart=/usr/local/bin/node_exporter
Restart=on-failure
RestartSec=20

[Install]
WantedBy=multi-user.target
EOF

systemctl daemon-reload
systemctl restart node_exporter
systemctl status node_exporter
systemctl enable node_exporter
5.安装Keepalived
prometheus01和prometheus02都需要进行安装并配置
apt -y install keepalived ipvsadm
systemctl enable keepalived
prometheus01机器Keepalived配置文件
cat /etc/keepalived/keepalived.conf
! Configuration File for keepalived
global_defs {
   router_id 1
}
vrrp_script check_prome {
    script "/etc/keepalived/check_prome.sh"
    interval 1
    weight -50
}
vrrp_instance VI_1 {
    state MASTER
    interface ens160
    virtual_router_id 1
    mcast_src_ip 10.0.0.11
    priority 90
    advert_int 1
    authentication {
        auth_type PASS
        auth_pass 123456
    }
    track_script {
       check_prome
    }
    virtual_ipaddress {
        10.0.0.15
    }
    notify_master "/etc/keepalived/notify.sh master"
    notify_backup "/etc/keepalived/notify.sh backup"
    notify_fault "/etc/keepalived/notify.sh fault"
}
prometheus02机器Keepalived配置文件
cat /etc/keepalived/keepalived.conf
! Configuration File for keepalived
global_defs {
   router_id 2
}

vrrp_instance VI_1 {
    state BACKUP
    interface ens160
    virtual_router_id 1
    mcast_src_ip 10.0.0.13
    priority 80
    advert_int 1
    authentication {
        auth_type PASS
        auth_pass 123456
    }
    virtual_ipaddress {
        10.0.0.15
    }
    notify_master "/etc/keepalived/notify.sh master"
    notify_backup "/etc/keepalived/notify.sh backup"
    notify_fault "/etc/keepalived/notify.sh fault"
}
notify_master 当前节点成为主节点时触发脚本
notify_backup 当前节点成为备节点时触发脚本
notify_fault 当前节点转为"失败"状态时触发的脚本
6.设置Keepalived脚本
Keepalived主备切换时执行脚本_51CTO博客_keepalived主备切换
prometheus01 prometheus02机器都需要设置
prometheus_check.sh脚本
vim /etc/keepalived/check_prome.sh
chmod +x /etc/keepalived/check_prome.sh
记得创建脚本后赋予执行权限
#!/bin/bash
processes_num=$(ps -ef |grep [p]rometheus|wc -l)
if [ $processes_num = 0 ]
then
   exit 1
else
   exit 0
fi
notify.sh脚本
vim /etc/keepalived/notify.sh
chmod +x /etc/keepalived/notify.sh
记得创建脚本后赋予执行权限
master机器脚本
#!/bin/bash
case $1 in
    master)
        systemctl start prometheus
        influx -host 10.0.0.12  -username root -password 2024.168 -database prometheus -execute """CREATE SUBSCRIPTION "prometheus" ON "prometheus"."prometheus" DESTINATIONS ALL 'http://prometheus:prometheus@2024.@10.0.0.14:8086';"""
        ;;
    backup)
        systemctl stop prometheus
        influx -host 10.0.0.12 -username root -password 2024.168 -database prometheus -execute """DROP SUBSCRIPTION "prometheus" ON "prometheus"."prometheus";"""
        ;;
    fault)
        systemctl stop prometheus
        influx -host 10.0.0.12  -username root -password 2024.168 -database prometheus -execute """DROP SUBSCRIPTION "prometheus" ON "prometheus"."prometheus";"""
        ;;
    *)
        echo "不支持该参数,请检查输入的参数是否正确"
esac
slave机器脚本
#!/bin/bash
case $1 in
    master)
        systemctl start prometheus
        influx -host 10.0.0.14 -username root -password 2024.168 -database prometheus -execute """CREATE SUBSCRIPTION "prometheus" ON "prometheus"."prometheus" DESTINATIONS ALL 'http://prometheus:prometheus@2024.@10.0.0.12:8086';"""
        ;;
    backup)
        systemctl stop prometheus
        influx -host 10.0.0.14 -username root -password 2024.168 -database prometheus -execute """DROP SUBSCRIPTION "prometheus" ON "prometheus"."prometheus";"""
        ;;
    fault)
        systemctl stop prometheus
        influx -host 10.0.0.14 -username root -password 2024.168 -database prometheus -execute """DROP SUBSCRIPTION "prometheus" ON "prometheus"."prometheus";"""
        ;;
    *)
        echo "不支持该参数,请检查输入的参数是否正确"
esac
7.安装influxdb
wget https://dl.influxdata.com/influxdb/releases/influxdb-1.8.10_linux_arm64.tar.gz
tar xvfz influxdb-1.8.10_linux_arm64.tar.gz
sudo cp ./influxdb-1.8.10-1/usr/bin/* /usr/local/bin/
mv influxdb-1.8.10-1/etc/influxdb/  /etc/

cat > /etc/systemd/system/influxd.service << EOF
[Unit]
Description=influxd
Documentation=https://docs.influxdata.com/influxdb/v1/install/?t=Linux
After=network.target

[Service]
ExecStart=/usr/local/bin/influxd -config /etc/influxdb/influxdb.conf
Restart=on-failure
RestartSec=20

[Install]
WantedBy=multi-user.target
EOF


# 启动influxdb
systemctl daemon-reload
systemctl restart influxd
systemctl enable influxd
systemctl status influxd

# 开启用户认证
vim /etc/influxdb/influxdb.conf
auth-enabled = true

# 重新启动
systemctl restart influxd
8.创建管理员账户
# 创建管理员账户
CREATE USER root WITH PASSWORD '2024.168' WITH ALL PRIVILEGES

> show databases;
ERR: unable to parse authentication credentials
Warning: It is possible this error is due to not setting a database.
Please set a database with the command "use <database>".

# 进行认证
> auth
username: root
password:
> show databases;
name: databases
name
----
_internal
9.创建存储监控数据的库
不需要创建表 配置Prometheus后会自动创建表;
influxdb-master 和 influxdb-slave 都需要创建
influx
auth
create database prometheus;
# 创建默认的保留策略
use prometheus
CREATE RETENTION POLICY "prometheus" ON "prometheus" DURATION 1h REPLICATION 1 DEFAULT
show databases;
回显
> show databases;
name: databases
name
----
prometheus
_internal
创建prometheus账户并设置权限
# 创建Prometheus账户并设置权限
CREATE USER prometheus WITH PASSWORD 'prometheus@2024.'
GRANT ALL ON "prometheus" TO "prometheus"
SHOW USERS
Influxdb-master手动创建订阅
use prometheus
CREATE SUBSCRIPTION "prometheus" ON "prometheus"."prometheus" DESTINATIONS ALL 'http://prometheus:prometheus@2024.@10.0.0.14:8086'
10.配置Prometheus01
vim /etc/prometheus/prometheus.yml
global:
  scrape_interval: 15s
  evaluation_interval: 15s
scrape_configs:
  - job_name: "prometheus"
    static_configs:
      - targets: ["10.0.0.11:9100", "10.0.0.13:9100"]
remote_write:
  - url: "http://10.0.0.12:8086/api/v1/prom/write?db=prometheus&u=prometheus&p=prometheus@2024."
    remote_timeout: 30s
    queue_config:
        capacity: 100000
        max_shards: 1000
        max_samples_per_send: 1000
        batch_send_deadline: 5s
        min_backoff: 30ms
        max_backoff: 100ms
remote_read:
  - url: "http://10.0.0.12:8086/api/v1/prom/read?db=prometheus&u=prometheus&p=prometheus@2024."
    remote_timeout: 10s
    read_recent: true
11.配置Prometheus02
vim /etc/prometheus/prometheus.yml
global:
  scrape_interval: 15s
  evaluation_interval: 15s
scrape_configs:
  - job_name: "prometheus"
    static_configs:
      - targets: ["10.0.0.11:9100", "10.0.0.13:9100"]
remote_write:
  - url: "http://10.0.0.14:8086/api/v1/prom/write?db=prometheus&u=prometheus&p=prometheus@2024."
    remote_timeout: 30s
    queue_config:
        capacity: 100000
        max_shards: 1000
        max_samples_per_send: 1000
        batch_send_deadline: 5s
        min_backoff: 30ms
        max_backoff: 100ms
remote_read:
  - url: "http://10.0.0.14:8086/api/v1/prom/read?db=prometheus&u=prometheus&p=prometheus@2024."
    remote_timeout: 10s
    read_recent: true
12.启动Prometheus01
systemctl daemon-reload
systemctl start prometheus
systemctl enable prometheus
systemctl restart prometheus
systemctl status prometheus
启动keepalived并检查VIP
# 启动
systemctl start  keepalived
# 检查VIP
root@prometheus01:~# ip a
1: lo: <LOOPBACK,UP,LOWER_UP> mtu 65536 qdisc noqueue state UNKNOWN group default qlen 1000
    link/loopback 00:00:00:00:00:00 brd 00:00:00:00:00:00
    inet 127.0.0.1/8 scope host lo
       valid_lft forever preferred_lft forever
    inet6 ::1/128 scope host
       valid_lft forever preferred_lft forever
2: ens160: <BROADCAST,MULTICAST,UP,LOWER_UP> mtu 1500 qdisc fq_codel state UP group default qlen 1000
    link/ether 00:0c:29:af:7d:17 brd ff:ff:ff:ff:ff:ff
    inet 10.0.0.11/24 brd 10.0.0.255 scope global ens160
       valid_lft forever preferred_lft forever
    inet 10.0.0.15/32 scope global ens160
       valid_lft forever preferred_lft forever
    inet6 fe80::20c:29ff:feaf:7d17/64 scope link
       valid_lft forever preferred_lft forever
13.安装grafana
sudo apt-get install -y adduser libfontconfig1 musl
wget https://dl.grafana.com/oss/release/grafana_10.3.1_arm64.deb
sudo dpkg -i grafana_10.3.1_arm64.deb
# 启动Grafana
sudo /bin/systemctl daemon-reload
sudo /bin/systemctl enable grafana-server
sudo /bin/systemctl start grafana-server
# 默认账户名密码
admin/admin
# 配置数据源时设置VIP地址 切记!!!

# 导入Linux监控面板
8919
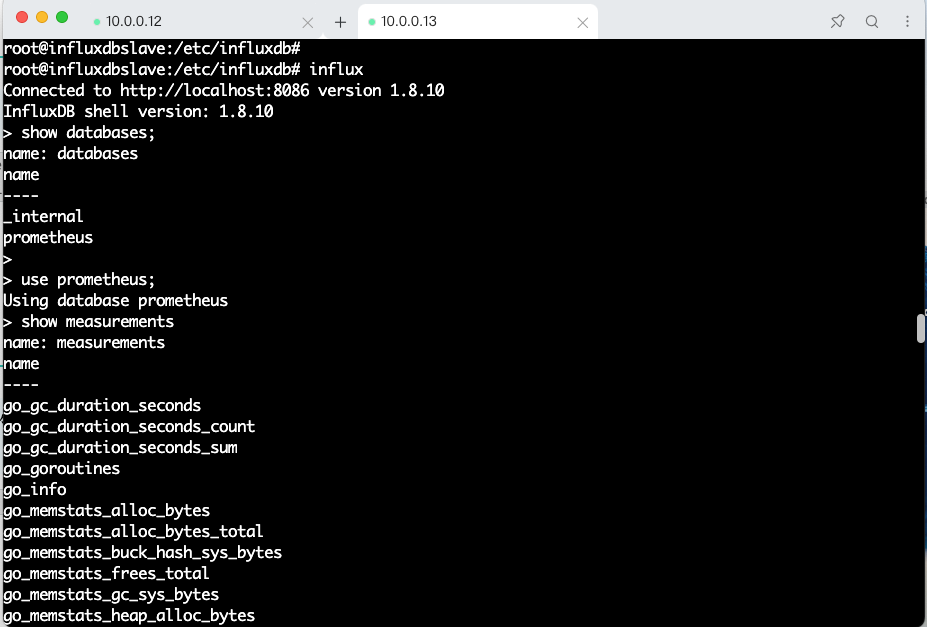
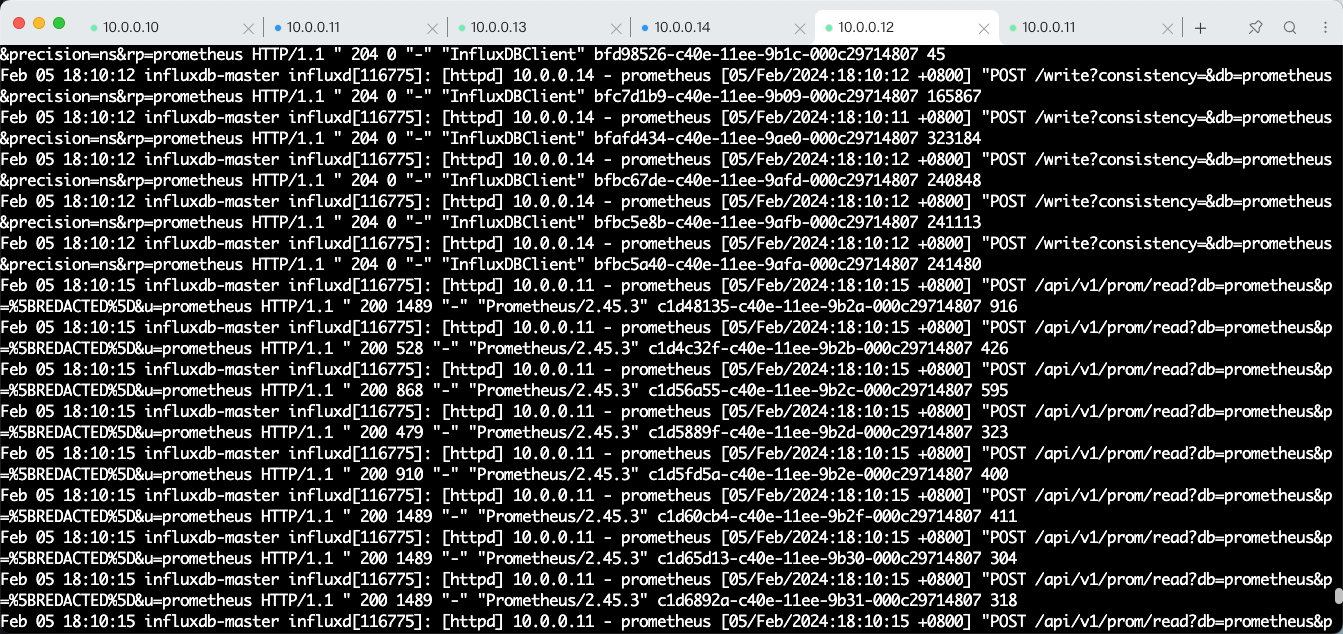
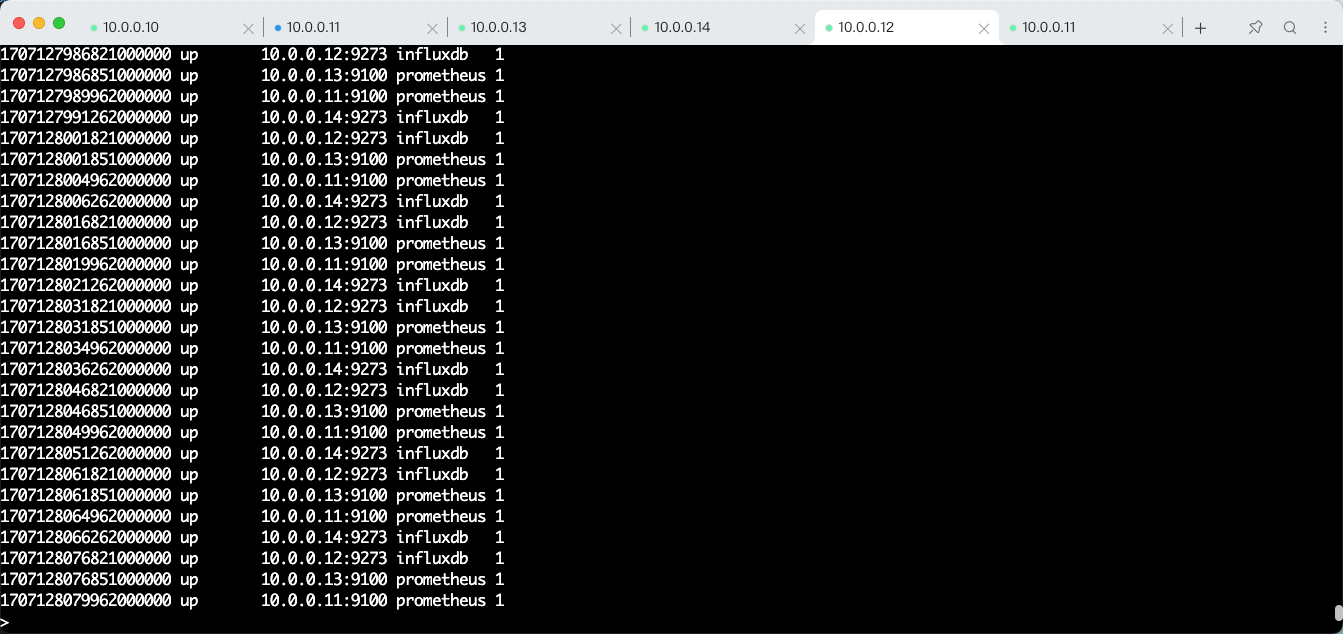
14.查看influxdb数据
use prometheus
show measurements
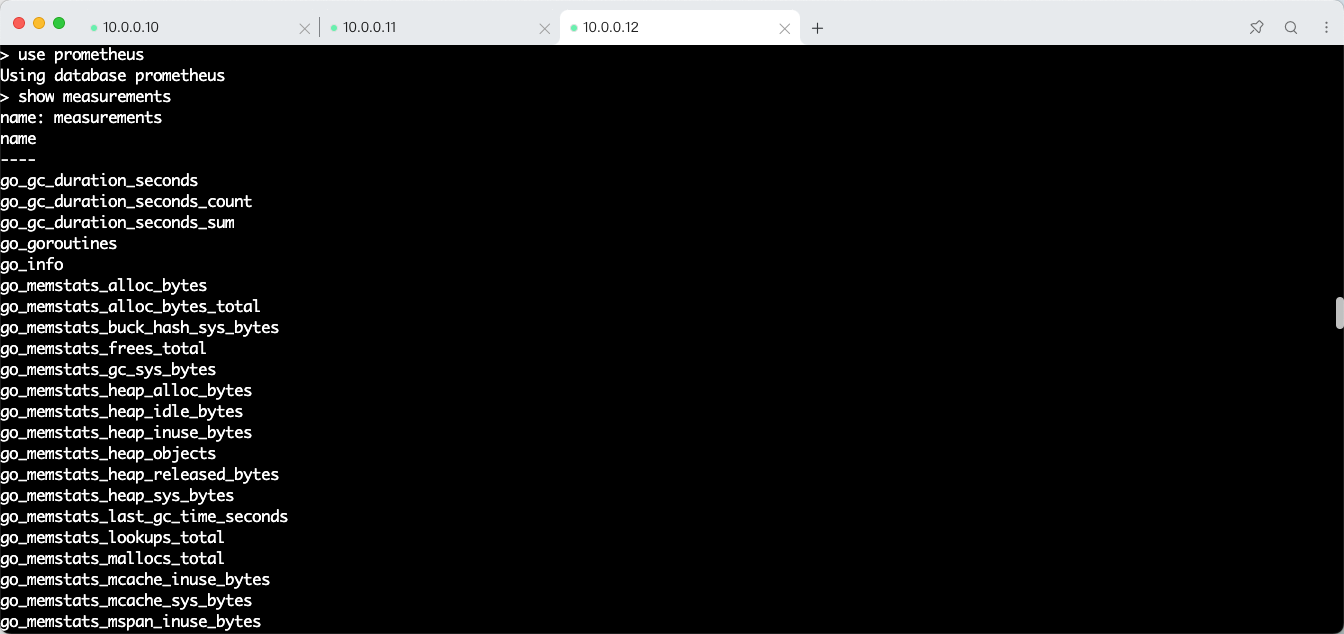
回显
> select * from go_info;
name: go_info
time                __name__ instance       job        value version
----                -------- --------       ---        ----- -------
1706866563610000000 go_info  127.0.0.1:9100 prometheus 1     go1.21.4
1706866578610000000 go_info  127.0.0.1:9100 prometheus 1     go1.21.4
1706866593610000000 go_info  127.0.0.1:9100 prometheus 1     go1.21.4
1706866608610000000 go_info  127.0.0.1:9100 prometheus 1     go1.21.4
1706866623610000000 go_info  127.0.0.1:9100 prometheus 1     go1.21.4
1706866638610000000 go_info  127.0.0.1:9100 prometheus 1     go1.21.4
1706866653612000000 go_info  127.0.0.1:9100 prometheus 1     go1.21.4
>
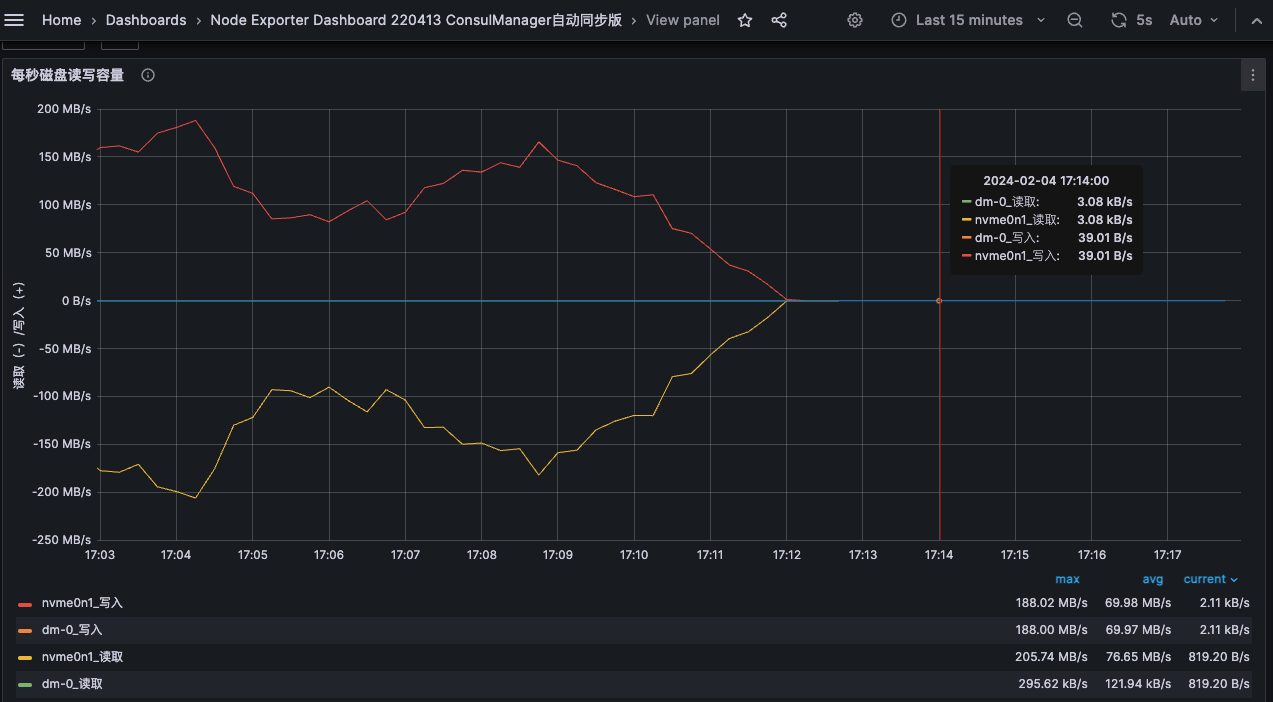
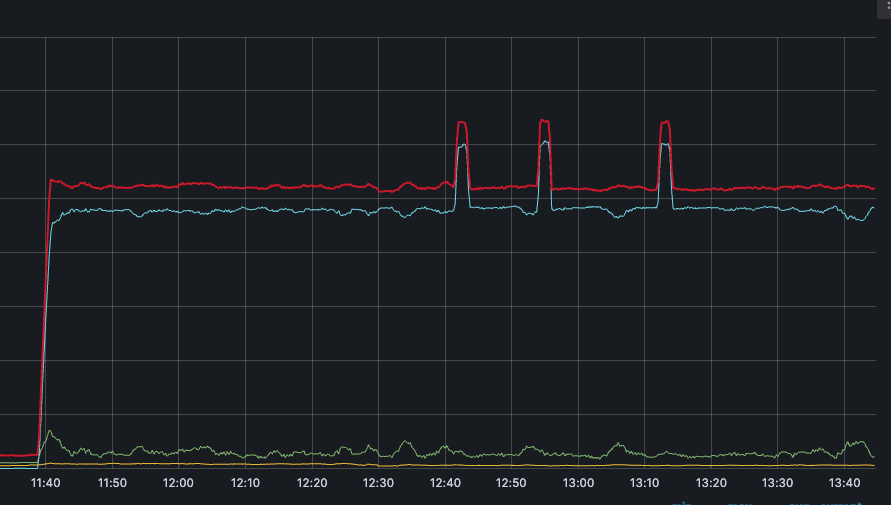
15.实验验证
在压测磁盘的时候进行操作:
1、 关闭Prometheus01,查看VIP是否会转移到Prometheus02 并且自动设置Prometheus启动
2、启动Prometheus01,查看VIP是否回到了Prometheus01 并且Prometheus02的Prometheus服务关闭
验证操作过程中 显示磁盘读写的图表是否中断,全程图表没有中断则说明高可用架构已经实现。
# 压测命令
while true; do  dd if=/dev/nvme0n1p2  of=/testrw.dbf bs=4k && rm -rf /testrw.dbf; done
测试效果的另外一种验证方式
root@influxdb-slave:~# influx -username root -password 2024.168 -database prometheus -execute 'select * from node_cpu_seconds_total;' > 1.txt && wc -l 1.txt
771 1.txt
root@influxdb-slave:~#

root@influxdb-master:~# influx -username root -password 2024.168 -database prometheus -execute 'select * from node_cpu_seconds_total;' > 1.txt && wc -l 1.txt
771 1.txt
root@influxdb-master:~#
保存策略已经测试过了 是OK的 不过并不会特别严格:
我创建了一个保留1小时的保存策略,从15点开始测试数据 但16点不会立刻将15点的数据给清理掉。我测试的现象是 16点30分左右 15点的数据已经清理了一部分了。
补充
influxdb可视化
文档:Chronograf 文档 (influxdata.com)
创建订阅
严格按照示例中的单引号和双引号来设置,否则容易报错。
本方案中只有第一次启动Prometheus01时需要手动设置订阅,其他情况下都会通过Keepalived的notify脚本来自动设置订阅。
influxb-master操作
use prometheus
CREATE SUBSCRIPTION "prometheus" ON "prometheus"."prometheus" DESTINATIONS ALL 'http://prometheus:prometheus@2024.@10.0.0.14:8086'
Influxb-slave操作
use prometheus
CREATE SUBSCRIPTION 'prometheus' ON 'prometheus'.'prometheus' DESTINATIONS ALL 'http://prometheus:prometheus@2024.@10.0.0.12:8086'
查看订阅
> SHOW SUBSCRIPTIONS
name: prometheus
retention_policy name       mode destinations
---------------- ----       ---- ------------
autogen          prometheus ALL  [http://10.0.0.13:8086]
> SHOW SUBSCRIPTIONS
name: prometheus
retention_policy name       mode destinations
---------------- ----       ---- ------------
autogen          prometheus ALL  [http://10.0.0.12:8086]
如果要删除订阅可以采用下面的命令
DROP SUBSCRIPTION "prometheus" ON "prometheus"."autogen"
数据备份
当有备份需要时进行设置,在本方案中并不采用这种方式来备份。
InfluxDB OSS 备份和还原 | InfluxDB v1.8 Documentation (cnosdb.com)
root@influxdb:~/backup# influxd backup -portable -database  prometheus -host 127.0.0.1:8088 .
2024/02/04 10:14:49 backing up metastore to meta.00
2024/02/04 10:14:49 backing up db=prometheus
2024/02/04 10:14:49 backing up db=prometheus rp=autogen shard=2 to prometheus.autogen.00002.00 since 0001-01-01T00:00:00Z
2024/02/04 10:14:49 backup complete:
2024/02/04 10:14:49     20240204T021449Z.meta
2024/02/04 10:14:49     20240204T021449Z.s2.tar.gz
2024/02/04 10:14:49     20240204T021449Z.manifest
数据恢复
当influxdb出现故障时 用于恢复数据
root@influxdb:~/backup# influxd restore -portable -host 10.0.0.13:8088 -db prometheus .
2024/02/04 10:20:40 Restoring shard 2 live from backup 20240204T021449Z.s2.tar.gz
如果要将数据还原到已经存在的数据库:
不能直接还原到已经存在的数据库中,如果尝试将restore命令运行到现有的数据库中,则会收到以下信息:
influxd restore -portable -db existingdb path-to-backup
2018/08/30 13:42:46 error updating meta: DB metadata not changed. database may already exist
restore: DB metadata not changed. database may already exist
正确的做法是:
-
将现有的数据备份还原到临时数据库
influxd restore -portable -db prometheus -newdb prometheus_bak path-to-backup -
侧向加载数据 (使用
SELECT ... INTO语句) 放入现有目标数据库,并删除临时数据库> USE prometheus_bak > SELECT * INTO prometheus..:MEASUREMENT FROM /.*/ GROUP BY * > DROP DATABASE prometheus_bak
数据清理
监控数据我们只关注最近半年或者一年的,如果单纯的是监控数据可能保留的时间更短,我们可以根据需要定时清理不需要的数据。
数据清理我这里采用保留策略的方式,超过30天的监控数据自动清理;并设置为默认策略。
CREATE RETENTION POLICY "prometheus" ON "prometheus" DURATION 30d REPLICATION 1 DEFAULT
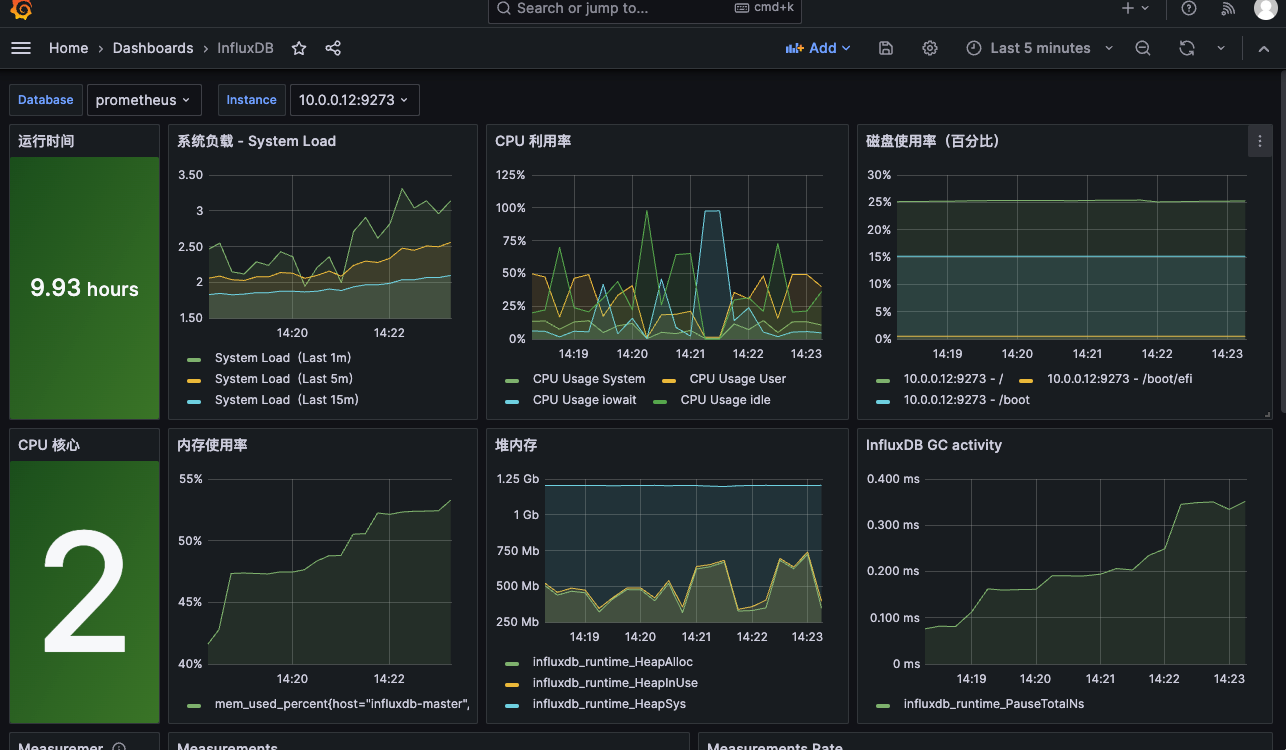
监控influxdb
influxdb不需要通过第三方工具暴露数据采集端口,influxdb本身已经提供了该端口,但influxdb自带的监控参数太少,我们采用influxdb_exporter的方式采集influxdb指标。
10.0.0.12:8086/metrics
Telegraf 是一个插件驱动的服务器代理,用于从数据库、系统和物联网传感器收集和发送指标和事件。Telegraf 是用 Go 编写的,编译成一个没有外部依赖关系的二进制文件,并且需要非常小的内存占用。
Telegraf 文档 (influxdata.com)
安装Telegraf
wget https://dl.influxdata.com/telegraf/releases/telegraf-1.29.4_linux_arm64.tar.gz
tar xf telegraf-1.29.4_linux_arm64.tar.gz
mv telegraf-1.29.4/usr/lib/telegraf/scripts/telegraf.service /etc/systemd/system/
mv telegraf-1.29.4/etc/telegraf /etc/
mv telegraf-1.29.4/usr/bin/telegraf /usr/bin/telegraf
# 配置system管理
cat > /etc/systemd/system/telegraf.service << EOF
[Unit]
Description=Telegraf
Documentation=https://github.com/influxdata/telegraf
After=network-online.target
Wants=network-online.target

[Service]
ExecStart=/usr/bin/telegraf -config /etc/telegraf/telegraf.conf -config-directory /etc/telegraf/telegraf.d $TELEGRAF_OPTS
Restart=on-failure
RestartSec=20

[Install]
WantedBy=multi-user.target
EOF

# 配置
vim /etc/telegraf/telegraf.conf
[[outputs.prometheus_client]]
  listen = ":9273"

[[inputs.influxdb]]
  urls = [
    "http://localhost:8086/debug/vars"

  username = "prometheus"
  password = "prometheus@2024."

# 启动
systemctl daemon-reload
systemctl restart telegraf
systemctl enable telegraf
systemctl status telegraf
修改Prometheus01 Prometheus02配置文件添加以下内容:
  - job_name: "influxdb"
    static_configs:
      - targets: ["10.0.0.12:9273", "10.0.0.14:9273"]
grafana
引入监控面板:11334
方案调整
相互订阅
最开始的influxdb-master和influxdb-slave 是采用相互订阅的方式
发现相互订阅虽然数据是不会重复的,但是会出现相互发送数据会有CPU高的问题。
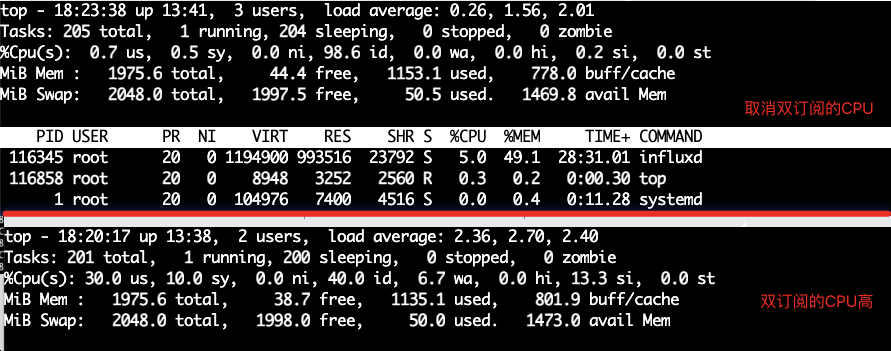
动态切换订阅
现在已经更改为采用keepalived的方式,在Prometheus写入数据之前 手动设置订阅influxdb-master实时写入influxdb-slave;并且在Keepalived脚本中设置:当master变为slave时 将删除订阅,由slave变成master的机器设置订阅。
经过测试 数据不会丢失,VIP在Prometheus01 Prometheus02中来回切换 图表也不会中断,并且数据始终一致。CPU压力很小。
数据的保留策略也已经生效:我是在11点40左右开始实验,下午1:43时 数据已经只能看到12点数据了。
查看方法:
influx -username root -password 2024.168 -database prometheus -execute 'select * from node_cpu_seconds_total;' > 1.txt && wc -l 1.txt
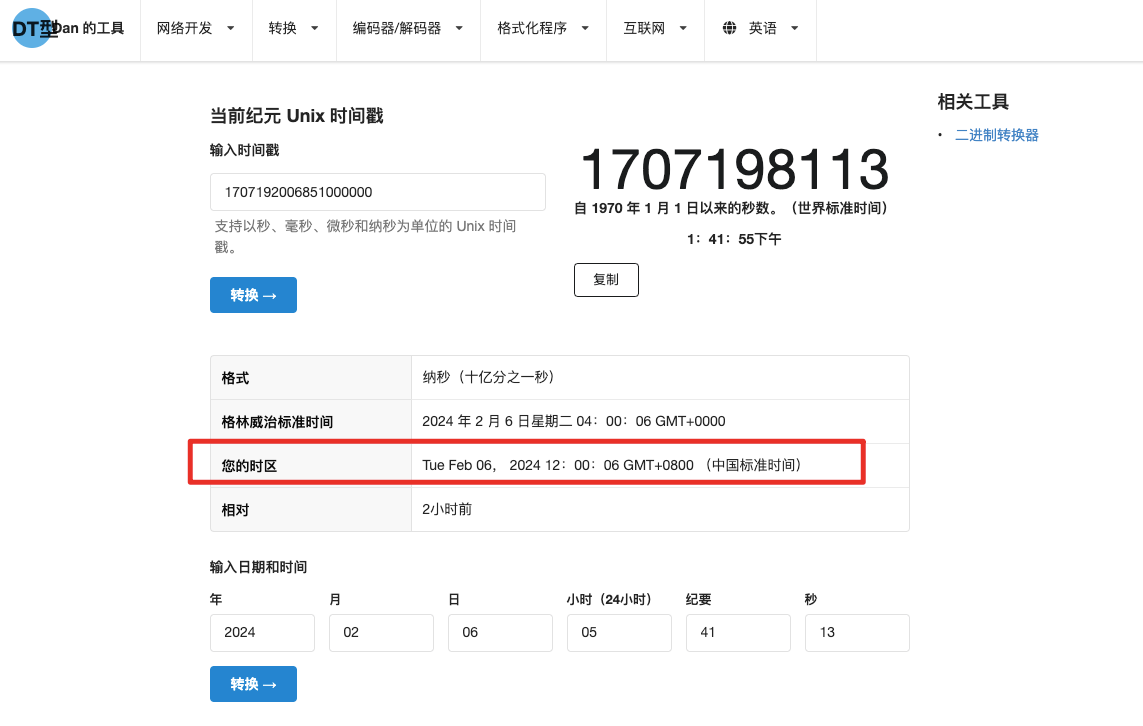
获取第一条数据的时间戳:1707192006851000000
root@influxdb-master:~# head -n 10 1.txt
name: node_cpu_seconds_total
time                __name__               cpu instance       job        mode    value
----                --------               --- --------       ---        ----    -----
1707192006851000000 node_cpu_seconds_total 0   10.0.0.13:9100 prometheus idle    5383.56
1707192006851000000 node_cpu_seconds_total 0   10.0.0.13:9100 prometheus iowait  2.43
1707192006851000000 node_cpu_seconds_total 0   10.0.0.13:9100 prometheus irq     0
1707192006851000000 node_cpu_seconds_total 0   10.0.0.13:9100 prometheus nice    33.53
1707192006851000000 node_cpu_seconds_total 0   10.0.0.13:9100 prometheus softirq 0.65
1707192006851000000 node_cpu_seconds_total 0   10.0.0.13:9100 prometheus steal   0
1707192006851000000 node_cpu_seconds_total 0   10.0.0.13:9100 prometheus system  18.14
root@influxdb-master:~#
但为什么Grafana上仍然可以看到11点40的数据 我不清楚这是什么情况,还需要对influxdb做更多的学习。
时间戳在线转换:Unix 时间戳 - Epoch 转换器 (unixtimestamp.com)
参考文档
InfluxDB 中的 Prometheus 端点支持 |InfluxDB OSS v1 文档 (influxdata.com)
Manage subscriptions in InfluxDB | InfluxDB OSS v1 Documentation (influxdata.com)
从InfluxDB OSS复制数据 |InfluxDB Cloud (TSM) 文档 (influxdata.com)
influxdb2.x 主从数据实时同步_influxdb主从-CSDN博客
Prometheus 通过 Telegraf 将数据远程写入 InfluxDB 2.x 存储(InfluxDB 2.x 不同于 1.x)_prometheus telegraf-CSDN博客
centos7 keepalived+nginx实现vip漂移高可用 - 凯文队长 - 博客园 (cnblogs.com)