任务描述
知识点:
- 使用Hive进行数据分析
重 点:
- 掌握Hive基本语句
- 熟练使用Hive对天气数据进行分析
内 容:
- 使用Hive创建外部表
- 使用Hive对数据进行统计分析
任务指导
1. 使用Hive创建基础表
- 将China_stn_city.csv文件上传到HDFS的/china_stn目录中
- 启动metastore(后台运行)
- 进入Hive命令行模式,创建Hive数据库(china_all)
- 创建Hive外部表:china_all,并加载HDFS上/china_all的数据
- 创建基站与城市对应关系表:stn_city

- 创建天气数据与各城市的对应表
- 创建2022年天气数据表:tmp_city_2022,基于tmp_city获取2022年全年的天气数据,并将数据插入到tmp_city_2022表中
2. 使用Hive分析数据(可视化数据支持)
1)统计2022年每个月各省份的平均气温及平均风速
- 创建china_map表,表字段包含:月份,省份,平均气温,平均风速
- 统计2022年每个月各省份的平均气温及平均风速,由于气温与风速数据中存在缺失值"-9999",所以统计平均气温和平均风速时只统计不等于(<>)"-9999"的数据
2)统计2022年每个月平均降水量TOP10的城市
- 创建city_precipitation_top10表,表字段包含:月份,城市,平均降水量(6小时)
- 统计2022年每个月平均降水量TOP10的城市。本次查询通过两次子查询进行统计,通过第一次子查询获取2022年每个月各个城市的平均降水量(原数据中关于降水量的有两个字段“precipitation_1 string”和“precipitation_6 string”,分别为1小时内的降水量与6小时内的降水量,此时我们统计各城市平均6小时内的降水量),基于第一次子查询所得的结果,使用row_number()函数对各城市的平均降水量进行排名,进行第二次子查询,通过两次子查询分别获取到平均降水量以及排名,最后使用最外层查询根据排名取得前十的城市
3)统计2022年每个月各个城市的平均气温
- 创建city_temp表,表字段包含:月份,城市,平均气温
- 统计2022年每个月各个城市的平均气温

4)统计2022年每个月各个省份的平均气温
- 创建province_temp表,表字段包含:省份,月份,平均气温,(预留) 预测气温
- 统计2022年每个月各个省份的平均气温。表中的forecast字段作为预留的气温预测字段,用于写入后面的气温预测数据,当前该字段填入"0"
5)统计2022年每个月各省份的平均气压
- 创建province_pressure表,表字段包含:月份,省份,平均气压
- 统计2022年每个月各省份的平均气压

3. 使用Hive分析数据(气温预测数据支持)
在后续任务中会使用时间序列模型分别山东省以及全国各省份的气温进行预测,所以需要使用2000-2022年各个省份每个月的平均气温作为训练数据
- 创建2000-2022年各省份平均气温表province_temp_all,表字段包含:年份,省份,月份,平均气温
- 统计2000-2022年各省份每月的平均气温
任务实现
1. 使用Hive创建基础表
- 进入/home/data目录,将China_stn_city.csv文件上传到HDFS中,该文件中存储了各基站与省份、城市的对应关系
数据说明:
| 基站编号 | 省份 | 城市 | 纬度 | 经度 |
| 58015 | 安徽 | 砀山 | 34.27 | 116.2 |
- 在HDFS创建/china_stn目录,并将/home/data/China_stn_city.csv文件上传到/china_stn目录中
# hadoop fs -mkdir /china_stn
# hadoop fs -put /home/data/China_stn_city.csv /china_stn- 启动metastore(后台运行)
# hive --service metastore &- 输入【hive】命令进入Hive命令行模式,创建Hive数据库
hive> create database china_all;
hive> use china_all;- 创建Hive外部表:china_all,并加载HDFS上/china_all的数据
hive> create external table china_all.china_all(
stn string,
year string,
month string,
day string,
hour string,
temp string,
dew_point_temp string,
pressure string,
wind_direction string,
wind_speed string,
clouds string,
precipitation_1 string,
precipitation_6 string
)
row format delimited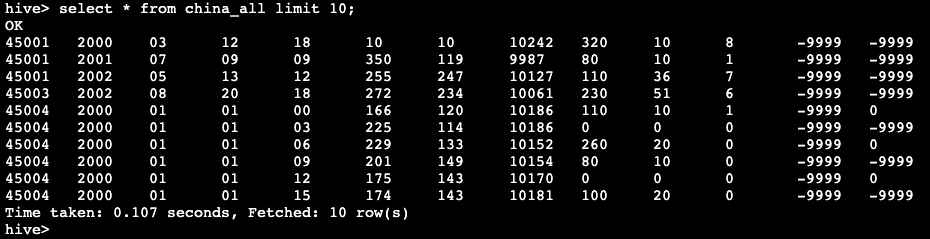
fields terminated by ',' stored as textfile location '/china_all';- 检验china_all表是否存在数据
hive> select * from china_all limit 10;
- 创建基站与城市对应关系表:stn_city
hive> create external table china_all.stn_city(
stn string,
province string,
city string,
latitude string,
longitude string
)
row format delimited
fields terminated by ',' stored as textfile location '/china_stn';- 检验stn_city是否存在数据
hive> select * from stn_city limit 10;
- 创建天气数据与各城市的对应表
hive> create table china_all.tmp_city(
stn string,
year string,
month string,
day string,
hour string,
temp string,
dew_point_temp string,
pressure string,
wind_direction string,
wind_speed string,
clouds string,
precipitation_1 string,
precipitation_6 string,
province string,
city string
)
row format delimited
fields terminated by ',' stored as textfile;- 通过stn字段将china_all表与stn_city表进行表连接,使得每条天气数据找到对应的省份和城市信息,并将其全部插入到tmp_city表中,由于在原数据中有部分基站无法与省份进行匹配,从而产生null值,所以需要使用where判断去除null值
hive> insert overwrite table tmp_city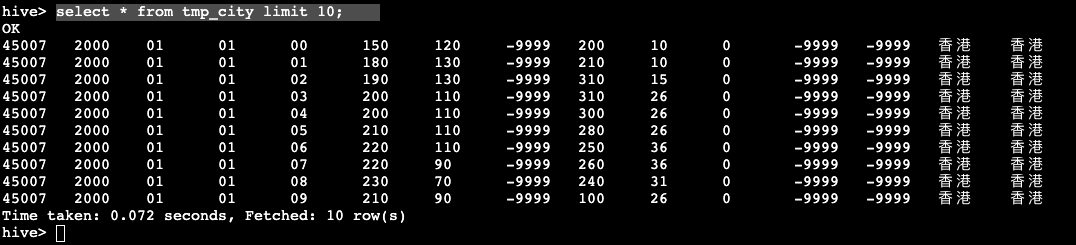
select c2.*,sc.province,sc.city from china_all as c2 left join stn_city as sc on c2.stn = sc.stn where sc.province is not null and sc.city is not null;- 检验tmp_city表是否存在数据
hive> select * from tmp_city limit 10;
- 创建2022年天气数据表:tmp_city_2022,基于tmp_city获取2022年全年的天气数据,并将数据插入到tmp_city_2022表中
hive> create table china_all.tmp_city_2022 as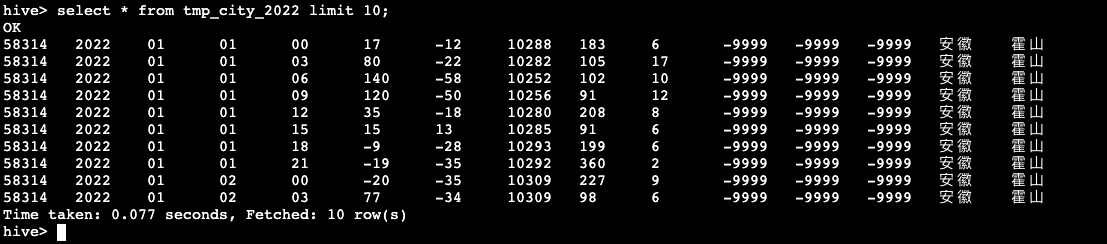
select * from tmp_city where year = 2022;- 检验tmp_city_2022表是否存在数据
hive> select * from tmp_city_2022 limit 10;
2. 使用Hive分析数据(可视化数据支持)
1)统计2022年每个月各省份的平均气温及平均风速
- 创建china_map表,表字段包含:月份,省份,平均气温,平均风速
hive> create table china_map(
month string,
province string,
temp string,
wind_speed string
)
row format delimited
fields terminated by ',' stored as textfile;- 统计2022年每个月各省份的平均气温及平均风速,由于气温与风速数据中存在缺失值"-9999",所以统计平均气温和平均风速时只统计不等于(<>)"-9999"的数据
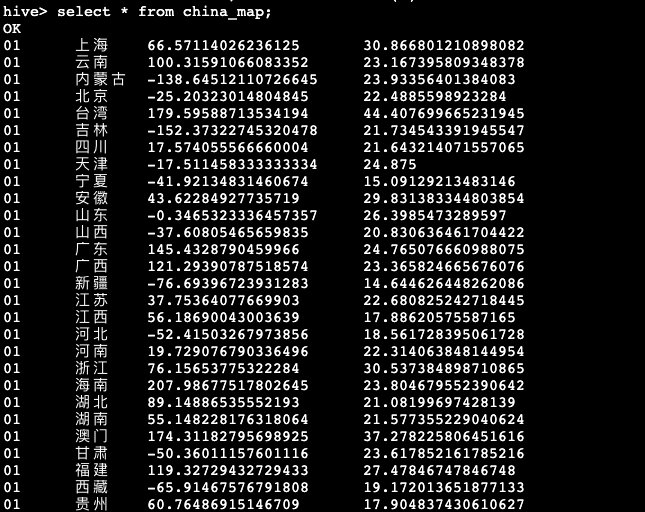
hive> insert overwrite table china_map select month,province,avg(temp),avg(wind_speed) from tmp_city_2022 where temp <> '-9999' and wind_speed <> '-9999' group by month,province;- 查看china_map表(共408条数据)
hive> select * from china_map;
2)统计2022年每个月平均降水量TOP10的城市
- 创建city_precipitation_top10表,表字段包含:月份,城市,平均降水量(6小时)
hive> create table city_precipitation_top10(
month string,
city string,
precipitation_6 string
)
row format delimited
fields terminated by ',' stored as textfile;- 统计2022年每个月平均降水量TOP10的城市。本次查询通过两次子查询进行统计,通过第一次子查询获取2022年每个月各个城市的平均降水量(原数据中关于降水量的有两个字段“precipitation_1 string”和“precipitation_6 string”,分别为1小时内的降水量与6小时内的降水量,此时我们统计各城市平均6小时内的降水量),基于第一次子查询所得的结果,使用row_number()函数对各城市的平均降水量进行排名,进行第二次子查询,通过两次子查询分别获取到平均降水量以及排名,最后使用最外层查询根据排名取得前十的城市
hive> insert overwrite table city_precipitation_top10
select t2.month,t2.city,t2.pre6 from
(select *,row_number() over(partition by t1.month order by t1.pre6 desc) as number from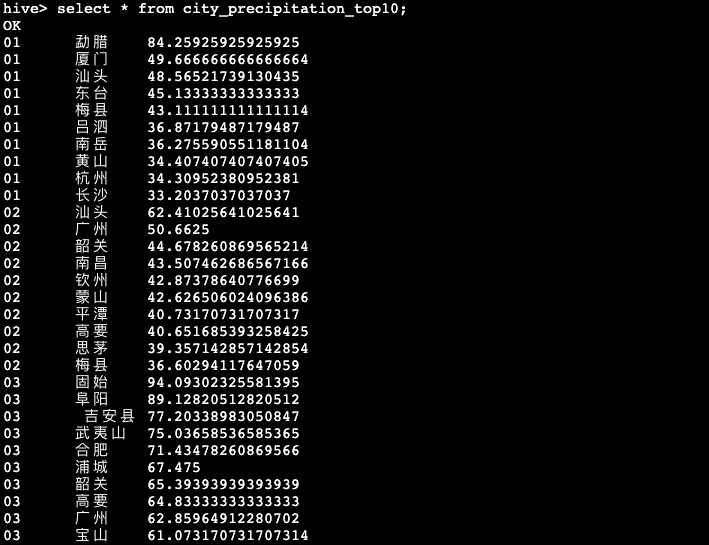
(select month,city,avg(precipitation_6) as pre6 from tmp_city_2022 where precipitation_6<>-9999 and precipitation_6>=0 group by month,city order by month,pre6 desc) as t1)as t2 where t2.number<=10;- 查看city_precipitation_top10表(共120条数据)
hive> select * from city_precipitation_top10;
3)统计2022年每个月各个城市的平均气温
- 创建city_temp表,表字段包含:月份,城市,平均气温
hive> create table city_temp(
month string,
city string,
temp string
)
row format delimited
fields terminated by ',' stored as textfile;- 统计2022年每个月各个城市的平均气温
hive> insert overwrite table city_temp
select month,city,avg(temp) as tmp from tmp_city_2022 where temp<>-9999 group by month,city;- 查看city_temp表(共3969条数据)
hive> select * from city_temp limit 30;
4)统计2022年每个月各个省份的平均气温
- 创建province_temp表,表字段包含:省份,月份,平均气温,(预留) 预测气温
hive> create table province_temp(
province string,
month string,
temp string,
forecast string
)
row format delimited
fields terminated by ',' stored as textfile;- 统计2022年每个月各个省份的平均气温。表中的forecast字段作为预留的气温预测字段,用于写入后面的气温预测数据,当前该字段填入"0"
hive> insert overwrite table province_temp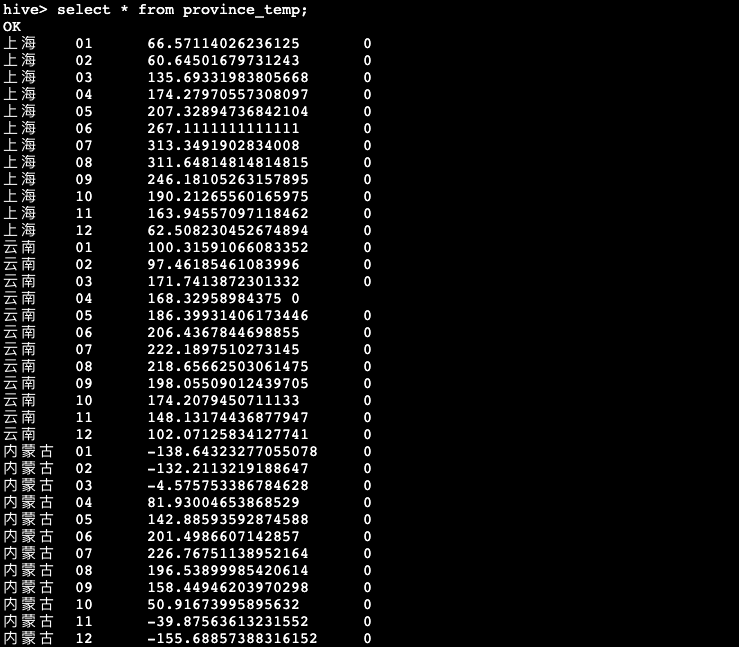
select province,month,avg(temp),'0' from tmp_city_2022 where temp<>-9999 group by province,month order by province,month;- 查看province_temp表(共408条数据)
hive> select * from province_temp;
5)统计2022年每个月各省份的平均气压
- 创建province_pressure表,表字段包含:月份,省份,平均气压
hive> create table province_pressure(
month string,
province string,
pressure string
)
row format delimited
fields terminated by ',' stored as textfile;- 统计2022年每个月各省份的平均气压
hive> insert overwrite table province_pressure
select month,province,avg(pressure) as pressure from tmp_city_2022 where pressure<>-9999 group by month,province;- 查看province_pressure表(共398条数据)
hive> select * from province_pressure;
3. 使用Hive分析数据(气温预测数据支持)
在后续任务中会使用时间序列模型分别山东省以及全国各省份的气温进行预测,所以需要使用2000-2022年各个省份每个月的平均气温作为训练数据
- 创建2000-2022年各省份平均气温表province_temp_all,表字段包含:年份,省份,月份,平均气温
hive> create table province_temp_all(
year string,
province string,
month string,
temp string
)
row format delimited
fields terminated by ',' stored as textfile;- 统计2000-2022年各省份每月的平均气温
hive> insert overwrite table province_temp_all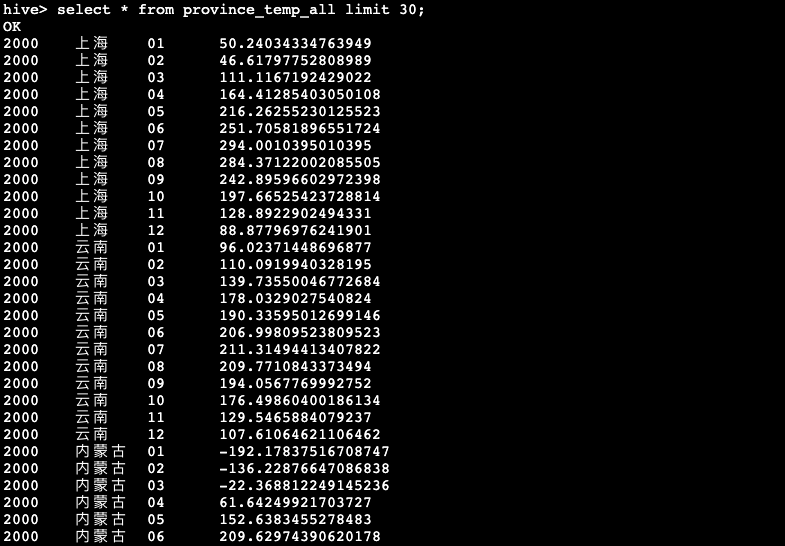
select year,province,month,avg(temp) from tmp_city where temp<>-9999 group by year,province,month order by year,province,month;- 查看province_temp_all表(共9385条数据)
hive> select * from province_temp_all limit 30;