【openGauss服务器端工具的使用】
-
gs_checkperf
openGauss 不仅提供了gs_checkperf工具来帮助用户了解openGauss的负载情况。
- 使用数据库安装用户登录服务器,执行如下命令进行查看数据库性能:
简要信息展示:
详细信息展示[omm@opengauss03 ~]$ gs_checkperf -i PMK Cluster statistics information: Host CPU busy time ratio : 1.70 % MPPDB CPU time % in busy time : 91.66 % Shared Buffer Hit ratio : 99.80 % In-memory sort ratio : 0 Physical Reads : 431 Physical Writes : 455 DB size : 34 MB Total Physical writes : 455 Active SQL count : 4 Session count : 6[omm@opengauss03 ~]$ gs_checkperf -i PMK --detail Cluster statistics information: Host CPU usage rate: Host total CPU time : 33179390.000 Jiffies Host CPU busy time : 568840.000 Jiffies Host CPU iowait time : 18830.000 Jiffies Host CPU busy time ratio : 1.71 % Host CPU iowait time ratio : .06 % MPPDB CPU usage rate: MPPDB CPU time % in busy time : 89.78 % MPPDB CPU time % in total time : 1.54 % Shared buffer hit rate: Shared Buffer Reads : 451 Shared Buffer Hits : 178772 Shared Buffer Hit ratio : 99.75 % In memory sort rate: In-memory sort count : 0 In-disk sort count : 0 In-memory sort ratio : 0 I/O usage: Number of files : 97 Physical Reads : 421 Physical Writes : 320 Read Time : 6167 ms Write Time : 3547 ms Disk usage: DB size : 34 MB Total Physical writes : 320 Average Physical write : 90217.08 Maximum Physical write : 320 Activity statistics: Active SQL count : 4 Session count : 6 Node statistics information: dn_6001: MPPDB CPU Time : 510710 Jiffies Host CPU Busy Time : 568840 Jiffies Host CPU Total Time : 33179390 Jiffies MPPDB CPU Time % in Busy Time : 89.78 % MPPDB CPU Time % in Total Time : 1.54 % Physical memory : 2606247936 Bytes DB Memory usage : 4896587776 Bytes Shared buffer size : 268435456 Bytes Shared buffer hit ratio : 99.75 % Sorts in memory : 0 Sorts in disk : 0 In-memory sort ratio : 0 Number of files : 97 Physical Reads : 421 Physical Writes : 320 Read Time : 6167 Write Time : 3547 Session statistics information(Top 10): Session CPU statistics: 1 dn_6001-postgres-omm: Session CPU time : 3 Database CPU time : 510760 Session CPU time % : 0.00 % 2 dn_6001-postgres-omm: Session CPU time : 0 Database CPU time : 510760 Session CPU time % : 0.00 % 3 dn_6001-postgres-omm: Session CPU time : 0 Database CPU time : 510760 Session CPU time % : 0.00 % 4 dn_6001-postgres-omm: Session CPU time : 0 Database CPU time : 510760 Session CPU time % : 0.00 % Session Memory statistics: 1 dn_6001-postgres-omm: Buffer Reads : 1607 Shared Buffer Hit ratio : 93.05 In Memory sorts : 0 In Disk sorts : 0 In Memory sorts ratio : 0 Total Memory Size : 6566592 Used Memory Size : 5338376 2 dn_6001-postgres-omm: Buffer Reads : 283 Shared Buffer Hit ratio : 100.00 In Memory sorts : 0 In Disk sorts : 0 In Memory sorts ratio : 0 Total Memory Size : 6542016 Used Memory Size : 5281600 3 dn_6001-postgres-omm: Buffer Reads : 39 Shared Buffer Hit ratio : 100.00 In Memory sorts : 0 In Disk sorts : 0 In Memory sorts ratio : 0 Total Memory Size : 5518016 Used Memory Size : 5055232 4 dn_6001-postgres-omm: Buffer Reads : 1023 Shared Buffer Hit ratio : 100.00 In Memory sorts : 1 In Disk sorts : 0 In Memory sorts ratio : 100.00 Total Memory Size : 11617840 Used Memory Size : 9327632 Session IO statistics: 1 dn_6001-postgres-omm: Physical Reads : 120 Read Time : 2383 2 dn_6001-postgres-omm: Physical Reads : 0 Read Time : 0 3 dn_6001-postgres-omm: Physical Reads : 0 Read Time : 0 4 dn_6001-postgres-omm: Physical Reads : 0 Read Time : 0
- 使用数据库安装用户登录服务器,执行如下命令进行查看数据库性能:
-
gs_collector
数据库运行时,某些操作在执行过程中可能会出现错误,数据库依然能够运行。但是此时数据库中的数据可能已经发生不一致的情况。建议检查openGauss运行日志,及时发现隐患。
当openGauss发生故障时,使用 gs_collector 此工具收集OS信息、日志信息以及配置文件等信息,来定位问题。-
设置收集配置文件,新建collector.json文件,添加如下内容:
{ "Collect": [ { "Content": "RunTimeInfo,HardWareInfo", "Count": "1", "Interval": "0", "TypeName": "System" }, { "Content": "Coordinator,DataNode,Gtm,ClusterManager", "Count": "1", "Interval": "0", "TypeName": "Log" }, { "Content": "pg_locks,pg_stat_activity,pg_thread_wait_status", "Count": "1", "Interval": "0", "TypeName": "Database" }, { "Content": "Coordinator,DataNode,Gtm", "Count": "1", "Interval": "0", "TypeName": "Config" } ] } -
执行如下命令进行信息收集:
gs_collector --begin-time="20240103 07:00" --end-time="20240103 22:30" -C /home/omm/collector.json结果如下:
Successfully parsed the configuration file.
create Dir.
Successfully create dir.
do system check interval 0 : count 1
Collecting OS information.
The cmd is source /home/omm/.bashrc; python3 ‘/opt/install/om/script/local/LocalCollect.py’ -t system_check -U omm -l /opt/install/log/omm/omm/om/gs_local.log -C ‘{#Content#: #ps,ioStat,netFlow,spaceUsage,cpuInfo,memInfo,disk,#, #Count#: #1#, #Interval#: #0#, #TypeName#: #System#}’
Failed to collect OS information.
do database check interval 0 : count 1
Collecting catalog statistics.
Successfully collected catalog statistics.
do log check interval 0 : count 1
Collecting Log files.
Successfully collected Log files.
do Config check 0:1
Collecting Config files.
Successfully collected Config files.
Collecting files.
Successfully collected files.
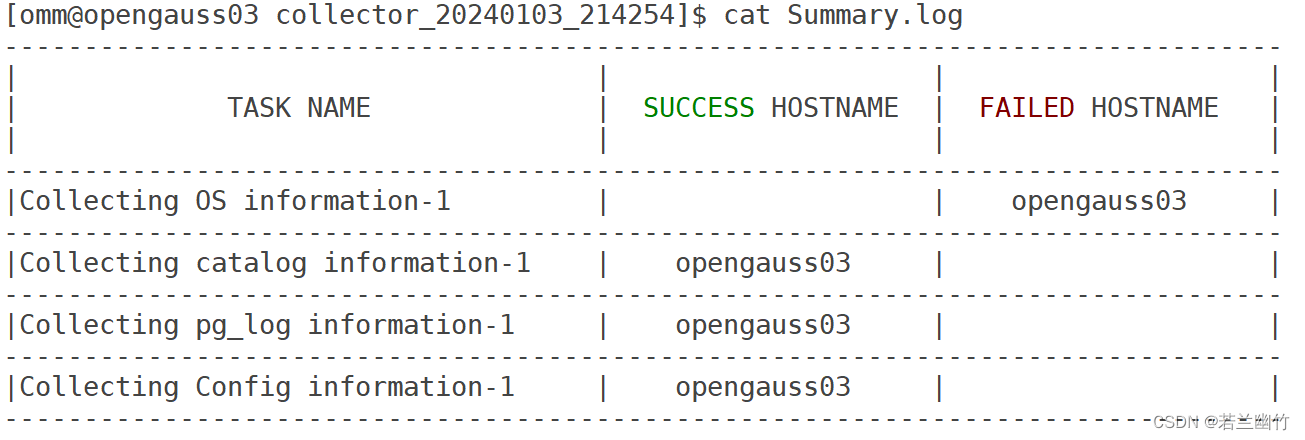
All results are stored in /opt/install/tmp/collector_20240103_214254.tar.gz.详细可查看结果文件,比如:
[omm@opengauss03 ~]$ tar -zvxf /opt/install/tmp/collector_20240103_214254.tar.gz -C ./
collector_20240103_214254/
collector_20240103_214254/Detail.log
collector_20240103_214254/opengauss03.tar.gz
collector_20240103_214254/Summary.log
[omm@opengauss03 ~]$ ll
total 8.0K
drwx------. 2 omm dbgrp 4.0K Jan 3 21:43 collector_20240103_214254
-rw-------. 1 omm dbgrp 703 Jan 3 21:41 collector.json
[omm@opengauss03 ~]$ cd collector_20240103_214254/
[omm@opengauss03 collector_20240103_214254]$ ll
total 84K
-rw-------. 1 omm dbgrp 2.3K Jan 3 21:43 Detail.log
-rw-------. 1 omm dbgrp 76K Jan 3 21:43 opengauss03.tar.gz
-rw-------. 1 omm dbgrp 1.1K Jan 3 21:43 Summary.log
[omm@opengauss03 collector_20240103_214254]$ cat Summary.log
-
-
gs_check
gs_check改进增强,统一化当前系统中存在的各种检查工具,例如gs_check、gs_checkos等,帮助用户在openGauss运行过程中,全量的检查openGauss运行环境、操作系统环境、网络环境及数据库执行环境,也有助于在openGauss重大操作之前对各类环境进行全面检查,有效保证操作执行成功。具体可参考官网:gs_check
- 示例如下:检查CPU\MTP\PING
结果如下:gs_check -i CheckCPU,CheckMTU,CheckPing
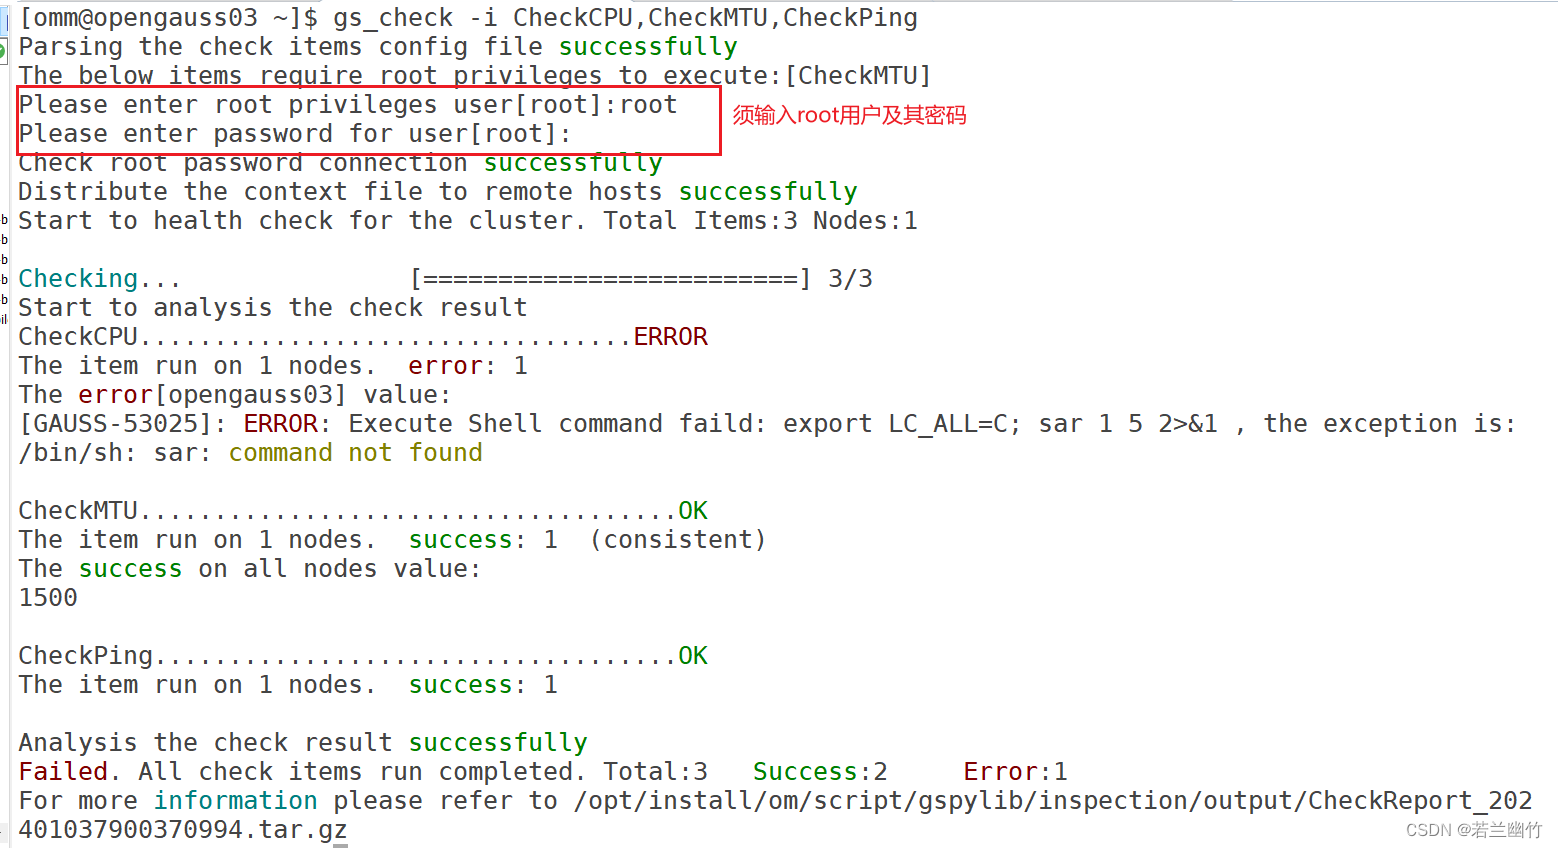
- 示例如下:检查CPU\MTP\PING


![[ Tool ] celery分布式任务框架基本使用](https://img-blog.csdnimg.cn/direct/6dc4eed4bd4c4a76890d2a794654e20c.png)