全球人工不透水面积(lobal artificial impervious area, GAIA)
人工不透水区是表征建成区和城市范围的重要覆盖类型,特别是在较细的空间分辨率下。
1 简介
原理: 由Landsat卫星图像和辅助数据集生成,如夜间灯光数据(nighttime light data)和Sentinel-1合成孔径雷达数据(Sentinel-1 Synthetic Aperture Radar data)
空间分辨率: 30m
数据时段: 1985-2018年共34年数据 年尺度
1.1 原理
介绍论文: J2020-Annual maps of global artificial impervious area (GAIA) between 1985 and 2018
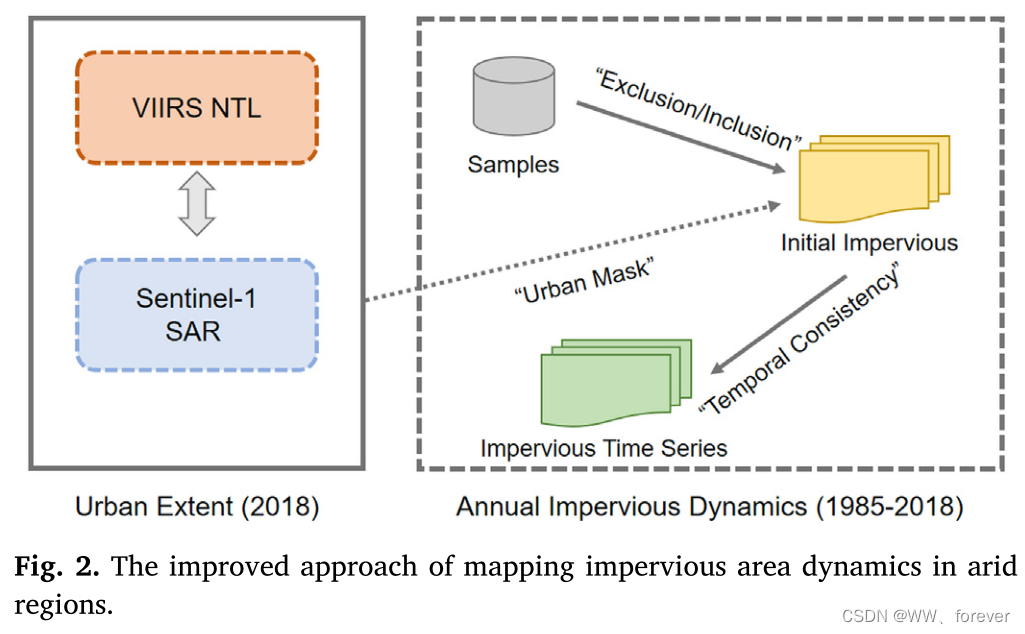
在干旱半干旱区,由于人工不透水区与周围裸地之间的光谱信息高度混淆,制图性能相对较差。因此,根据全球生物群落图将全球划分为干旱区和非干旱区。对于干旱区,使用了与之前研究相同的方法(Gong et al, 2019a);对于非干旱区,通过加入额外的约束条件来缓解不透水区域和裸地之间光谱混淆造成的高估。

1.1.1 非干旱区制图(Mapping in non-arid regions)
数据来源:
- Landsat Thematic Mapper ™
- Enhanced Thematic Mapper Plus (ETM+)
- Landsat 8 Operational Land Imager (OLI)
方法:
- “Exclusion-Inclusion” algorithm (Li and Gong, 2016a):得到初始人工不透水面
- the “temporal consistency check” approach (Li et al., 2015):得到最终人工不透水面

1.1.2 干旱区制图(Mapping in arid regions)
1.2 下载
网址:数据下载+网页数据说明
数据说明界面如下:

数据下载界面如下:

所有tif图像下载如下(共8014个项目)。

- 名称模式:GAIA_1985_2018_Latitude_Longitude.tif,其中纬度和经度是左上最近的整数。
- 图中取值范围为0 ~ 34,代表不同年份。
- 0表示不透水,大于0的值表示不透水像素。
年份和像素值对如下:
| 年份 Year | 像素值 pixel value |
|---|---|
| 1985 | 34 |
| … | … |
| 2018 | 1 |
1.3 MATLAB批量处理及计算
首先尝试用MATLAB处理。
1.4
参考
- J2021-More Persistent Summer Compound Hot Extremes Caused by Global Urbanization-Geophysical Research Letters-马凤(南京信息工程大学)
- J2022-A comparison study on the role of urbanization in altering the short-duration and long-duration intense rainfall-Science of The Total Environment-常琛朝、黄津辉(南开大学)

EULUC-China
介绍论文:J2020-Mapping essential urban land use categories in China (EULUC-China): preliminary results for 2018
![健康码识别[QT+OpenCV]](https://img-blog.csdnimg.cn/b1643a77eb38432abc2e9b5b86d46048.gif)


![[ Azure - Database ] Azure Database for MySQL 配置Auditing并查看使用](https://img-blog.csdnimg.cn/9e84f146faef43e8bc933508270ecc08.png)
