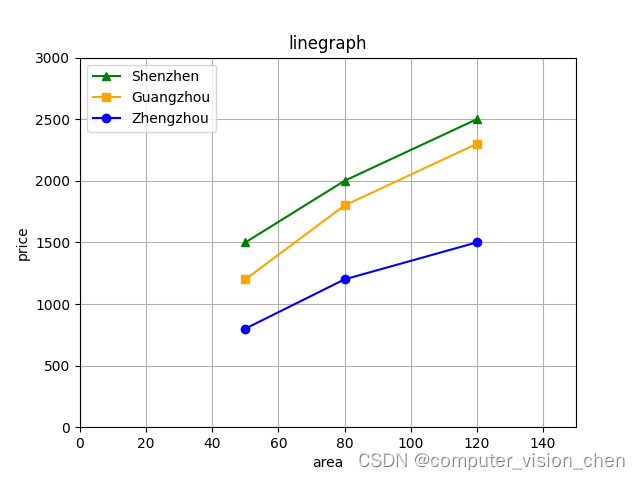
用python写一段代码,该代码的功能是:画一个折线图,该折线图x轴的标题是面积,y轴的标题是房价。该图上有三条折线,分别代表深圳,广州,郑州。这三条折线的颜色分别为红,黄,蓝。x轴的范围是0 - 150 ,y轴的范围是0 - 300 万。
import matplotlib. pyplot as plt
def draw_three_linegraph ( x, y1, y2, y3, x_begin, x_end, y_begin, y_end) :
plt. plot( x, y1, label= 'Shenzhen' , color= 'green' , marker= '^' )
plt. plot( x, y2, label= 'Guangzhou' , color= 'orange' , marker= 's' )
plt. plot( x, y3, label= 'Zhengzhou' , color= 'blue' , marker= 'o' )
plt. title( 'linegraph' )
plt. xlabel( 'area' )
plt. ylabel( 'price' )
plt. legend( )
plt. xlim( x_begin, x_end)
plt. ylim( y_begin, y_end)
plt. grid( True )
plt. savefig( 'house_prices_plot.png' )
plt. show( )
if __name__== '__main__' :
x = [ 50 , 80 , 120 ]
shenzhen_prices = [ 1500 , 2000 , 2500 ]
guangzhou_prices = [ 1200 , 1800 , 2300 ]
zhengzhou_prices = [ 800 , 1200 , 1500 ]
x_begin, x_end = 0 , 150
y_begin, y_end = 0 , 3000
draw_three_linegraph( x, shenzhen_prices, guangzhou_prices, zhengzhou_prices, x_begin, x_end, y_begin, y_end)
在 `matplotlib` 中,`plot` 函数中的 `marker` 参数用于指定数据点的标记样式。以下是一些常用的标记样式:
- `'.' `:点标记
- `'o' `:圆圈标记
- `'v' `:倒三角标记
- `'^' `:正三角标记
- `'s' `:正方形标记
- `'p' `:五边形标记
- `'*' `:星形标记
- `'+' `:加号标记
- `'x' `:叉号标记
你可以根据需要选择适当的标记样式。在你提到的代码中,`marker= 'o' ` 表示使用圆圈标记。如果你想使用其他样式,只需将 `'o' ` 替换为所需的标记样式即可。
