树是计算机科学中重要的数据结构。例如决策树等机器学习算法设计、文件系统索引等。创建treelib包是为了在Python中提供树数据结构的有效实现。
Treelib的主要特点包括:
- 节点搜索的高效操作。
- 支持常见的树操作,如遍历、插入、删除、节点移动、浅/深复制、子树切割等。
- 支持用户定义的数据负载以加速您的模型构建。
- 漂亮的树显示和文本/json 转储,用于漂亮的显示和离线分析。
- 与 Python 2 和 3 兼容
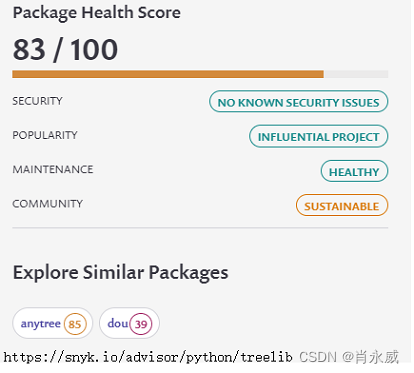
Snyk.io是一家专注于帮助企业解决开源软件安全问题的公司,给出评价是83分。
1. treelib安装
pip install -i https://pypi.tuna.tsinghua.edu.cn/simple treelib
github地址:https://github.com/caesar0301/treelib
2. 树结构应用需求
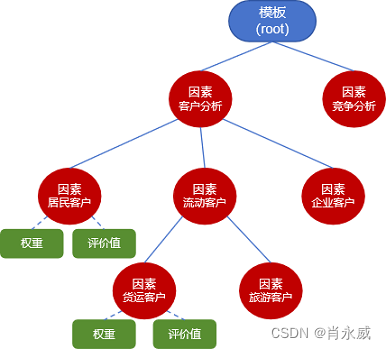
如图所示一个分层次计算因素得分,例如“流动客户”得分是由其子节点因素“货运客户”与“旅游客户”合计得到,计算公式为:货运客户的权重×货运客户的评价值+旅游客户的权重×旅游客户的评价值。
通用计算公式如下:
y
=
∑
i
=
0
n
w
i
x
i
y=\sum_{i=0}^{n}{w_i x_i}
y=∑i=0nwixi
其中,
w
i
w_i
wi为任意因素节点的权重,
x
i
x_i
xi为任意因素节点的评价得分值,
y
y
y是这些节点的父节点。
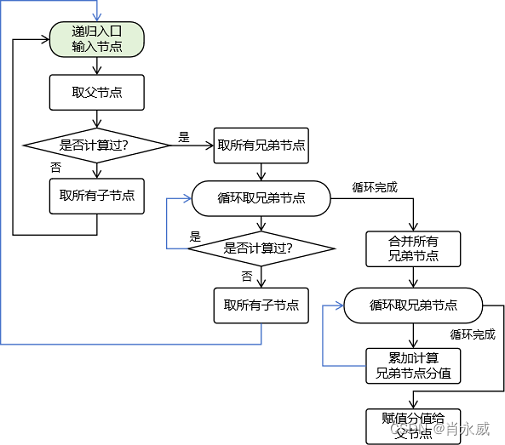
遍历整个树,计算最后的得分,采用递归方案,程序框图如下:
3. 入门使用
3.1. 创建一棵树
treelib 树由Tree和Node两个类完成,其中Node是树中的节点,主要由如下内容:
- identifier:唯一标识
- tag:标签
- data:数据
其他自行看源代码,包括父、子节点关系等内容。
在实际应用中,本文对“data”扩展,使用元组来定义更多的数据(0,1),0是评价得分值,1是权重。
from treelib import Node, Tree
tree = Tree()
tree.create_node("Harry", "harry",data=(None,None))  # root node
tree.create_node("Jane", "jane", parent="harry",data=(None,0.6))
tree.create_node("Bill", "bill", parent="harry",data=(None,0.4))
tree.create_node("Diane", "diane", parent="jane",data=(None,0.3))
tree.create_node("Mary", "mary", parent="jane",data=(None,0.35))
tree.create_node("Mark", "mark", parent="jane",data=(None,0.25))
tree.create_node("Green", "green", parent="bill",data=(None,0.3))
tree.create_node("White", "white", parent="bill",data=(None,0.7))
3.2. 树的简单操作
获取所有的叶子节点。
leaves = tree.leaves()
leaves
	[Node(tag=Diane, identifier=diane, data=(None, 0.3)),
	 Node(tag=Mary, identifier=mary, data=(None, 0.35)),
	 Node(tag=Mark, identifier=mark, data=(None, 0.25)),
	 Node(tag=Green, identifier=green, data=(None, 0.3)),
	 Node(tag=White, identifier=white, data=(None, 0.7))]
给叶子节点赋值,易便后续进行计算。
factors_data={'Green':20,'Mark':30,'Mary':100,'Diane':50,'White':40}
for node in leaves:
    node.data=(factors_data[node.tag],node.data[1])
leaves
	[Node(tag=Diane, identifier=diane, data=(50, 0.3)),
	 Node(tag=Mary, identifier=mary, data=(100, 0.35)),
	 Node(tag=Mark, identifier=mark, data=(30, 0.25)),
	 Node(tag=Green, identifier=green, data=(20, 0.3)),
	 Node(tag=White, identifier=white, data=(40, 0.7))]
获取兄弟节点。
# Return the siblings of given @nid. 获取兄弟节点
tree.siblings('diane')
	[Node(tag=Mary, identifier=mary, data=(100, 0.35)),
	 Node(tag=Mark, identifier=mark, data=(30, 0.25))]
获取父节点。
#Get parent :class:`Node` object of given id.
tree.parent('diane')
Node(tag=Jane, identifier=jane, data=(None, 0.6))
4. 实际应用
按权重和评价的分值,计算整颗树的各个因素的得分值。
# 计算综合评价
# 输入任意个节点(因素),endnid是约定结束节点
def calscore(tree, firstnode, endnid):
    nid = firstnode.identifier

    # 处理根节点
    if (tree.parent(nid) == None or firstnode.identifier == endnid ) and firstnode.data[0]!=None:
        #print('root end')
        return firstnode
    elif tree.parent(nid) ==None:
        parentnode = firstnode
    else:
        parentnode = tree.parent(nid)

    if firstnode.data[0]==None:
        # 没有计算,直接取子节点
        childnodes = tree.children(nid)
        # 计算分值
        calscore(tree, childnodes[0], endnid)
    else:
        # 已经计算,找兄弟节点(必须有兄弟,否则,合并节点)
        siblings = tree.siblings(nid)
        for node in siblings:
            if node.data[0]==None:
                # 没有计算,直接取子节点
                childnodes = tree.children(node.identifier)
                # 计算分值
                calscore(tree, childnodes[0], endnid)

        # 兄弟节点都已经计算(有数据的情况),计算父节点得分
        siblings.append(firstnode)
        score = 0
        for node in siblings:
            score = score + node.data[0]*node.data[1]
        parentnode.data=(score,parentnode.data[1])

        print(parentnode.tag ,parentnode.data)

        calscore(tree, parentnode, endnid)

nid ='white' # 'harry'
#nid = 'jane'

firstnode = tree.get_node(nid)

calscore(tree, firstnode, 'harry')
# 遍历树
print(','.join([tree[node].tag + str(tree[node].data) for node in tree.expand_tree(mode=Tree.DEPTH)]))
Harry(48.1, None),Bill(34.0, 0.4),Green(20, 0.3),White(40, 0.7),Jane(57.5, 0.6),Diane(50, 0.3),Mark(30, 0.25),Mary(100, 0.35)
5. 锦上添花画棵树
绘图使用graphviz,Graphviz 输入是一个用 dot 语言编写的绘图脚本,通过对输入脚本的解析,分析出其中的点、边及子图,然后根据属性进行绘制。
关于graphviz的使用,参见:Python安装使用graphviz经验,Format: “png“ not recognized。
# Generate DOT code file
tree.to_graphviz("hello.dot")

# Can run the following command directly from the terminal as well.
import subprocess
subprocess.call(["dot", "-Tpng", "hello.dot", "-o", "graph1.png"])
关于subprocess:
运行python的时候,我们都是在创建并运行一个进程。像Linux进程那样,一个进程可以fork一个子进程,并让这个子进程exec另外一个程序。在Python中,我们通过标准库中的subprocess包来fork一个子进程,并运行一个外部的程序。
subprocess包中定义有数个创建子进程的函数,这些函数分别以不同的方式创建子进程,所以我们可以根据需要来从中选取一个使用。另外subprocess还提供了一些管理标准流(standard stream)和管道(pipe)的工具,从而在进程间使用文本通信。
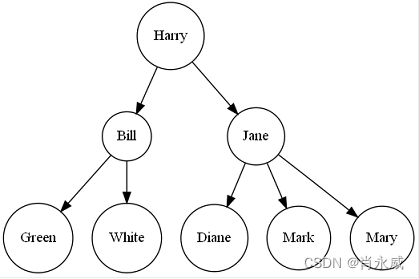
此图dot描述为:
digraph tree {
	"harry" [label="Harry", shape=circle]
	"bill" [label="Bill", shape=circle]
	"jane" [label="Jane", shape=circle]
	"green" [label="Green", shape=circle]
	"white" [label="White", shape=circle]
	"diane" [label="Diane", shape=circle]
	"mark" [label="Mark", shape=circle]
	"mary" [label="Mary", shape=circle]

	"harry" -> "jane"
	"harry" -> "bill"
	"bill" -> "green"
	"bill" -> "white"
	"jane" -> "diane"
	"jane" -> "mary"
	"jane" -> "mark"
}
6. 其他树解决方案参考
使用内置的defaultdict 我们可以很容易的定义一个树形数据结构。例如参考博文【一行python实现树形结构的方法】。
def tree(): return defaultdict(tree)

users = tree()
users['harold']['username'] = 'bell'
users['handler']['username'] = 'master'
我们可以使用print(json.dumps(users))以json的形式输出,于是我们看到:
{'harold': {'username': 'bell'}, 'handler': {'username': 'master'}}
参考:
https://treelib.readthedocs.io/en/latest/
XerCis. Python树结构库treelib. CSDN博客. 2022.04
mowangdk. 一行python实现树形结构的方法 . 脚本之家. 2019.08
肖永威. Python安装使用graphviz经验,Format: “png“ not recognized. CSDN博客. 2023.10
