二维平面扭曲的python实现及思路
- 缘起
- 原理
- 实现
- 代码
缘起
工作需要,需要一个尝试改变设备布点的方法,在csdn闲逛时,偶然间发现这样的一篇文章 二维扭曲,参考这位博主的文章,我对其内容进行复现和进一步挖掘。若有侵权或被侵权,请及时联系我。

原理
基本原理见文章 二维扭曲,核心公式就是
X
1
′
=
X
0
+
O
D
×
cos
(
θ
′
)
Y
1
′
=
Y
0
+
O
D
×
sin
(
θ
′
)
X_1'= X_0+ OD×\cos(θ')\\ Y_1'= Y_0+ OD×\sin(θ')
X1′=X0+OD×cos(θ′)Y1′=Y0+OD×sin(θ′)
其中,
O
D
=
(
X
1
−
X
0
)
2
+
(
Y
1
−
Y
0
)
2
,也即该点到中心的距离
OD=\sqrt{(X_1-X_0)^2 +(Y_1-Y_0)^2},也即该点到中心的距离
OD=(X1−X0)2+(Y1−Y0)2,也即该点到中心的距离
而
θ
′
=
f
(
θ
,
O
D
)
,
也即是与原来的角度、距离有关的一个函数
\theta' = f(\theta, OD) ,也即是与原来的角度、距离有关的一个函数
θ′=f(θ,OD),也即是与原来的角度、距离有关的一个函数
可以看到最令人迷惑的地方在于 f 究竟要怎么取?
这就是一个很有意思的地方了,像上面那幅图,可以观察到 点越远离旋转中心,它的扭曲程度就越大。这句话可以理解为 点越远离旋转中心,
θ
′
\theta'
θ′ 与
θ
\theta
θ 的相异程度越大,远离可简单由OD作为评判标准,因此,我们可以构造一个随着 OD变大,、
θ
′
\theta'
θ′变化越大的这样一个f
θ
′
=
f
(
θ
,
O
D
)
=
θ
+
k
∗
O
D
,
(
k
>
0
)
\theta' = f(\theta, OD) =\theta + k * OD,~~~~(k > 0)
θ′=f(θ,OD)=θ+k∗OD, (k>0)
实现
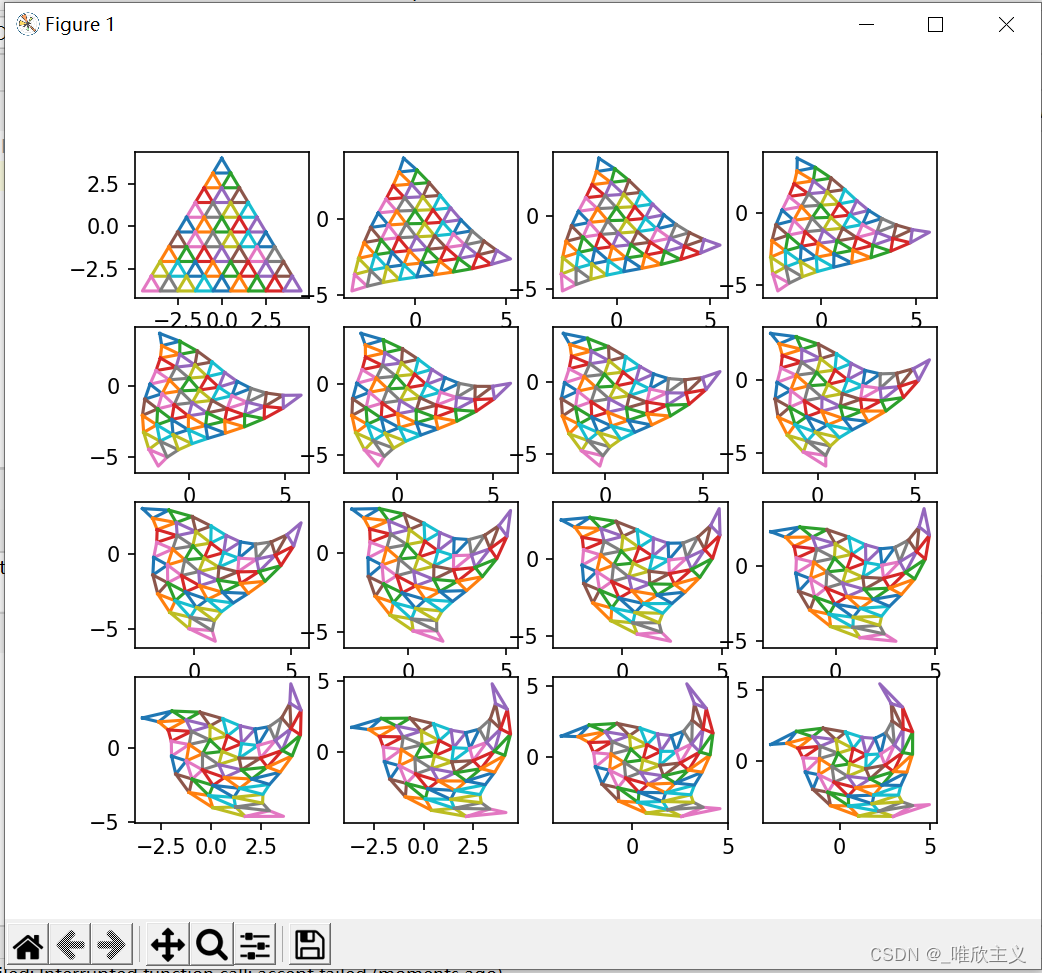
我们使用的工具是 matplotlib 下 pyplot,先把原来的大三角形画出来
再通过for循环观察到:随着k增大,扭曲程度越来越大
代码
from matplotlib import pyplot as plt
from copy import deepcopy
import math

def triangle_struct(layer=8, length=1):
    fig = plt.figure()
    x = list()
    y = list()
    height = length * (3 ** 0.5) / 2
    top_height = height * (layer + 1) // 2

    x.append([0])
    y.append(top_height)
    for i in range(1, layer):
        tmp = list()
        for j in x[-1]:
            tmp.append(j - length / 2)
        tmp.append(x[-1][-1] + length / 2)
        x.append(tmp)
        top_height -= height
        y.append(top_height)
    # print(x_axis)
    # print(y_axis)
    return [x, y]


def plot(x, y, row, col, num, fig):
    layer = len(y)
    axis = fig.add_subplot(row, col, num)
    for i in range(1, layer):
        for j in range(i):
            plt.plot([x[i - 1][j], x[i][j], x[i][j + 1], x[i - 1][j]],
                     [y[i - 1], y[i], y[i], y[i - 1]])

def plot3(x, y, row, col, num, fig):
    layer = len(y)
    axis = fig.add_subplot(row, col, num)
    for i in range(1, layer):
        for j in range(i):
            axis.plot([x[i - 1][j], x[i][j], x[i][j + 1], x[i - 1][j]],
                     [y[i - 1][j], y[i][j], y[i][j + 1], y[i - 1][j]])

def distort(x_list, y_list, k=1):
    g = lambda theta, distance, k: theta + 0.02 * k * distance
    new_x = deepcopy(x_list)
    new_y = deepcopy(x_list)
    for index in range(len(x_list)):
        y = y_list[index]
        for j in range(index + 1):
            angle, distance = get_polar_para(x_list[index][j], y)
            new_x[index][j] = distance * math.cos(g(angle, distance, k))
            new_y[index][j] = distance * math.sin(g(angle, distance, k))
    return [new_x, new_y]

x_axis, y_axis = triangle_struct(layer=10)
fig = plt.figure(num=1, figsize=(18, 10))
plot(x_axis, y_axis, 4, 4, 1, fig)
for i in range(2, 17):
    _x, _y = distort(x_axis, y_axis, k=i)
    plot3(_x, _y, 4, 4, i, fig)

plt.show()




![[FineReport]安装与使用(连接Hive3.1.2)](https://img-blog.csdnimg.cn/f9fc1b418f2f451ba15fb6f60432cf66.png)


