可视化动图展示
目前只能在 jupyter notebook 中测试成功
%matplotlib notebook
import numpy as np
import matplotlib.pyplot as plt
import time

n = 500
data = np.random.normal(0,1,n)

fig = plt.figure()
ax = fig.add_subplot(111)

fig.show()
fig.canvas.draw()

for i in range(0,100):
    ax.clear()
    ax.plot(data[0:i]),ax.axis([-1,110,-3,3])
    fig.canvas.draw()
    time.sleep(0.1)

%matplotlib notebook
import numpy as np
import matplotlib.pyplot as plt
import seaborn as sns
import time

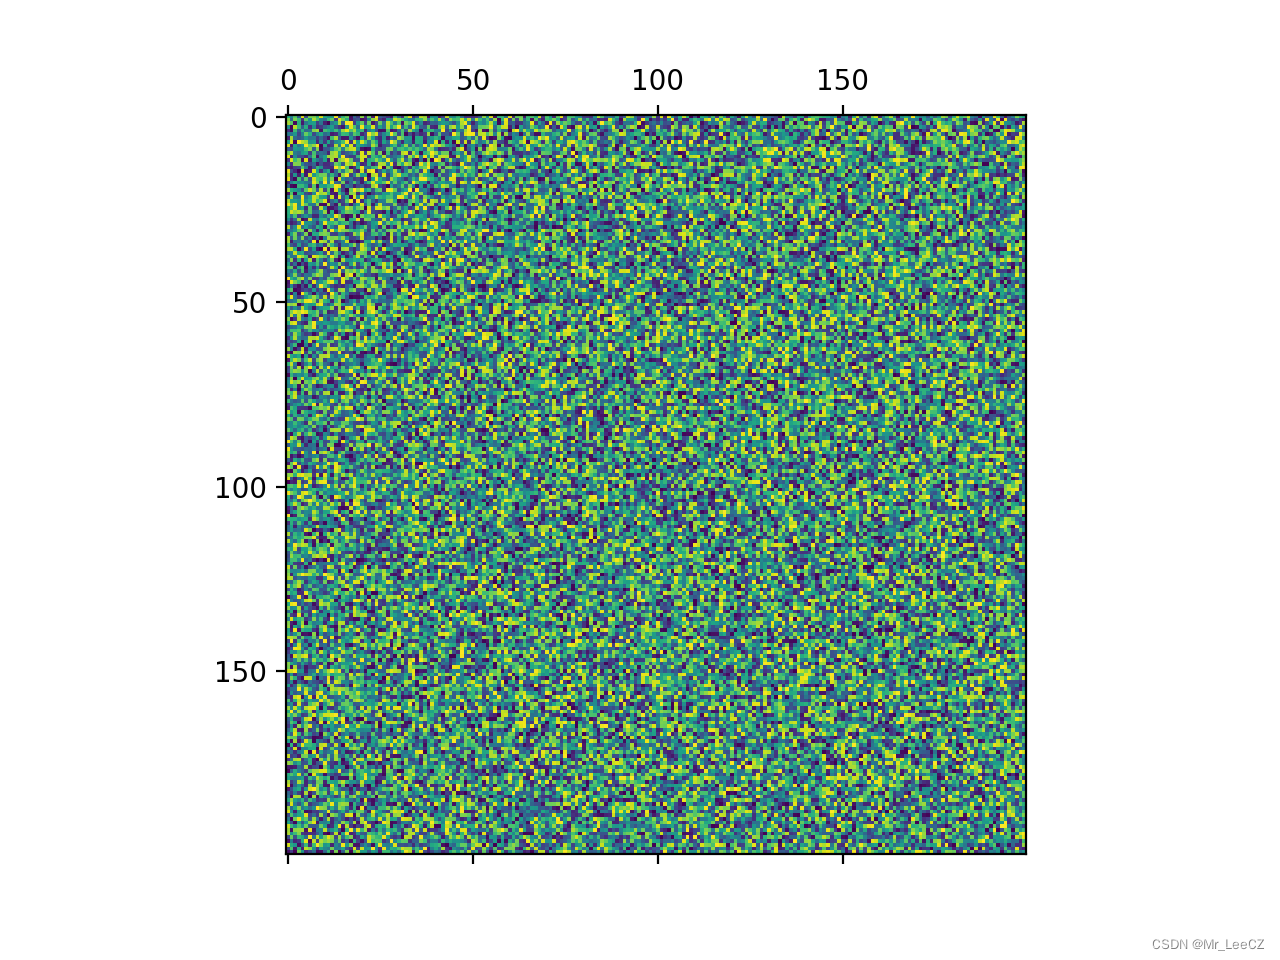
n = 200

fig = plt.figure()
ax = fig.add_subplot(111)

fig.show()
fig.canvas.draw()

for i in range(0,100):
    ax.clear()
    mat = np.random.rand(n,n)
    ax.matshow(mat)
    fig.canvas.draw()
    time.sleep(0.1)




![孜然单授权系统V1.0[免费使用]](https://img-blog.csdnimg.cn/5d4887a2f14340c0895275802115f550.png)


