文章目录
- 一. 传统的ELK
- 二. EFK
- 2.1 安装elasticsearch
- 2.2 服务端安装fileBeats
- 2.2.1. 安装 `该也没有必要安装docker`,直接下载yum或官网jar包启动即可.
- 2.2.2.编辑配置文件 filebeat-java-logback.yml
- 2.2.3. es配置`common_log_pipeline`解析日志
- 三.启动测试-logback-spring.xml配置
最近发现,logstash日志收集器本身的内存占用和es相当,这也是有一部分因为logstash用java开发,其jvm本身就是内存消耗大户.为了降本增效,发现用go开发的beats可以替代logstash.
ELK : 通常我们将服务器日志通过logback的http发送至logstash服务器统一处理,logstash采集处理后发送到elasticsearch服务器.
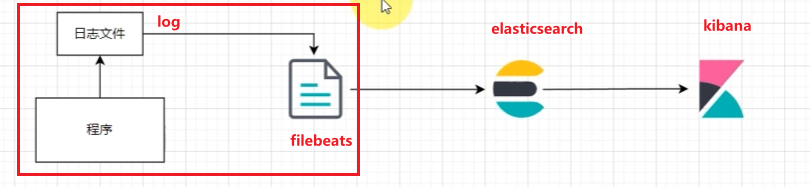
EFK: 通常我们将服务器日志保存到本机,本机启动filebeats,fliebeats采集处理发送至elasticsearch.
一. 传统的ELK
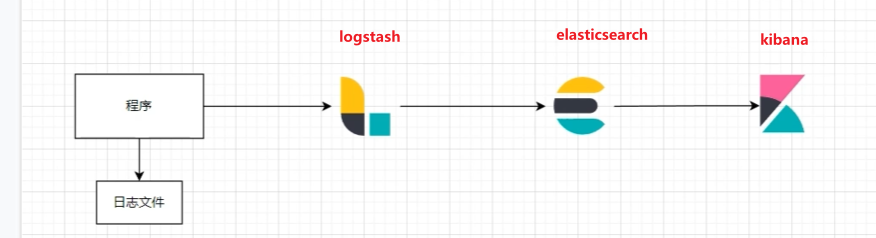
logstash+elasticsearch+Kibana(ELK)日志收集
二. EFK
2.1 安装elasticsearch
该docker安装只针对7.18以下版本. 7.18+默认开启生产模式
# 安装es
docker pull elasticsearch:7.17.3
mkdir -p /mydata/elasticsearch/config
mkdir -p /mydata/elasticsearch/data
echo "http.host: 0.0.0.0" >> /mydata/elasticsearch/config/elasticsearch.yml
chmod -R 777 /mydata/elasticsearch/

docker run --name elasticsearch -p 9200:9200 -p 9300:9300 \
-e "discovery.type=single-node" \
-e ES_JAVA_OPTS="-Xms512m -Xmx512m" \
--restart=always --privileged=true \
-v /mydata/elasticsearch/config/elasticsearch.yml:/usr/share/elasticsearch/config/elasticsearch.yml \
-v /mydata/elasticsearch/data:/usr/share/elasticsearch/data \
-v /mydata/elasticsearch/plugins:/usr/share/elasticsearch/plugins \
-d elasticsearch:7.17.3
http.host: 0.0.0.0
http.cors.enabled: true
http.cors.allow-origin: "*"
http.cors.allow-headers: Authorization
xpack.security.enabled: true
# Enable encryption and mutual authentication between cluster nodes
xpack.security.transport.ssl.enabled: true
# Enable encryption for HTTP API client connections, such as Kibana, Logstash, and Agents
xpack.security.http.ssl.enabled: false
3. 重启es容器并进入es容器
4. 进入容器后执行以下命令 傻瓜式设置账号密码
./bin/elasticsearch-setup-passwords interactive
5. 重启es容器
2.2 服务端安装fileBeats
2.2.1. 安装 该也没有必要安装docker,直接下载yum或官网jar包启动即可.
强烈建议不要用docker,docker不保证不出错
# 安装beats
docker run -d --name=filebeat:7.17.3 docker.elastic.co/beats/filebeat:7.17.3 \
--privileged=true \
--restart=always \
-v /mydata/beats/filebeat.yml:/usr/share/filebeat/filebeat.yml:ro \
-v /mydata/beats/lib/docker/containers:/var/lib/docker/containers:ro \
-v /mydata/beats/run/docker.sock:/var/run/docker.sock:ro \
-v /mydata/beats/log/messages:/var/log/messages \
-e --strict.perms=false \
-E output.elasticsearch.hosts=["elasticsearch:9200"]
# 安装管道
filebeat setup  --pipelines --modules system
2.2.2.编辑配置文件 filebeat-java-logback.yml
目的: 1.设置filebeat的抓取数据路径 2.设置输出目标,及使用何种预处理
以下是7.17.3到8.6的官方配置.只做增添.
###################### Filebeat Configuration Example #########################

# This file is an example configuration file highlighting only the most common
# options. The filebeat.reference.yml file from the same directory contains all the
# supported options with more comments. You can use it as a reference.
#
# You can find the full configuration reference here:
# https://www.elastic.co/guide/en/beats/filebeat/index.html

# For more available modules and options, please see the filebeat.reference.yml sample
# configuration file.

# ============================== Filebeat inputs ===============================

filebeat.inputs:

  # Each - is an input. Most options can be set at the input level, so
  # you can use different inputs for various configurations.
  # Below are the input-specific configurations.

  # filestream is an input for collecting log messages from files.
  - type: filestream
    encoding: utf-8
    # Unique ID among all inputs, an ID is required.
    id: my-filestream-id

    # Change to true to enable this input configuration.
    enabled: true

    # Paths that should be crawled and fetched. Glob based paths.
    paths:
      - c:/mydata/filebeat/logs/*.log
      #- /mydata/filebeat/logs/*.log
    # yyyy-MM-dd 时间格式开头的行,合并到上一行末
    multiline:
      pattern: '^\d{4}\-\d{2}\-\d{2}'
      negate: true
      match: after
    # Exclude lines. A list of regular expressions to match. It drops the lines that are
    # matching any regular expression from the list.
    # Line filtering happens after the parsers pipeline. If you would like to filter lines
    # before parsers, use include_message parser.
    #exclude_lines: ['^DBG']

    # Include lines. A list of regular expressions to match. It exports the lines that are
    # matching any regular expression from the list.
    # Line filtering happens after the parsers pipeline. If you would like to filter lines
    # before parsers, use include_message parser.
    #include_lines: ['^ERR', '^WARN']

    # Exclude files. A list of regular expressions to match. Filebeat drops the files that
    # are matching any regular expression from the list. By default, no files are dropped.
    #prospector.scanner.exclude_files: ['.gz$']

    # Optional additional fields. These fields can be freely picked
    # to add additional information to the crawled log files for filtering
    #fields:
    #  level: debug
    #  review: 1

# ============================== Filebeat modules ==============================

filebeat.config.modules:
  # Glob pattern for configuration loading
  path: ${path.config}/modules.d/*.yml

  # Set to true to enable config reloading
  reload.enabled: true

  # Period on which files under path should be checked for changes
  #reload.period: 10s

# ======================= Elasticsearch template setting =======================

setup.template.settings:
  index.number_of_shards: 1
  #index.codec: best_compression
  #_source.enabled: false
setup.template.name: "yqc"      # 设置一个新的模板,模板的名称
setup.template.pattern: "yqc-*" # 模板匹配那些索引,这里表示以yqc开头的所有的索引
setup.template.overwrite: true
setup.template.enabled: false
setup.ilm.enabled: false
#index.codec: best_compression
#_source.enabled: false

# ================================== General ===================================

# The name of the shipper that publishes the network data. It can be used to group
# all the transactions sent by a single shipper in the web interface.
#name:

# The tags of the shipper are included in their field with each
# transaction published.
#tags: ["service-X", "web-tier"]

# Optional fields that you can specify to add additional information to the
# output.
#fields:
#  env: staging

# ================================= Dashboards =================================
# These settings control loading the sample dashboards to the Kibana index. Loading
# the dashboards is disabled by default and can be enabled either by setting the
# options here or by using the `setup` command.
#setup.dashboards.enabled: false

# The URL from where to download the dashboard archive. By default, this URL
# has a value that is computed based on the Beat name and version. For released
# versions, this URL points to the dashboard archive on the artifacts.elastic.co
# website.
#setup.dashboards.url:

# =================================== Kibana ===================================

# Starting with Beats version 6.0.0, the dashboards are loaded via the Kibana API.
# This requires a Kibana endpoint configuration.
setup.kibana:

# Kibana Host
# Scheme and port can be left out and will be set to the default (http and 5601)
# In case you specify and additional path, the scheme is required: http://localhost:5601/path
# IPv6 addresses should always be defined as: https://[2001:db8::1]:5601
#host: "localhost:5601"

# Kibana Space ID
# ID of the Kibana Space into which the dashboards should be loaded. By default,
# the Default Space will be used.
#space.id:

# =============================== Elastic Cloud ================================

# These settings simplify using Filebeat with the Elastic Cloud (https://cloud.elastic.co/).

# The cloud.id setting overwrites the `output.elasticsearch.hosts` and
# `setup.kibana.host` options.
# You can find the `cloud.id` in the Elastic Cloud web UI.
#cloud.id:

# The cloud.auth setting overwrites the `output.elasticsearch.username` and
# `output.elasticsearch.password` settings. The format is `<user>:<pass>`.
#cloud.auth:

# ================================== Outputs ===================================

# Configure what output to use when sending the data collected by the beat.

# ---------------------------- Elasticsearch Output ----------------------------
output.elasticsearch:
  # Array of hosts to connect to.
  hosts: [ "localhost:9200" ]
  username: "elastic"
  password: "elastic"
  # pipeline使用的是es的管道解析功能
  pipeline: "common_log_pipeline"
  encoding: utf-8
  indices:
    - index: "yqc-info-%{[agent.version]}-%{+yyyy.MM.dd}"
      when.contains:
        message: "INFO"
    - index: "yqc-error-%{[agent.version]}-%{+yyyy.MM.dd}"
      when.contains:
        message: "ERROR"
  # Protocol - either `http` (default) or `https`.
  #protocol: "https"

  # Authentication credentials - either API key or username/password.
  #api_key: "id:api_key"
  #username: "elastic"
  #password: "changeme"

  # ------------------------------ Logstash Output -------------------------------
  #output.logstash:
  # The Logstash hosts
  #hosts: ["localhost:5044"]

  # Optional SSL. By default is off.
  # List of root certificates for HTTPS server verifications
  #ssl.certificate_authorities: ["/etc/pki/root/ca.pem"]

  # Certificate for SSL client authentication
  #ssl.certificate: "/etc/pki/client/cert.pem"

  # Client Certificate Key
  #ssl.key: "/etc/pki/client/cert.key"

# ================================= Processors =================================
# pipeline使用的是es的解析功能,而processors是filebeats本身的功能
processors:
  - add_host_metadata:
      when.not.contains.tags: forwarded
  - add_cloud_metadata: ~
  - add_docker_metadata: ~
  - add_kubernetes_metadata: ~

    # ================================== Logging ===================================

    # Sets log level. The default log level is info.
    # Available log levels are: error, warning, info, debug
    #logging.level: debug

    # At debug level, you can selectively enable logging only for some components.
    # To enable all selectors, use ["*"]. Examples of other selectors are "beat",
    # "publisher", "service".
    #logging.selectors: ["*"]

    # ============================= X-Pack Monitoring ==============================
    # Filebeat can export internal metrics to a central Elasticsearch monitoring
    # cluster.  This requires xpack monitoring to be enabled in Elasticsearch.  The
    # reporting is disabled by default.

    # Set to true to enable the monitoring reporter.
    #monitoring.enabled: false

    # Sets the UUID of the Elasticsearch cluster under which monitoring data for this
    # Filebeat instance will appear in the Stack Monitoring UI. If output.elasticsearch
    # is enabled, the UUID is derived from the Elasticsearch cluster referenced by output.elasticsearch.
    #monitoring.cluster_uuid:

    # Uncomment to send the metrics to Elasticsearch. Most settings from the
    # Elasticsearch outputs are accepted here as well.
    # Note that the settings should point to your Elasticsearch *monitoring* cluster.
    # Any setting that is not set is automatically inherited from the Elasticsearch
    # output configuration, so if you have the Elasticsearch output configured such
    # that it is pointing to your Elasticsearch monitoring cluster, you can simply
    # uncomment the following line.
    #monitoring.elasticsearch:

    # ============================== Instrumentation ===============================

    # Instrumentation support for the filebeat.
    #instrumentation:
    # Set to true to enable instrumentation of filebeat.
    #enabled: false

    # Environment in which filebeat is running on (eg: staging, production, etc.)
    #environment: ""

    # APM Server hosts to report instrumentation results to.
    #hosts:
    #  - http://localhost:8200

    # API Key for the APM Server(s).
    # If api_key is set then secret_token will be ignored.
    #api_key:

    # Secret token for the APM Server(s).
    #secret_token:


# ================================= Migration ==================================

# This allows to enable 6.7 migration aliases
#migration.6_to_7.enabled: true
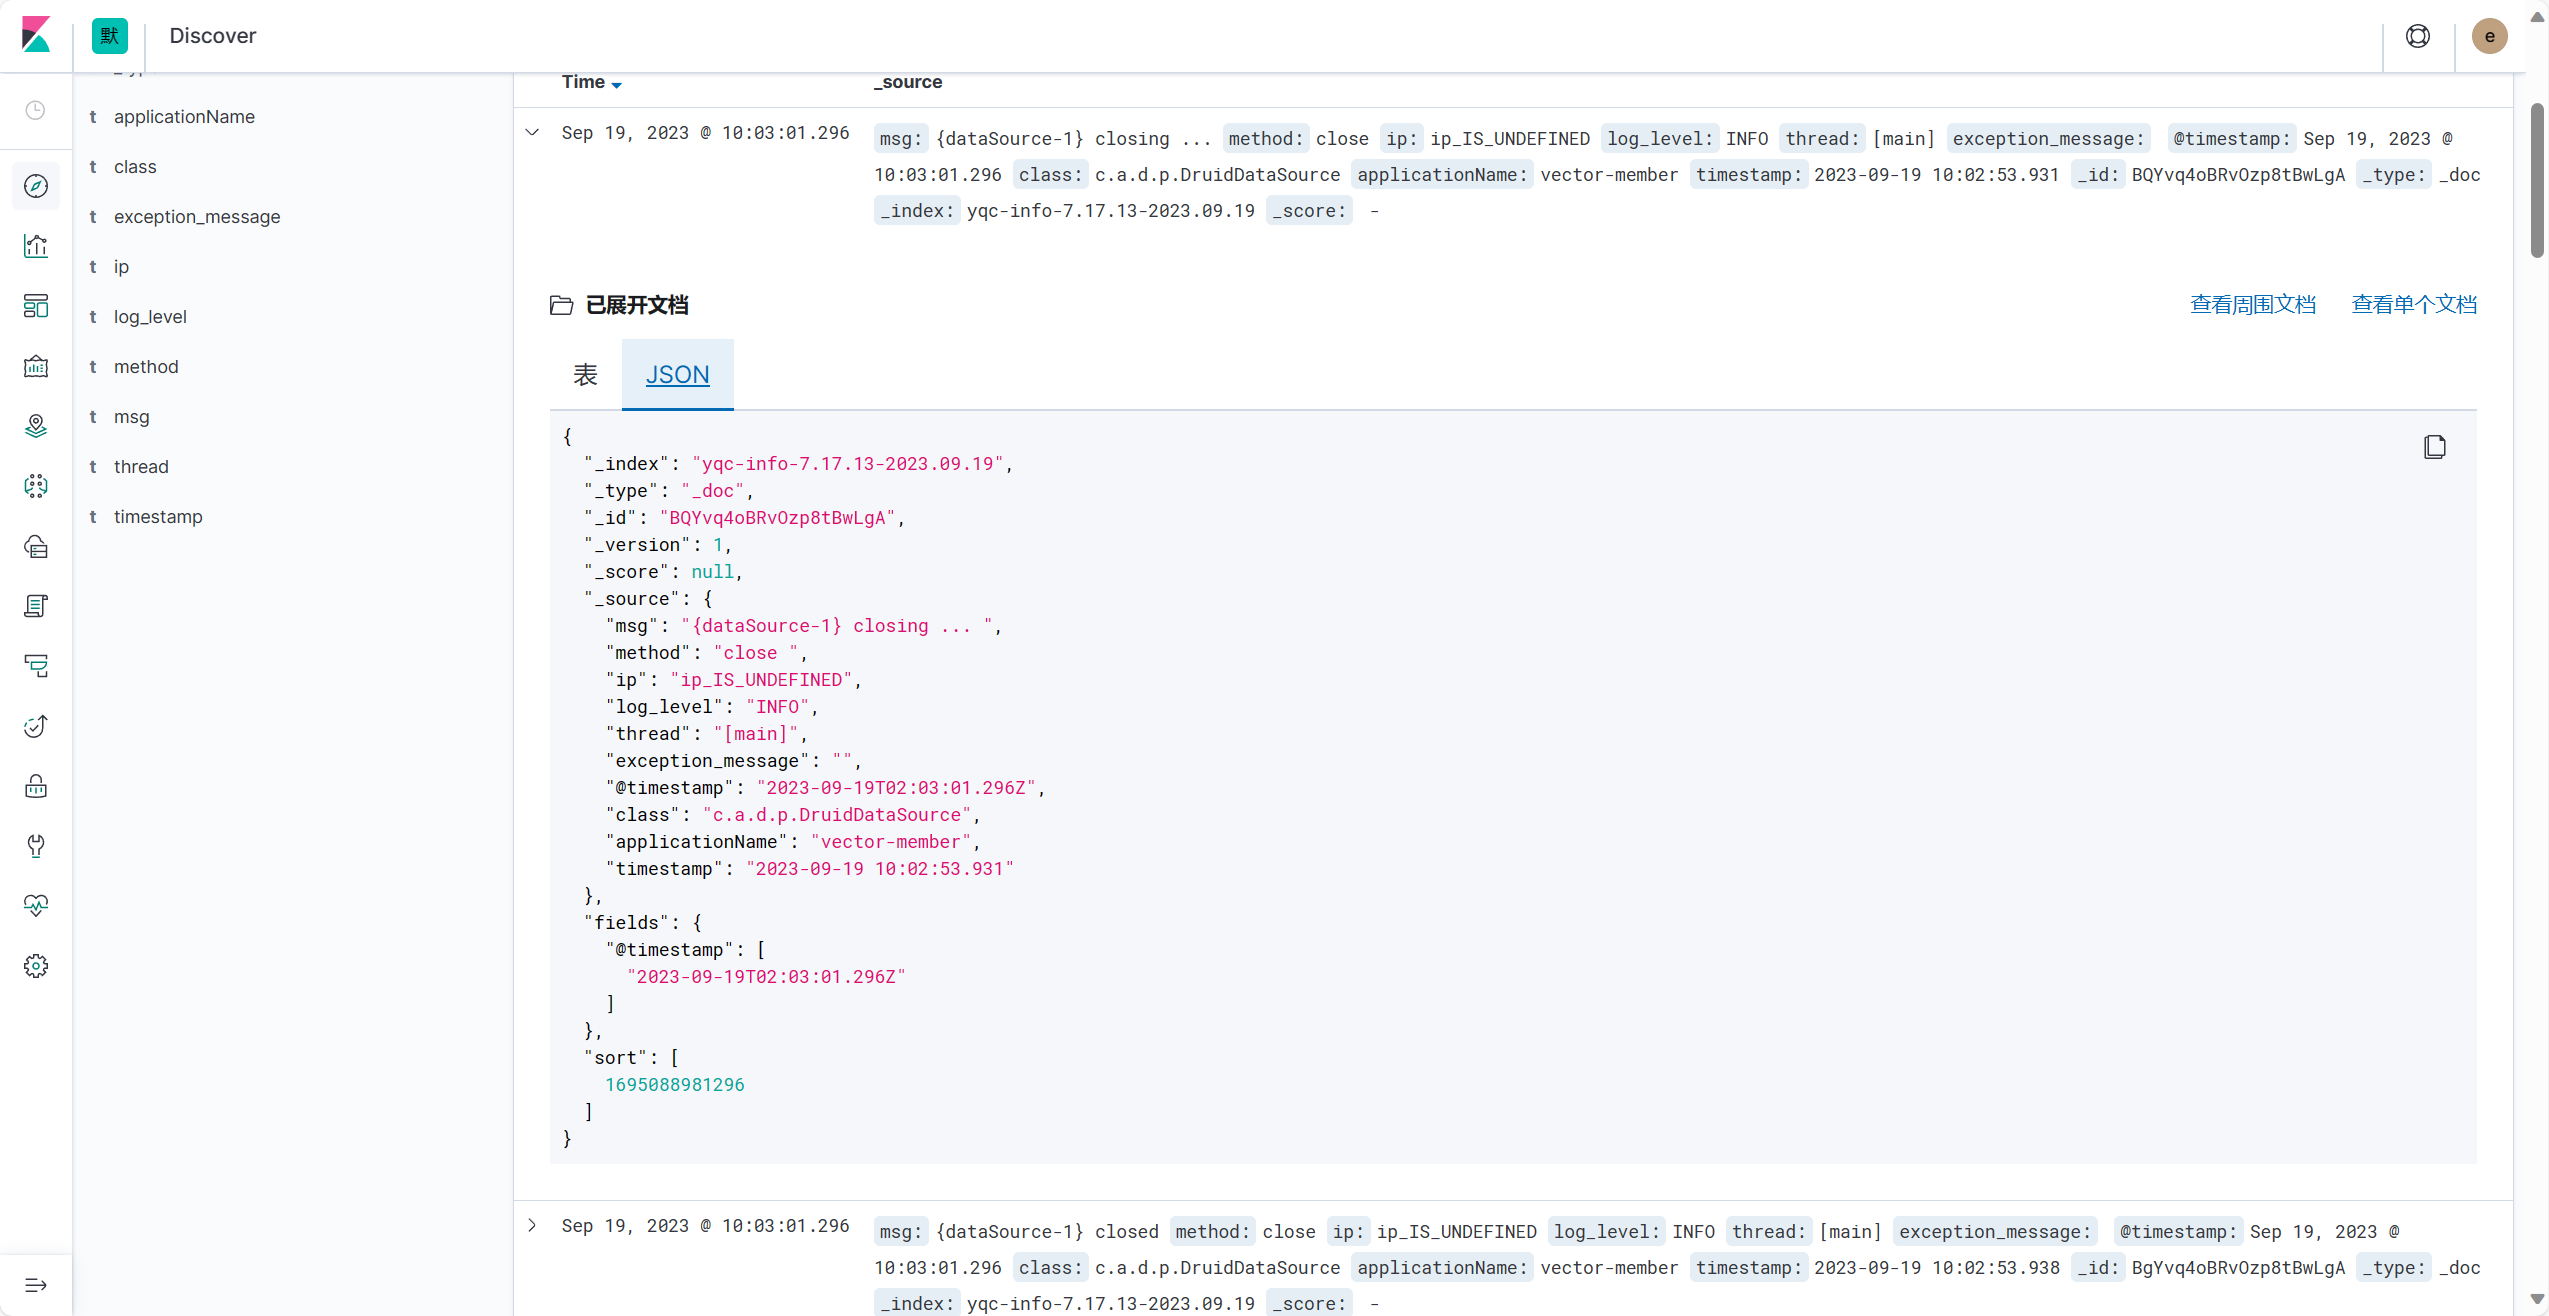
2.2.3. es配置common_log_pipeline解析日志
目的: 我们需要根据日志数据来自定义解析结果, 当然默认的也可以.自定义就需要使用pipeline功能
日志打印格式
    <!-- 日志输出格式 -->
    <property name="log.console.pattern" value="%d{yyyy-MM-dd HH:mm:ss.SSS,GMT+8}-${applicationName}-%magenta(${IP})-%blue([%thread])-%highlight(%-5level)-%logger{20}-%yellow(%method)-%cyan(%msg)-%red(%exception%n)" />
    <property name="log.file.pattern" value="%d{yyyy-MM-dd HH:mm:ss.SSS,GMT+8}-${applicationName}-${ip}-[%thread]-%level-%logger{20}-%method-%msg-%exception%n" />
日志数据
2023-09-19 09:27:48.483 |vector-member |IP_IS_UNDEFINED |[main] |INFO |org.redisson.Version |logVersion |Redisson 3.20.0 |asdas
grok解析
在es中转义需要 \\ ,这样的话grok测试看不出来.这点就很奇怪.
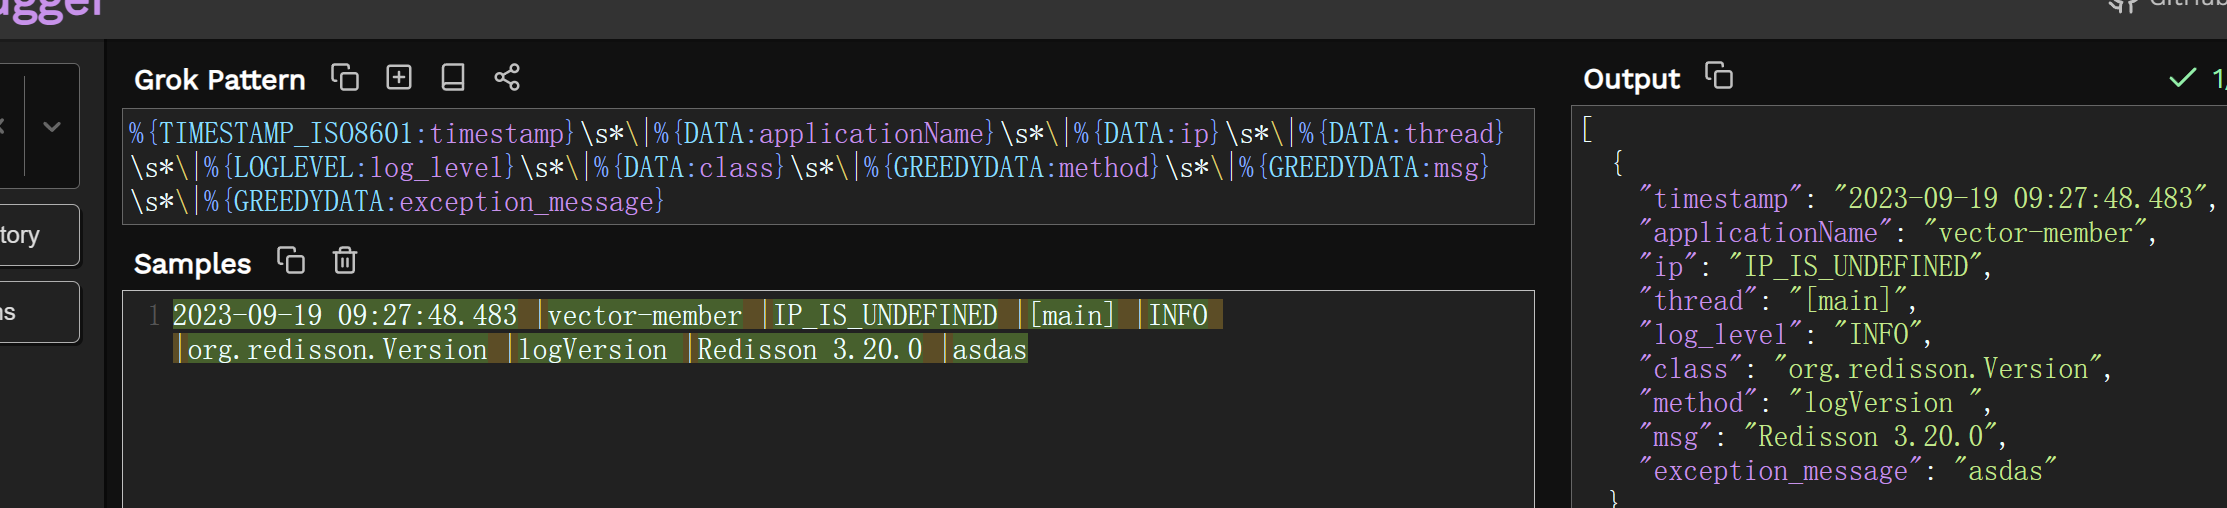

您必须按照图二,双转义才能被es解析
%{TIMESTAMP_ISO8601:timestamp}\\s*\\|%{DATA:applicationName}\\s*\\|%{DATA:ip}\\s*\\|%{DATA:thread}\\s*\\|%{LOGLEVEL:log_level}\\s*\\|%{DATA:class}\\s*\\|%{GREEDYDATA:method}\\s*\\|%{GREEDYDATA:msg}\\s*\\|%{GREEDYDATA:exception_message}
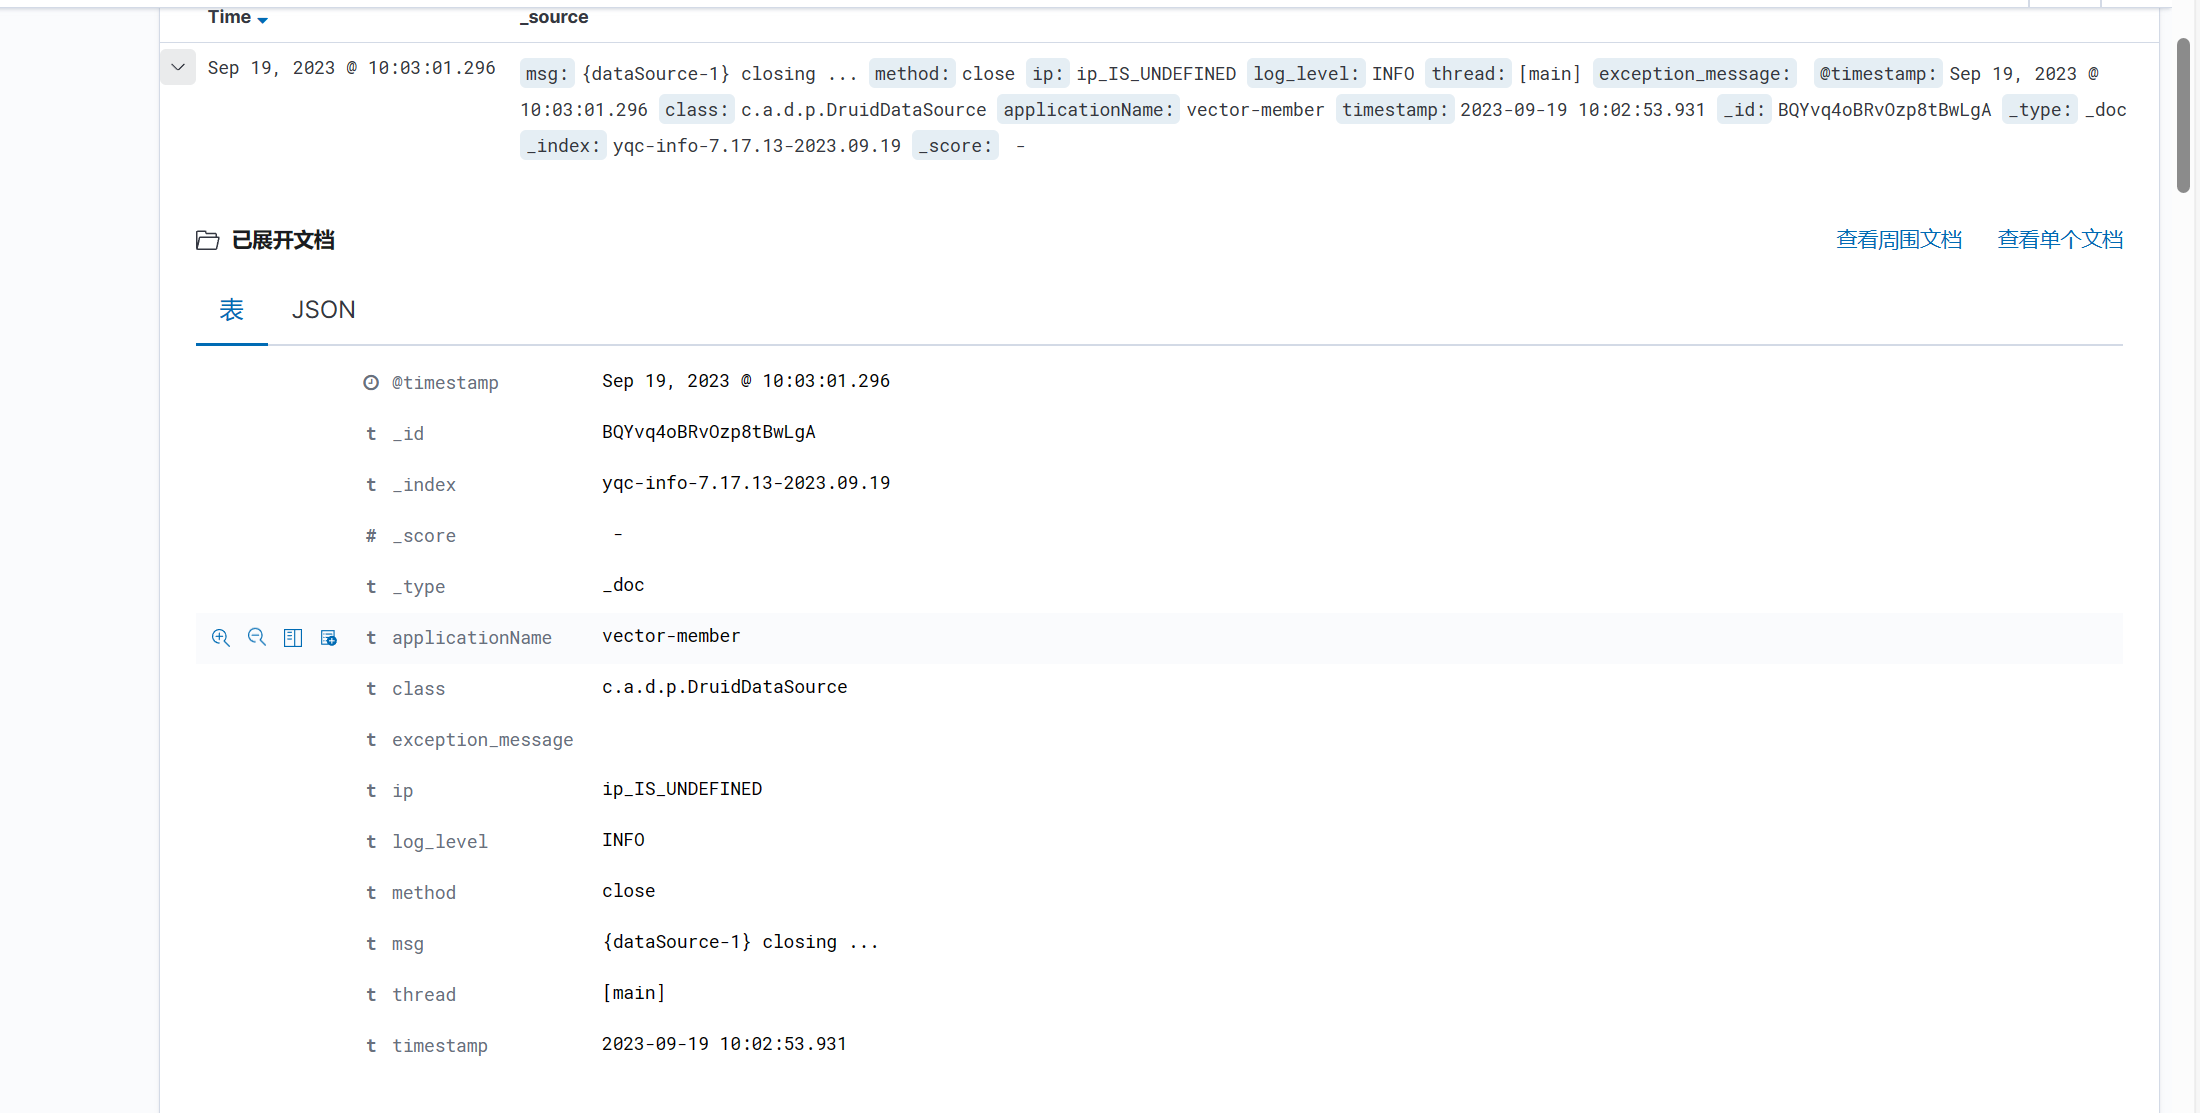
对应的预处理方法 即数据被映射的数据项
GET _ingest/pipeline/common_log_pipeline
DELETE _ingest/pipeline/common_log_pipeline
PUT _ingest/pipeline/common_log_pipeline
{
  "description": "common_log_pipeline",
  "processors": [
      {
      "grok": {
        "field": "message",
        "patterns": [
          "%{TIMESTAMP_ISO8601:timestamp}\\s*\\|%{DATA:applicationName}\\s*\\|%{DATA:ip}\\s*\\|%{DATA:thread}\\s*\\|%{LOGLEVEL:log_level}\\s*\\|%{DATA:class}\\s*\\|%{GREEDYDATA:method}\\s*\\|%{GREEDYDATA:msg}\\s*\\|%{GREEDYDATA:exception_message}"
        ],
        "ignore_failure":true
      }
    },
    {
      "remove" : {
        "field" : "input"
      }
    },
    {
      "remove" : {
        "field" : "message"
      }
    },
    {
      "remove" : {
        "field" : "agent"
      }
    },
    {
      "remove" : {
        "field" : "ecs"
      }
    },
    {
      "remove" : {
        "field" : "host"
      }
    },
    {
      "remove" : {
        "field" : "log"
      }
    }
  ]
}
三.启动测试-logback-spring.xml配置
logback-spring.xml配置
<?xml version="1.0" encoding="UTF-8"?>
<configuration scan="true" scanPeriod="60 seconds" debug="false">
    <include resource="org/springframework/boot/logging/logback/base.xml"/>
    <include resource="org/springframework/boot/logging/logback/defaults.xml"/>

    <springProperty scope="context" name="applicationName" source="spring.application.name" defaultValue="default"/>
    <!-- 日志文件路径 linux-->
    <property scope="context" name="LOG_PATH" value="/mydata/filebeat/logs"/>
    <!-- 日志输出IP 这个很简单.自定义即可-->
    <conversionRule conversionWord="IP" converterClass="com/vector/common/config/LogbackHostAddressPropertyDefiner" />
    <!-- 日志输出格式 -->
    <property name="log.console.pattern" value="%d{yyyy-MM-dd HH:mm:ss.SSS,GMT+8} |${applicationName} |%magenta(${IP}) |%blue([%thread]) |%highlight(%-5level) |%logger{20} |%yellow(%method) |%cyan(%msg) |%red(%exception%n)" />
    <property name="log.file.pattern" value="%d{yyyy-MM-dd HH:mm:ss.SSS,GMT+8} |${applicationName} |${ip} |[%thread] |%level |%logger{20} |%method |%msg |%exception%n" />


    <!--输出到控制台-->
    <appender name="CONSOLE" class="ch.qos.logback.core.ConsoleAppender">
        <filter class="ch.qos.logback.classic.filter.ThresholdFilter">
            <level>INFO</level>
        </filter>
        <withJansi>false</withJansi>
        <encoder>
            <pattern>${log.console.pattern}</pattern>
            <charset>UTF-8</charset>
        </encoder>
    </appender>
    <!-- 按照每天生成日志文件 -->
    <appender name="FILE_INFO" class="ch.qos.logback.core.rolling.RollingFileAppender">
        <rollingPolicy class="ch.qos.logback.core.rolling.TimeBasedRollingPolicy">
            <!--日志文件输出的文件名-->
            <FileNamePattern>${LOG_PATH}/yqc-info-%d{yyyy-MM-dd}.log</FileNamePattern>
            <!--日志文件保留天数-->
            <MaxHistory>30</MaxHistory>
        </rollingPolicy>
        <encoder charset="UTF-8" class="ch.qos.logback.classic.encoder.PatternLayoutEncoder">
            <pattern>${log.file.pattern}</pattern>
        </encoder>
        <filter class="ch.qos.logback.classic.filter.LevelFilter">
            <!-- 过滤的级别 -->
            <level>INFO</level>
            <!-- 匹配时的操作:接收(记录) -->
            <onMatch>ACCEPT</onMatch>
            <!-- 不匹配时的操作:拒绝(不记录) -->
            <onMismatch>DENY</onMismatch>
        </filter>
        <!--日志文件最大的大小-->
        <triggeringPolicy class="ch.qos.logback.core.rolling.SizeBasedTriggeringPolicy">
            <MaxFileSize>60MB</MaxFileSize>
        </triggeringPolicy>
    </appender>

    <appender name="FILE_ERROR" class="ch.qos.logback.core.rolling.RollingFileAppender">
        <rollingPolicy class="ch.qos.logback.core.rolling.TimeBasedRollingPolicy">
            <!--日志文件输出的文件名-->
            <FileNamePattern>${LOG_PATH}/yqc-error-%d{yyyy-MM-dd}.log</FileNamePattern>
            <!--日志文件保留天数-->
            <MaxHistory>30</MaxHistory>
        </rollingPolicy>
        <encoder charset="UTF-8" class="ch.qos.logback.classic.encoder.PatternLayoutEncoder">
            <pattern>${log.file.pattern}</pattern>
        </encoder>
        <filter class="ch.qos.logback.classic.filter.LevelFilter">
            <!-- 过滤的级别 -->
            <level>ERROR</level>
            <!-- 匹配时的操作:接收(记录) -->
            <onMatch>ACCEPT</onMatch>
            <!-- 不匹配时的操作:拒绝(不记录) -->
            <onMismatch>DENY</onMismatch>
        </filter>
        <!--日志文件最大的大小-->
        <triggeringPolicy class="ch.qos.logback.core.rolling.SizeBasedTriggeringPolicy">
            <MaxFileSize>30MB</MaxFileSize>
        </triggeringPolicy>
    </appender>

    <!-- 日志输出级别 -->
    <logger name="*" level="info" />
    <!-- 线上环境,日志配置 -->
    <springProfile name="prod">
        <!--系统操作日志-->
        <root level="info">
            <appender-ref ref="FILE_INFO" />
            <appender-ref ref="FILE_ERROR" />
        </root>
    </springProfile>

    <!-- 本地、开发环境,日志配置 可以写logback支持的所有节点 -->
    <springProfile name="dev,test">
        <!--系统操作日志-->
        <root level="info">
            <appender-ref ref="CONSOLE" />
            <appender-ref ref="FILE_INFO" />
            <appender-ref ref="FILE_ERROR" />
        </root>
    </springProfile>

</configuration>
filebeat应该和服务器代码一起,利用filebeat采集服务器存储的日志文件发送到es.
# linux
./filebeat -e -c filebeat.yml
# windows
filebeat.exe -e -c filebeat.yml