单细胞生信分析教程
桓峰基因公众号推出单细胞生信分析教程并配有视频在线教程,目前整理出来的相关教程目录如下:
Topic 6. 克隆进化之 Canopy
Topic 7. 克隆进化之 Cardelino
Topic 8. 克隆进化之 RobustClone
SCS【1】今天开启单细胞之旅,述说单细胞测序的前世今生
SCS【2】单细胞转录组 之 cellranger
SCS【3】单细胞转录组数据 GEO 下载及读取
SCS【4】单细胞转录组数据可视化分析 (Seurat 4.0)
SCS【5】单细胞转录组数据可视化分析 (scater)
SCS【6】单细胞转录组之细胞类型自动注释 (SingleR)
SCS【7】单细胞转录组之轨迹分析 (Monocle 3) 聚类、分类和计数细胞
SCS【8】单细胞转录组之筛选标记基因 (Monocle 3)
SCS【9】单细胞转录组之构建细胞轨迹 (Monocle 3)
SCS【10】单细胞转录组之差异表达分析 (Monocle 3)
SCS【11】单细胞ATAC-seq 可视化分析 (Cicero)
SCS【12】单细胞转录组之评估不同单细胞亚群的分化潜能 (Cytotrace)
SCS【13】单细胞转录组之识别细胞对“基因集”的响应 (AUCell)
SCS【14】单细胞调节网络推理和聚类 (SCENIC)
SCS【15】细胞交互:受体-配体及其相互作用的细胞通讯数据库 (CellPhoneDB)
SCS【16】从肿瘤单细胞RNA-Seq数据中推断拷贝数变化 (inferCNV)
SCS【17】从单细胞转录组推断肿瘤的CNV和亚克隆 (copyKAT)
SCS【18】细胞交互:受体-配体及其相互作用的细胞通讯数据库 (iTALK)
SCS【19】单细胞自动注释细胞类型 (Symphony)
SCS【20】单细胞数据估计组织中细胞类型(Music)
SCS【21】单细胞空间转录组可视化 (Seurat V5)
SCS【22】单细胞转录组之 RNA 速度估计 (Velocyto.R)
SCS【23】单细胞转录组之数据整合 (Harmony)
SCS【24】单细胞数据量化代谢的计算方法 (scMetabolism)
SCS【25】单细胞细胞间通信第一部分细胞通讯可视化(CellChat)
SCS【26】单细胞细胞间通信第二部分通信网络的系统分析(CellChat)
SCS【27】单细胞转录组之识别标记基因 (scran)
SCS【28】单细胞转录组加权基因共表达网络分析(hdWGCNA)
SCS【29】单细胞基因富集分析 (singleseqgset)
SCS【30】单细胞空间转录组学数据库(STOmics DB)
SCS【31】减少障碍,加速单细胞研究数据库(Single Cell PORTAL)
SCS【32】基于scRNA-seq数据中推断单细胞的eQTLs (eQTLsingle)
简介
细胞群的鉴定通常依赖于使用已建立的标记基因对细胞簇进行人工注释。然而,标记基因的选择是一个耗时的过程,可能导致次优注释,因为标记必须提供样本中存在的单个细胞簇和各种细胞类型的信息。在这里,我们开发了一个计算平台 ScType 能够完全自动化和超快速的细胞类型鉴定,仅基于给定的 scRNA-seq 数据,以及一个全面的细胞标记数据库作为背景信息。利用来自不同人类和小鼠组织的6个 scRNA-seq 数据集,我们展示了 ScType 如何通过保证阳性和阴性标记基因在细胞簇和细胞类型中的特异性来提供公正和准确的细胞类型注释。还展示了 ScType 如何基于单核苷酸变体的单细胞呼叫来区分健康和恶性细胞群,使其成为抗癌应用的通用工具。这种广泛适用的方法既可以作为交互式web工具(https://sctype.app)部署,也可以利用R包ScType。
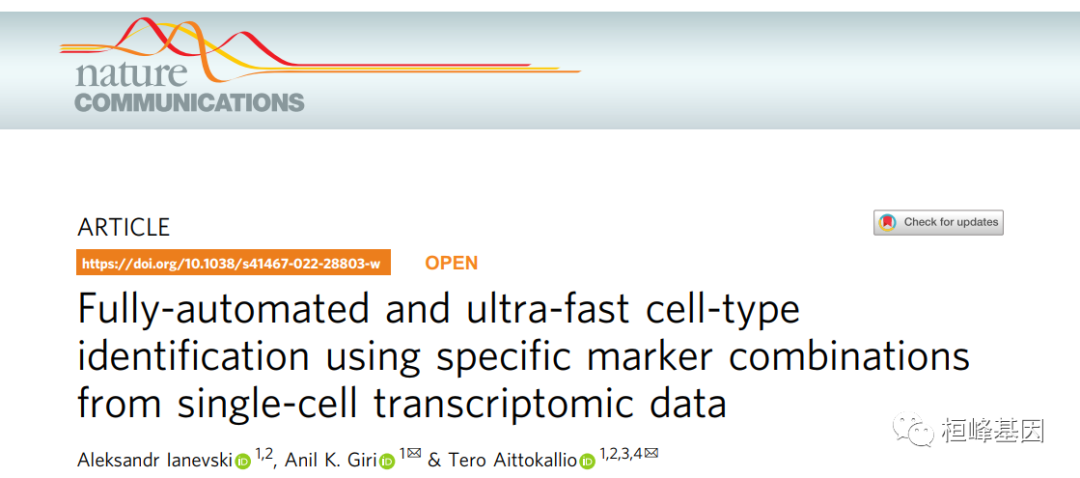
ScType只需要原始或预处理的单细胞转录组学数据集作为输入。ScType在需要的地方实现了额外的质量控制和规范化步骤的选项,随后是基于scRNA-seq谱的无监督细胞聚类。这里的结果是基于鲁汶聚类;然而,SC3, DBSCAN, GiniClust和k-means聚类选项也可以在ScType中使用(参见方法)。,ScType使用内置的综合标记数据库执行全自动细胞类型注释。最后,ScType实现了体细胞单细胞SNV Calling 的新选项,以区分健康和恶性细胞群。

软件包安装
这个代码并未打包成 R包,只需要在 https://github.com/IanevskiAleksandr/sc-type 上下载代码,然后解压之后找到对应的脚本和测试数据即可:
BiocManager::install("HGNChelper")lapply(c("dplyr", "HGNChelper", "openxlsx"), library, character.only = T)
## [[1]]
## [1] "dplyr" "stats" "graphics" "grDevices" "utils" "datasets"
## [7] "methods" "base"
##
## [[2]]
## [1] "HGNChelper" "dplyr" "stats" "graphics" "grDevices"
## [6] "utils" "datasets" "methods" "base"
##
## [[3]]
## [1] "openxlsx" "HGNChelper" "dplyr" "stats" "graphics"
## [6] "grDevices" "utils" "datasets" "methods" "base"
# BiocManager::install('HGNChelper')
library(knitr)
library(Seurat)
options(Seurat.object.assay.version = "v5")
source("./sc-type-master/R/gene_sets_prepare.R")
source("./sc-type-master/R/sctype_score_.R")
数据读取
数据读取很简单一个就是scRNAD-SEQ测序的原始数据,一个就是软件包的建好的数据库,用于注释的细胞类型和数据比较。
# get cell-type-specific gene sets from our in-built database (DB)
gs_list = gene_sets_prepare("./sc-type-master/ScTypeDB_short.xlsx", "Immune system") # e.g. Immune system, Liver, Pancreas, Kidney, Eye, Brain

# assign cell types
scRNAseqData = readRDS('./sc-type-master/exampleData.RDS'); #load example scRNA-seq matrix
kable(scRNAseqData[1:5,1:5])| AAACATACAACCAC-1 | AAACATTGAGCTAC-1 | AAACATTGATCAGC-1 | AAACCGTGCTTCCG-1 | AAACCGTGTATGCG-1 | |
|---|---|---|---|---|---|
| PPBP | -0.1429670 | -0.1429670 | -0.1429670 | 2.9146182 | -0.1429670 |
| S100A9 | -0.6451891 | -0.6451891 | -0.6451891 | 1.4654437 | -0.6451891 |
| IGLL5 | -0.1842098 | -0.1842098 | -0.1842098 | -0.1842098 | -0.1842098 |
| LYZ | -0.1103311 | 0.0619381 | 0.0791676 | 1.4103825 | -0.9725269 |
| GNLY | -0.4072929 | -0.4072929 | 0.7591113 | -0.4072929 | 2.4101548 |
实例操作
快速启动
若我们有准备好的scRNAseqData就可以快速计算,若没有就看参看下面的方式一步一步进行分析。
es.max = sctype_score(scRNAseqData = scRNAseqData, scaled = TRUE, gs = gs_list$gs_positive,
    gs2 = gs_list$gs_negative)

# View results, cell-type by cell matrix. See the complete example below
kable(es.max[1:5, 1:5])| AAACATACAACCAC-1 | AAACATTGAGCTAC-1 | AAACATTGATCAGC-1 | AAACCGTGCTTCCG-1 | AAACCGTGTATGCG-1 | |
|---|---|---|---|---|---|
| Pro-B cells | -0.8348617 | 1.584958 | -0.8348617 | 0.2924729 | -0.8348617 |
| Pre-B cells | -0.8394849 | 1.774219 | -0.8394849 | 0.3781757 | -0.8394849 |
| Immature B cells | -0.9172371 | 2.177044 | -0.8598132 | 0.5378010 | -1.1785085 |
| Naive B cells | -1.0375502 | 2.540720 | -1.0375502 | -0.0433344 | -1.0375502 |
| Memory B cells | -1.0375502 | 2.540720 | -1.0375502 | -0.0433344 | -1.0375502 |
细胞类型注释
加载数据并行性整理
首先,让加载一个PBMC3k示例数据集(有关如何使用Seurat加载数据集的更多细节,请参阅Seurat教程,https://satijalab.org/seurat/articles/pbmc3k_tutorial.html)。
原始数据可以在这里找到 https://cf.10xgenomics.com/samples/cell/pbmc3k/pbmc3k_filtered_gene_bc_matrices.tar.gz
接下来,让我们对数据进行规范化和聚类。
# Load the PBMC dataset
pbmc.data <- Read10X(data.dir = "./sc-type-master/filtered_gene_bc_matrices/hg19/")
# Initialize the Seurat object with the raw (non-normalized data).
pbmc <- CreateSeuratObject(counts = pbmc.data, project = "pbmc3k", min.cells = 3,
    min.features = 200)

# normalize data
pbmc[["percent.mt"]] <- PercentageFeatureSet(pbmc, pattern = "^MT-")
# pbmc <- subset(pbmc, subset = nFeature_RNA > 200 & nFeature_RNA < 2500 &
# percent.mt < 5) # make some filtering based on QC metrics visualizations, see
# Seurat tutorial: https://satijalab.org/seurat/articles/pbmc3k_tutorial.html
pbmc <- NormalizeData(pbmc, normalization.method = "LogNormalize", scale.factor = 10000)
pbmc <- FindVariableFeatures(pbmc, selection.method = "vst", nfeatures = 2000)

# scale and run PCA
pbmc <- ScaleData(pbmc, features = rownames(pbmc))
pbmc <- RunPCA(pbmc, features = VariableFeatures(object = pbmc))

# Check number of PC components (we selected 10 PCs for downstream analysis,
# based on Elbow plot)
ElbowPlot(pbmc)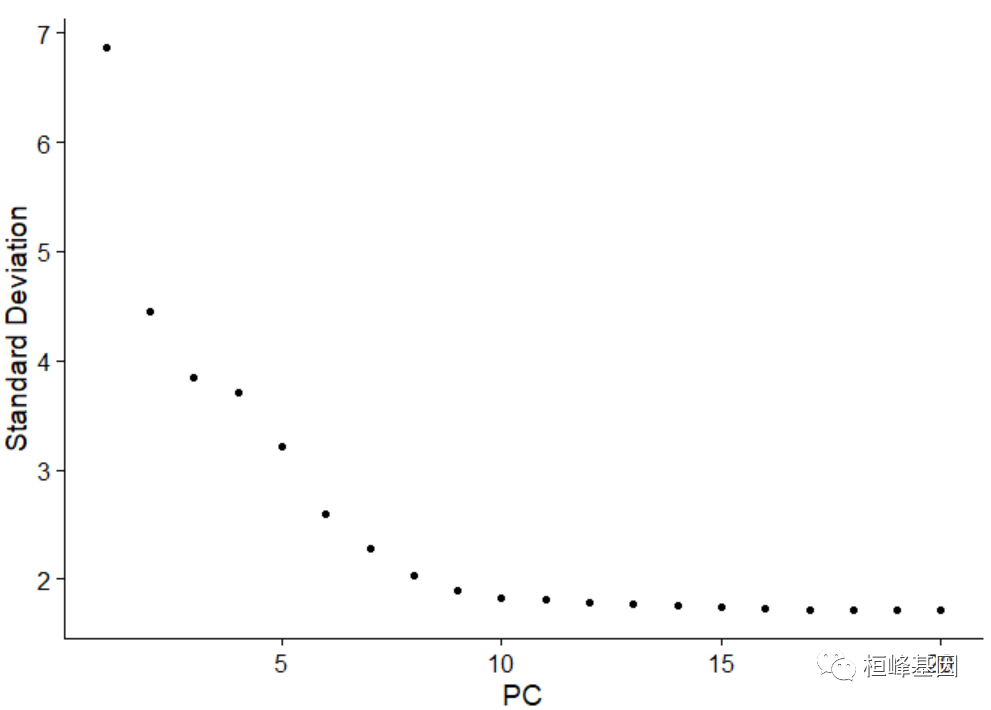
# cluster and visualize
pbmc <- FindNeighbors(pbmc, dims = 1:10)
pbmc <- FindClusters(pbmc, resolution = 0.8)
## Modularity Optimizer version 1.3.0 by Ludo Waltman and Nees Jan van Eck
##
## Number of nodes: 2700
## Number of edges: 97892
##
## Running Louvain algorithm...
## Maximum modularity in 10 random starts: 0.8314
## Number of communities: 11
## Elapsed time: 0 seconds
pbmc <- RunUMAP(pbmc, dims = 1:10)
DimPlot(pbmc, reduction = "umap")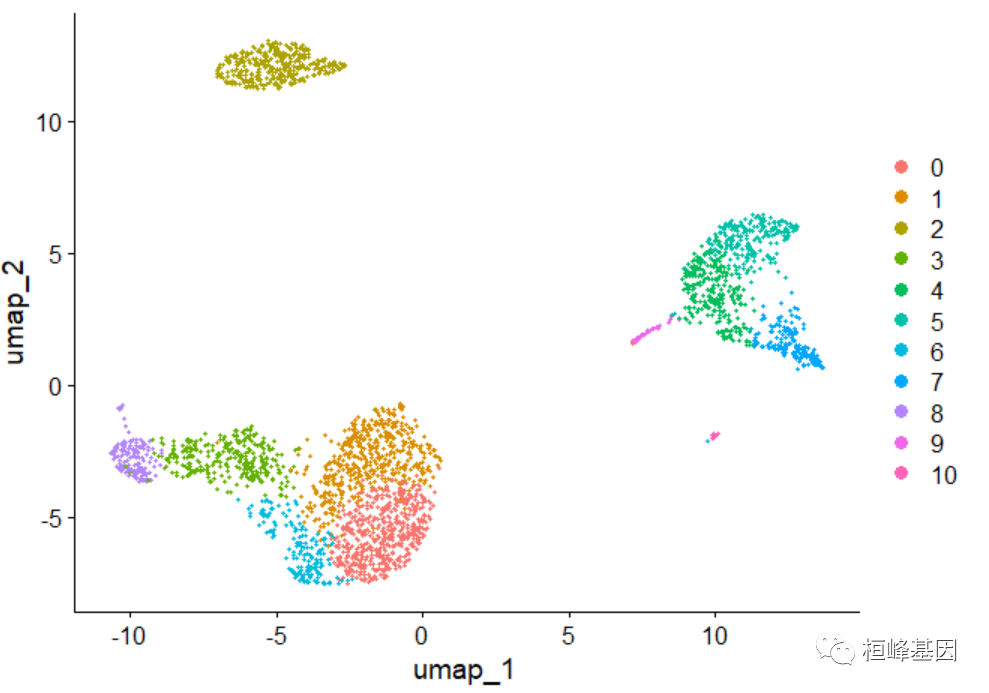
细胞类型比对
接下来,让我们从输入细胞标记文件中准备基因集。默认情况下,我们使用内置的单细胞标记DB,但是,您可以随意使用自己的数据。只需准备一个与DB文件格式相同的输入XLSX文件。DB文件应包含四列(tissueType -组织类型,cellName -细胞类型,geneSymbolmore1 -阳性标记基因,geneSymbolmore2 -不期望由细胞类型表达的标记基因)
# DB file
db_ = "./sc-type-master/ScTypeDB_full.xlsx"
tissue = "Immune system"  # e.g. Immune system,Pancreas,Liver,Eye,Kidney,Brain,Lung,Adrenal,Heart,Intestine,Muscle,Placenta,Spleen,Stomach,Thymus

# prepare gene sets
gs_list = gene_sets_prepare(db_, tissue)
最后,让我们为每个集群分配细胞类型: 这里需要注意一下,因为我是用library(Seurat) options(Seurat.object.assay.version = 'v5'),因此再提前pbmc的数据时稍有变化原始使用的是“pbmc[["RNA"]]@scale.data” ,现在改为 pbmc[["RNA"]]$scale.data就不报错,如有保存的都类似改过来即可。
# get cell-type by cell matrix
es.max = sctype_score(scRNAseqData = pbmc[["RNA"]]$scale.data, scaled = TRUE, gs = gs_list$gs_positive,
    gs2 = gs_list$gs_negative)

# NOTE: scRNAseqData parameter should correspond to your input scRNA-seq
# matrix.  In case Seurat is used, it is either pbmc[['RNA']]$scale.data
# (default), pbmc[['SCT']]$scale.data, in case sctransform is used for
# normalization, or pbmc[['integrated']]$scale.data, in case a joint analysis
# of multiple single-cell datasets is performed.

# merge by cluster
cL_resutls = do.call("rbind", lapply(unique(pbmc@meta.data$seurat_clusters), function(cl) {
    es.max.cl = sort(rowSums(es.max[, rownames(pbmc@meta.data[pbmc@meta.data$seurat_clusters ==
        cl, ])]), decreasing = !0)
    head(data.frame(cluster = cl, type = names(es.max.cl), scores = es.max.cl, ncells = sum(pbmc@meta.data$seurat_clusters ==
        cl)), 10)
}))
sctype_scores = cL_resutls %>%
    group_by(cluster) %>%
    top_n(n = 1, wt = scores)

# set low-confident (low ScType score) clusters to 'unknown'
sctype_scores$type[as.numeric(as.character(sctype_scores$scores)) < sctype_scores$ncells/4] = "Unknown"
print(sctype_scores[, 1:3])
## # A tibble: 11 × 3
## # Groups:   cluster [11]
##    cluster type                    scores
##    <fct>   <chr>                    <dbl>
##  1 1       Memory CD4+ T cells      498.
##  2 2       Naive B cells           1172.
##  3 7       Non-classical monocytes  532.
##  4 8       Natural killer  cells    631.
##  5 3       CD8+ NKT-like cells      573.
##  6 6       Naive CD8+ T cells        72.8
##  7 0       Naive CD8+ T cells       444.
##  8 4       Classical Monocytes      680.
##  9 5       Classical Monocytes      574.
## 10 9       Myeloid Dendritic cells  181.
## 11 10      Platelets                284.
我们还可以将识别的细胞类型叠加在UMAP图上:
pbmc@meta.data$customclassif = ""
for (j in unique(sctype_scores$cluster)) {
    cl_type = sctype_scores[sctype_scores$cluster == j, ]
    pbmc@meta.data$customclassif[pbmc@meta.data$seurat_clusters == j] = as.character(cl_type$type[1])
}

DimPlot(pbmc, reduction = "umap", label = TRUE, repel = TRUE, group.by = "customclassif")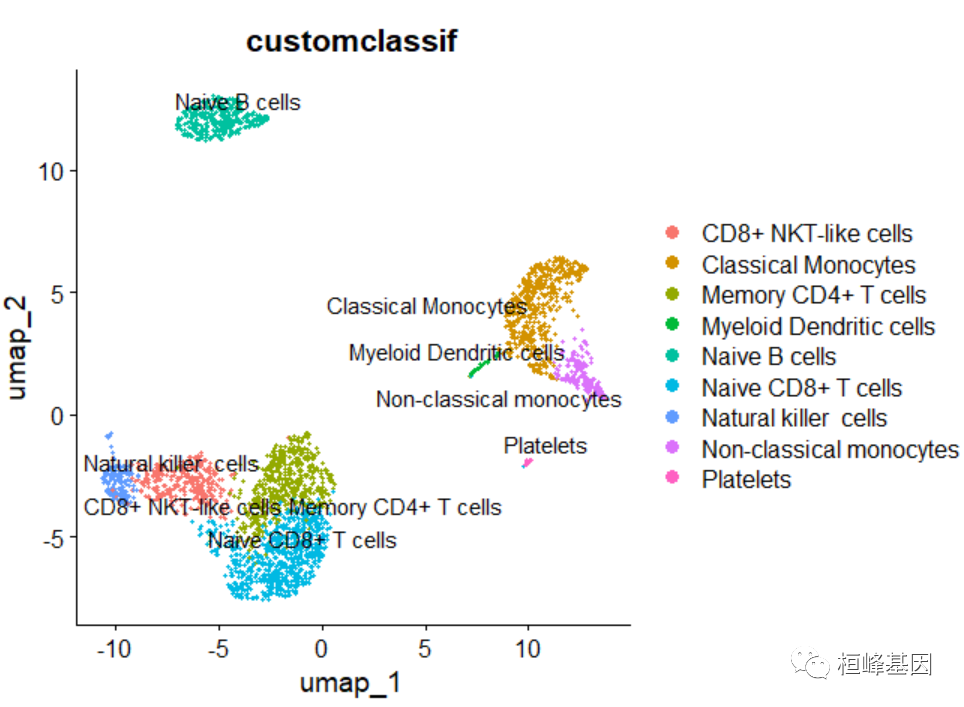
绘制气泡图
此外,还可以看到一个气泡图,显示ScType为集群注释考虑的所有单细胞类型。外部(灰色)气泡对应于每个簇(气泡越大,簇中的细胞越多),而内部气泡对应于每个簇考虑的细胞类型,最大的气泡对应于指定的细胞类型。
# load libraries
lapply(c("ggraph", "igraph", "tidyverse", "data.tree"), library, character.only = T)
## [[1]]
##  [1] "ggraph"       "ggplot2"      "Seurat"       "SeuratObject" "sp"
##  [6] "knitr"        "openxlsx"     "HGNChelper"   "dplyr"        "stats"
## [11] "graphics"     "grDevices"    "utils"        "datasets"     "methods"
## [16] "base"
##
## [[2]]
##  [1] "igraph"       "ggraph"       "ggplot2"      "Seurat"       "SeuratObject"
##  [6] "sp"           "knitr"        "openxlsx"     "HGNChelper"   "dplyr"
## [11] "stats"        "graphics"     "grDevices"    "utils"        "datasets"
## [16] "methods"      "base"
##
## [[3]]
##  [1] "lubridate"    "forcats"      "stringr"      "purrr"        "readr"
##  [6] "tidyr"        "tibble"       "tidyverse"    "igraph"       "ggraph"
## [11] "ggplot2"      "Seurat"       "SeuratObject" "sp"           "knitr"
## [16] "openxlsx"     "HGNChelper"   "dplyr"        "stats"        "graphics"
## [21] "grDevices"    "utils"        "datasets"     "methods"      "base"
##
## [[4]]
##  [1] "data.tree"    "lubridate"    "forcats"      "stringr"      "purrr"
##  [6] "readr"        "tidyr"        "tibble"       "tidyverse"    "igraph"
## [11] "ggraph"       "ggplot2"      "Seurat"       "SeuratObject" "sp"
## [16] "knitr"        "openxlsx"     "HGNChelper"   "dplyr"        "stats"
## [21] "graphics"     "grDevices"    "utils"        "datasets"     "methods"
## [26] "base"

# prepare edges
cL_resutls = cL_resutls[order(cL_resutls$cluster), ]
edges = cL_resutls
edges$type = paste0(edges$type, "_", edges$cluster)
edges$cluster = paste0("cluster ", edges$cluster)
edges = edges[, c("cluster", "type")]
colnames(edges) = c("from", "to")
rownames(edges) <- NULL

# prepare nodes
nodes_lvl1 = sctype_scores[, c("cluster", "ncells")]
nodes_lvl1$cluster = paste0("cluster ", nodes_lvl1$cluster)
nodes_lvl1$Colour = "#f1f1ef"
nodes_lvl1$ord = 1
nodes_lvl1$realname = nodes_lvl1$cluster
nodes_lvl1 = as.data.frame(nodes_lvl1)
nodes_lvl2 = c()
ccolss = c("#5f75ae", "#92bbb8", "#64a841", "#e5486e", "#de8e06", "#eccf5a", "#b5aa0f",
    "#e4b680", "#7ba39d", "#b15928", "#ffff99", "#6a3d9a", "#cab2d6", "#ff7f00",
    "#fdbf6f", "#e31a1c", "#fb9a99", "#33a02c", "#b2df8a", "#1f78b4", "#a6cee3")
for (i in 1:length(unique(cL_resutls$cluster))) {
    dt_tmp = cL_resutls[cL_resutls$cluster == unique(cL_resutls$cluster)[i], ]
    nodes_lvl2 = rbind(nodes_lvl2, data.frame(cluster = paste0(dt_tmp$type, "_",
        dt_tmp$cluster), ncells = dt_tmp$scores, Colour = ccolss[i], ord = 2, realname = dt_tmp$type))
}
nodes = rbind(nodes_lvl1, nodes_lvl2)
nodes$ncells[nodes$ncells < 1] = 1
files_db = openxlsx::read.xlsx(db_)[, c("cellName", "shortName")]
files_db = unique(files_db)
nodes = merge(nodes, files_db, all.x = T, all.y = F, by.x = "realname", by.y = "cellName",
    sort = F)
nodes$shortName[is.na(nodes$shortName)] = nodes$realname[is.na(nodes$shortName)]
nodes = nodes[, c("cluster", "ncells", "Colour", "ord", "shortName", "realname")]

mygraph <- graph_from_data_frame(edges, vertices = nodes)

# Make the graph
gggr <- ggraph(mygraph, layout = "circlepack", weight = I(ncells)) + geom_node_circle(aes(filter = ord ==
    1, fill = I("#F5F5F5"), colour = I("#D3D3D3")), alpha = 0.9) + geom_node_circle(aes(filter = ord ==
    2, fill = I(Colour), colour = I("#D3D3D3")), alpha = 0.9) + theme_void() + geom_node_text(aes(filter = ord ==
    2, label = shortName, colour = I("#ffffff"), fill = "white", repel = !1, parse = T,
    size = I(log(ncells, 25) * 1.5))) + geom_node_label(aes(filter = ord == 1, label = shortName,
    colour = I("#000000"), size = I(3), fill = "white", parse = T), repel = !0, segment.linetype = "dotted")
gggr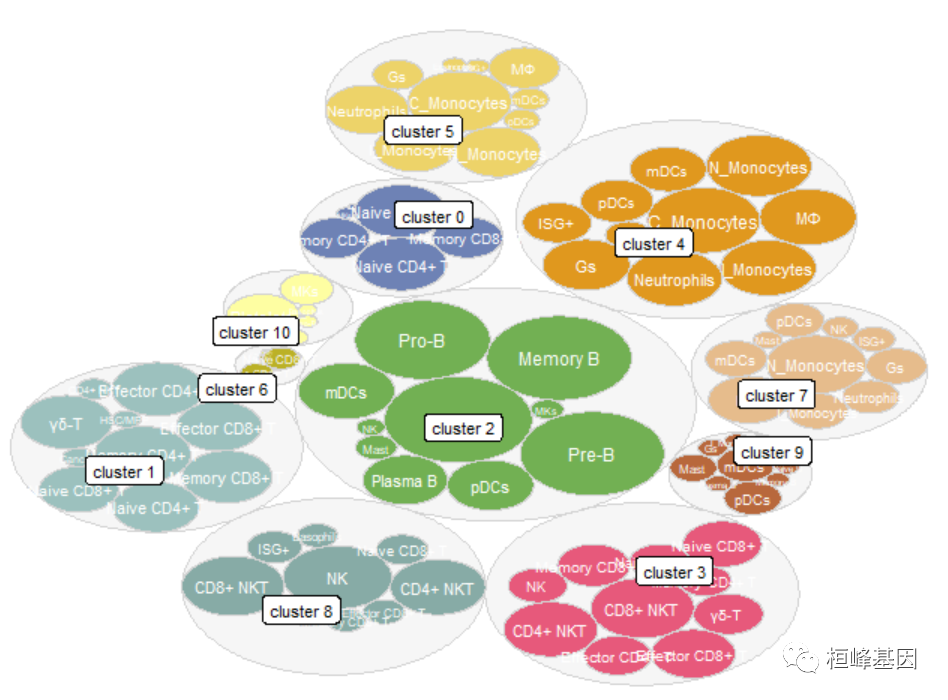
绘制聚类图
DimPlot(pbmc, reduction = "umap", label = TRUE, repel = TRUE, cols = ccolss)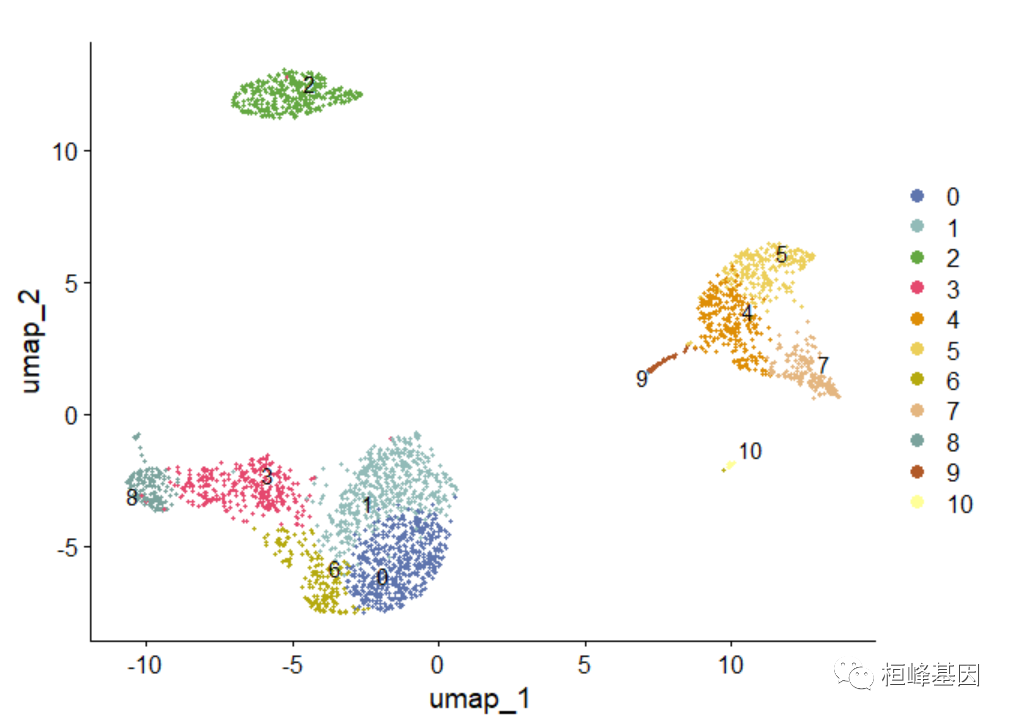
Automatically detect a tissue type of the dataset
此外,如果输入数据集的组织类型未知,ScType提供了自动猜测组织类型的功能。
# load auto-detection function
source("./sc-type-master/R/auto_detect_tissue_type.R")
db_ = "./sc-type-master/ScTypeDB_full.xlsx"

# guess a tissue type
tissue_guess = auto_detect_tissue_type(path_to_db_file = db_, seuratObject = pbmc,
    scaled = TRUE, assay = "RNA")  # if saled = TRUE, make sure the data is scaled, as seuratObject[[assay]]@scale.data is used. If you just created a Seurat object, without any scaling and normalization, set scaled = FALSE, seuratObject[[assay]]@counts will be used
## [1] "Checking...Immune system"
## [1] "Checking...Pancreas"
## [1] "Checking...Liver"
## [1] "Checking...Eye"
## [1] "Checking...Kidney"
## [1] "Checking...Brain"
## [1] "Checking...Lung"
## [1] "Checking...Adrenal"
## [1] "Checking...Heart"
## [1] "Checking...Intestine"
## [1] "Checking...Muscle"
## [1] "Checking...Placenta"
## [1] "Checking...Spleen"
## [1] "Checking...Stomach"
## [1] "Checking...Thymus"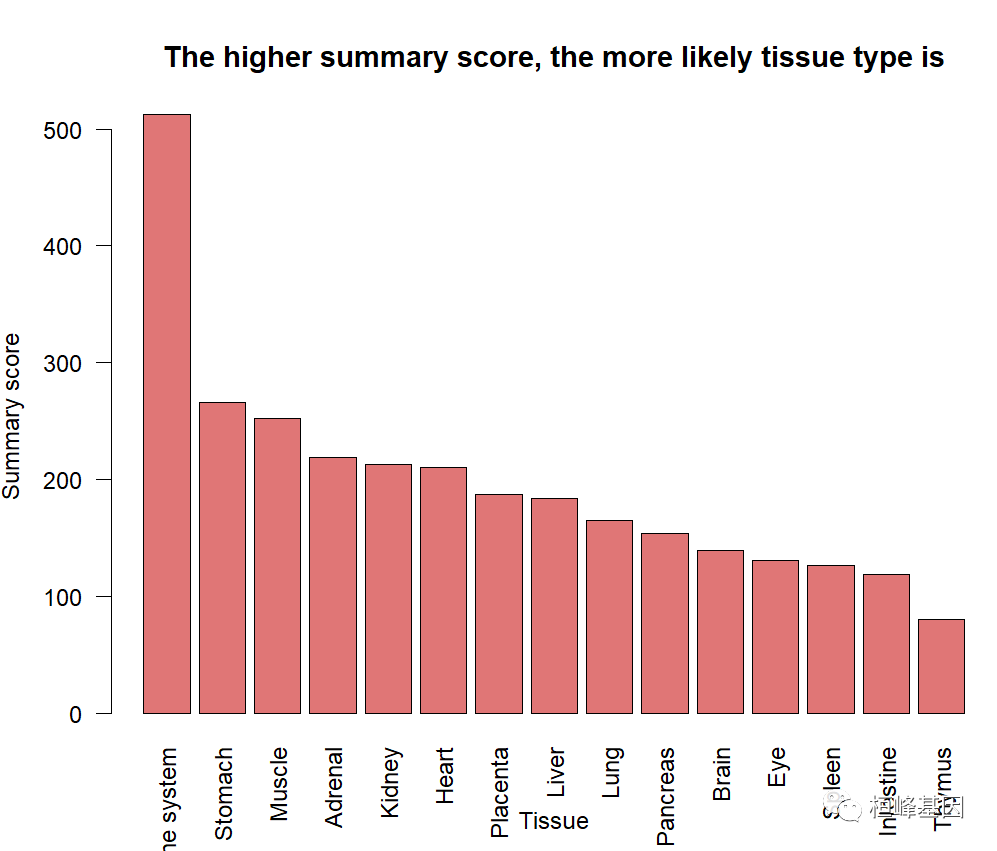
还有在线的方式,很简单,这个使用方法可以关注桓峰基因视频号,抖音,B站,搜索“桓峰基因”即可找到相应教程。
Reference
Ianevski, A., Giri, A.K. & Aittokallio, T. Fully-automated and ultra-fast cell-type identification using specific marker combinations from single-cell transcriptomic data. Nat Commun 13, 1246 (2022). https://doi.org/10.1038/s41467-022-28803-w
利用这个软件包实现了全自动化快速很快细胞类型注释,但是从rowdata开始做还是要求有一定生信分析基础的,有需求的老师可以联系桓峰基因,关注桓峰基因公众号,轻松学生信,高效发文章!
桓峰基因,铸造成功的您!
未来桓峰基因公众号将不间断的推出单细胞系列生信分析教程,
敬请期待!!
桓峰基因官网正式上线,请大家多多关注,还有很多不足之处,大家多多指正!
http://www.kyohogene.com/
桓峰基因和投必得合作,文章润色优惠85折,需要文章润色的老师可以直接到网站输入领取桓峰基因专属优惠券码:KYOHOGENE,然后上传,付款时选择桓峰基因优惠券即可享受85折优惠哦!https://www.topeditsci.com/


