文章目录
- 一:分水岭分割
- (1)原理
- (2)程序
- 二:综合案例:答题卡图像分割
- (1)设计思路
- (2)各模块设计
- (3)代码
一:分水岭分割
(1)原理
分水岭分割:图像处理中常用的一种分割方法,它基于图像中灰度或颜色的变化来划分不同的区域。分水岭分割算法的原理是基于地理学上的分水岭概念。将图像看作一个地貌图,在图像中低洼的部分被看作水池,而高处则表示山脉。通过在图像中加入水并让其逐渐充满,当水位上升到高峰时,不同山脉之间的低洼部分就形成了分割边界。其算法步骤如下
- 预处理:对原始图像进行预处理,包括去噪、平滑和增强等操作,以提高分割结果的准确性
- 标记区域:通过手动标记或自动选择一些种子像素来指定感兴趣的目标区域和背景区域。这些种子像素可以根据图像的特征进行选择,如明暗度、颜色等
- 计算距离变换:利用标记区域生成距离变换图,其中每个像素的值表示该像素到最近标记点的距离。距离变换可以将图像中的低洼区域与高处区域进行区分
- 寻找分割线:根据距离变换图,通过寻找局部最大值点和极小值点来确定分水岭线。这些分水岭线将图像分为不同的区域
- 分割结果优化:根据具体需求,可以对分割结果进行后处理操作,如合并相邻区域、去除小区域等,以得到更好的分割效果
分水岭分割方法在图像处理领域有着广泛的应用,特别适用于复杂背景下的目标提取和图像分割任务。但它也存在一些问题,例如对噪声敏感,容易产生过分割或欠分割等情况,因此在实际应用中需要结合其他方法进行改进和优化

(2)程序
如下图

matlab实现:
clear,clc,close all;
image=im2double(rgb2gray(imread('bricks.jpg')));
figure,imshow(image),title('原图');
hv=fspecial('prewitt');
hh=hv.';
gv=abs(imfilter(image,hv,'replicate'));
gh=abs(imfilter(image,hh,'replicate'));
% g=sqrt(gv.^2+gh.^2);
g=abs(gv)+abs(gh);
figure,imshow(g),title('梯度图像');
L=watershed(g);
wr=L==0;
figure,imshow(wr),title('分水岭');
image(wr)=0;
figure,imshow(image),title('分割结果');
% imwrite(g,'watergrad.jpg');
% imwrite(wr,'fenshuiling.jpg');
% imwrite(image,'waterresult.jpg');
import numpy as np
import cv2
import matplotlib.pyplot as plt

# 读取图像
image = cv2.imread('bricks.jpg')
image_gray = cv2.cvtColor(image, cv2.COLOR_BGR2GRAY)
image_gray = image_gray.astype(np.float64) / 255.0

# 显示原图
plt.figure()
plt.imshow(cv2.cvtColor(image, cv2.COLOR_BGR2RGB))
plt.title('原图')

# 计算梯度
hx = cv2.Sobel(image_gray, cv2.CV_64F, 1, 0, ksize=3)
hy = cv2.Sobel(image_gray, cv2.CV_64F, 0, 1, ksize=3)
gx = np.abs(hx)
gy = np.abs(hy)
gradient = gx + gy

# 显示梯度图像
plt.figure()
plt.imshow(gradient, cmap='gray')
plt.title('梯度图像')

# 分水岭分割
ret, markers = cv2.connectedComponents(cv2.threshold(np.uint8(gradient * 255), 0, 255, cv2.THRESH_BINARY | cv2.THRESH_OTSU)[1])
markers = markers + 1
markers[gradient == 0] = 0
labels = cv2.watershed(image, markers)
segmented = image.copy()
segmented[labels == -1] = [0, 0, 255]

# 显示分水岭结果
plt.figure()
plt.imshow(cv2.cvtColor(segmented, cv2.COLOR_BGR2RGB))
plt.title('分割结果')

plt.show()
二:综合案例:答题卡图像分割
(1)设计思路
要求:将答题卡分割成不同区域。采用所学基础处理方法实现题目要求
操作:
- 几何校正
- 裁切
- 上下区域分割
- 信息区和答题区分割
(2)各模块设计
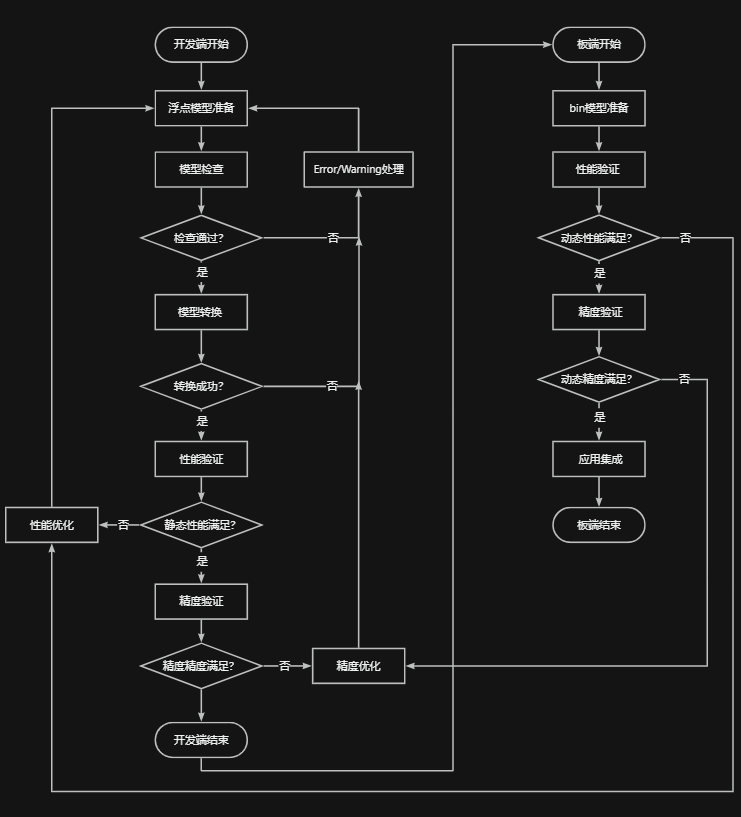
主程序

几何校正


裁切


信息区域分割:通过检测边缘来进行分割:canny边缘检测、边缘滤波、边界修复和区域定位四个步骤

答题区分割


(3)代码
    clear,clc,close all;
    RGB=im2double(imread('card1.jpg'));
    figure,imshow(RGB),title('原图');
    adjustI=correction(RGB);

    figure,imshow(adjustI),title('几何校正结果图');
    [cropIu,cropId]=crop(adjustI);

    rectup(cropIu);
    rectdown(cropId);


function out=correction(in)
    bw=prepro(in);
    lines=linedetect(bw,2);
    line1=[lines(1).point1;lines(1).point2];
    line2=[lines(2).point1;lines(2).point2];
    angle1=abs(atan((line1(2,2)-line1(1,2))/(line1(2,1)-line1(1,1)))*180/pi);
    angle2=abs(atan((line2(2,2)-line2(1,2))/(line2(2,1)-line2(1,1)))*180/pi);

    if angle1<angle2
        temp=angle1;
        angle1=angle2;
        angle2=temp;
        temp=line1;
        line1=line2;
        line2=temp;
    end
    first=line1(1,:);    second=line1(2,:);    third=line2(1,:);    fourth=line2(2,:);
    input_points=[first;second;third;fourth];

    first(2)=(first(2)+second(2))/2;    second(2)=first(2);
    third(1)=first(1);    fourth(1)=second(1);
    third(2)=(third(2)+fourth(2))/2;    fourth(2)=third(2);
    base_points=[first;second;third;fourth];

    tform=cp2tform(input_points,base_points,'projective');

    out=1-in(:,:,:);
    out=imtransform(out,tform);
    out(:,:,:)=1-out(:,:,:);
end
function out=prepro(in)
    bw=1-imbinarize(rgb2gray(in));
    se=strel('square',2);
    out=imopen(bw,se);
end
function [lines,width]=linedetect(bw,n)
    [B,L]=bwboundaries(bw);
    [N,M]=size(bw);
    STATS=regionprops(L,'MajorAxisLength','MinorAxisLength');%统计几何特征
    len=length(STATS);
    for i=1:len
        if STATS(i).MajorAxisLength<M/2 || STATS(i).MinorAxisLength>10
            L(L==i)=0;
        end
    end
    L(L~=0)=1;
    [B,L]=bwboundaries(L);
    STATS=regionprops(L,'MinorAxisLength');%统计几何特征
    len=length(STATS);
    width=0;
    for i=1:len
        width=width+STATS(i).MinorAxisLength;
    end
    width=width/len;
    [h,theta,rho]=hough(L,'RhoResolution',0.5,'ThetaResolution',0.5);
    P=houghpeaks(h,n);
    lines=houghlines(L,theta,rho,P);
end

function [out1,out2]=crop(in)
    gray=1-rgb2gray(in);
    sumy=sum(gray,2);
    sumx=sum(gray);

    avery=mean(sumy);
    averx=mean(sumx);
    posy=find(sumy>avery);
    posx=find(sumx>averx);
    [C,maxx]=max(sumx);
    out=in(posy(1)-3:posy(end),posx(1)-3:maxx,:);

    bw=prepro(out);
    [N,M]=size(bw);
    [lines,width]=linedetect(bw,2);
    line1=[lines(1).point1;lines(1).point2];
    line2=[lines(2).point1;lines(2).point2];
    if line1(1,2)>line2(1,2)
        temp=line1;
        line1=line2;
        line2=temp;
    end
    left=1;
    right=(line1(2,1)+line2(2,1))/2;
    right=floor(right+(M-right)*2/3);
    top=1;
    middle=(line1(1,2)+line1(2,2))/2;
    bottom=floor((line2(1,2)+line2(2,2))/2-width);
    out1=out(top:middle-width,left:right,:);
    out2=out(middle+width/2:bottom,left:right,:);
end

function out=rectup(in)
    out=imresize(in,2,'bilinear');
    gray=rgb2gray(out);
    bw=edge(gray,'canny');
    [B,L]=bwboundaries(bw);
    STATS=regionprops(L,'MajorAxisLength');%统计几何特征
    len=length(STATS);
    [N,M]=size(gray);
    for i=1:len
        if STATS(i).MajorAxisLength<M/8
            bw(L==i)=0;
        end
    end
    bw=restore(bw);
    bw=imfill(bw,'holes');
    se=strel('square',3);
    bw=imopen(bw,se);
    [B,L]=bwboundaries(bw);
    STATS=regionprops(L,'BoundingBox');%统计几何特征
    len=length(STATS);
    figure,imshow(out),title('个人信息区定位');
    hold on;
    for i=1:len
        rect=STATS(i).BoundingBox;
        rectangle('position',rect,'edgecolor','b');
    end
end
function out=restore(in)
    [N,M]=size(in);
    for x=2:M-1
        for y=2:N-1
            i=x;  j=y;
            while j<=N-1 && i<=M-1 && i>=2 && j>=2 && in(j,i)~=0
                neighbor=[in(j-1,i-1) in(j-1,i) in(j-1,i+1) in(j,i-1) in(j,i+1) in(j+1,i-1) in(j+1,i) in(j+1,i+1)];
                pos=find(neighbor~=0);
                if size(pos)==1
                    switch pos(1)
                        case 1
                            i=i+1;j=j+1;
                        case 2
                            j=j+1;
                        case 3
                            i=i-1;j=j+1;
                        case 4
                            i=i+1;
                        case 5
                            i=i-1;
                        case 6
                            i=i+1;j=j-1;
                        case 7
                            j=j-1;
                        case 8
                            i=i-1;j=j-1;
                    end
                    in(j,i)=1;
                else
                    break;
                end
            end
        end
    end
    out=in;
end
function out=rectdown(in)
    hsv=rgb2hsv(in);
    s=hsv(:,:,2);
    v=hsv(:,:,3);
    [N,M]=size(v);
    sbw=imbinarize(s);
    se=strel('disk',3);
    sbw=imopen(sbw,se);

    [B,L]=bwboundaries(sbw);
    STATS=regionprops(L,'Area','BoundingBox');
    len=length(STATS);
    area=[];
    for i=1:len
        area=[area;STATS(i).Area];
    end
    [Y,Index]=sort(abs(area),'descend');
    if len>3
        count=3;
    else
        count=len;
    end
    for i=1:count
        rect=STATS(Index(i)).BoundingBox;
        v(rect(2):rect(2)+rect(4),rect(1):rect(1)+rect(3))=v(1,1);
    end

    vbw=edge(v,'canny');
    [B,L]=bwboundaries(vbw);
    STATS=regionprops(L,'Area','MajorAxisLength','MinorAxisLength');%统计几何特征
    len=length(STATS);
    for i=1:len
        if STATS(i).MajorAxisLength>M/16 || STATS(i).MinorAxisLength<3 || STATS(i).Area<10
            L(L==i)=0;
        end
    end
    L(L~=0)=1;
    se=strel('line',M/25,0);
    L=imclose(L,se);
    se=strel('line',N/35,90);
    L=imclose(L,se);
    se=strel('square',3);
    L=imopen(L,se);
    L=imfill(L,'holes');
    [B,L]=bwboundaries(L);
    STATS=regionprops(L,'BoundingBox');%统计几何特征
    len=length(STATS);
    figure,imshow(in),title('答题区定位');
    hold on;
    for i=1:len
        rect=STATS(i).BoundingBox;
        rectangle('position',rect,'edgecolor','b');
    end
end







![[PyTorch][chapter 53][Auto Encoder 实战]](https://img-blog.csdnimg.cn/1f4a5174a09a4374a2a8935c457ec996.png)
