vmagent
使用以下命令添加图表 helm 存储库:
helm repo add vm https://victoriametrics.github.io/helm-charts/

helm repo update
列出vm/victoria-metrics-agent可供安装的图表版本:
helm search repo vm/victoria-metrics-agent -l
victoria-metrics-agent将图表的默认值导出到文件values.yaml:
mkdir vmagent
cd vmagent/

helm show values vm/victoria-metrics-agent > values.yaml
根据环境需要更改values.yaml文件中的值。
# Default values for victoria-metrics-agent.
# This is a YAML-formatted file.
# Declare variables to be passed into your templates.

replicaCount: 1


# ref: https://kubernetes.io/docs/concepts/workloads/controllers/deployment/
deployment:
  enabled: true
  # ref: https://kubernetes.io/docs/concepts/workloads/controllers/deployment/#strategy
  strategy: {}
   # rollingUpdate:
   #  maxSurge: 25%
   #  maxUnavailable: 25%
   # type: RollingUpdate

# ref:  https://kubernetes.io/docs/concepts/workloads/controllers/statefulset/
statefulset:
  enabled: false
  # ref: https://kubernetes.io/docs/concepts/workloads/controllers/statefulset/#update-strategies
  updateStrategy: {}
    # type: RollingUpdate


image:
  repository: victoriametrics/vmagent
  tag: "" # rewrites Chart.AppVersion
  pullPolicy: IfNotPresent

imagePullSecrets: []
nameOverride: ""
fullnameOverride: ""

containerWorkingDir: "/"

rbac:
  create: true
  pspEnabled: true
  annotations: {}
  extraLabels: {}

serviceAccount:
  # Specifies whether a service account should be created
  create: true
  # Annotations to add to the service account
  annotations: {}
  # The name of the service account to use.
  # If not set and create is true, a name is generated using the fullname template
  name:

## See `kubectl explain poddisruptionbudget.spec` for more
## ref: https://kubernetes.io/docs/tasks/run-application/configure-pdb/
podDisruptionBudget:
  enabled: false
  # minAvailable: 1
  # maxUnavailable: 1
  labels: {}

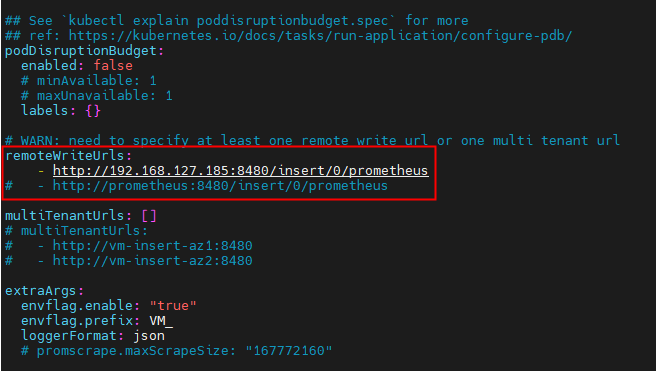
# WARN: need to specify at least one remote write url or one multi tenant url
remoteWriteUrls:
    - http://192.168.127.185:8480/insert/0/prometheus
#   - http://prometheus:8480/insert/0/prometheus

multiTenantUrls: []
# multiTenantUrls:
#   - http://vm-insert-az1:8480
#   - http://vm-insert-az2:8480

extraArgs:
  envflag.enable: "true"
  envflag.prefix: VM_
  loggerFormat: json
  # promscrape.maxScrapeSize: "167772160"

  # Uncomment and specify the port if you want to support any of the protocols:
  # https://victoriametrics.github.io/vmagent.html#features
  # graphiteListenAddr: ":2003"
  # influxListenAddr: ":8189"
  # opentsdbHTTPListenAddr: ":4242"
  # opentsdbListenAddr: ":4242"

# -- Additional environment variables (ex.: secret tokens, flags) https://github.com/VictoriaMetrics/VictoriaMetrics#environment-variables
env:
  []
  # - name: VM_remoteWrite_basicAuth_password
  #   valueFrom:
  #     secretKeyRef:
  #       name: auth_secret
  #       key: password

# extra Labels for Pods, Deployment and Statefulset
extraLabels: {}

# extra Labels for Pods only
podLabels: {}

# Additional hostPath mounts
extraHostPathMounts:
  []
  # - name: certs-dir
  #   mountPath: /etc/kubernetes/certs
  #   subPath: ""
  #   hostPath: /etc/kubernetes/certs
  #   readOnly: true

# Extra Volumes for the pod
extraVolumes:
  []
  # - name: example
  #   configMap:
  #     name: example

# Extra Volume Mounts for the container
extraVolumeMounts:
  []
  # - name: example
  #   mountPath: /example

extraContainers: []
#   - name: config-reloader
#     image: reloader-image

podSecurityContext:
  {}
  # fsGroup: 2000

securityContext:
  {}
  # capabilities:
  #   drop:
  #   - ALL
  # readOnlyRootFilesystem: true
  # runAsNonRoot: true
  # runAsUser: 1000

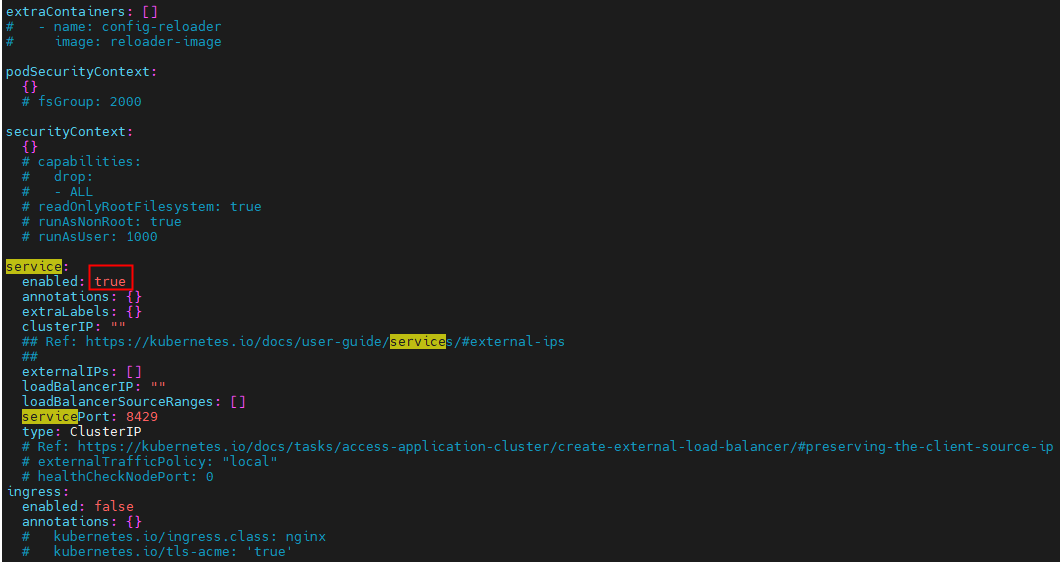
service:
  enabled: true
  annotations: {}
  extraLabels: {}
  clusterIP: ""
  ## Ref: https://kubernetes.io/docs/user-guide/services/#external-ips
  ##
  externalIPs: []
  loadBalancerIP: ""
  loadBalancerSourceRanges: []
  servicePort: 8429
  type: ClusterIP
  # Ref: https://kubernetes.io/docs/tasks/access-application-cluster/create-external-load-balancer/#preserving-the-client-source-ip
  # externalTrafficPolicy: "local"
  # healthCheckNodePort: 0
ingress:
  enabled: false
  annotations: {}
  #   kubernetes.io/ingress.class: nginx
  #   kubernetes.io/tls-acme: 'true'

  extraLabels: {}
  hosts: []
  #   - name: vmagent.local
  #     path: /
  #     port: http
  tls: []
  #   - secretName: vmagent-ingress-tls
  #     hosts:
  #       - vmagent.local
  # For Kubernetes >= 1.18 you should specify the ingress-controller via the field ingressClassName
  # See https://kubernetes.io/blog/2020/04/02/improvements-to-the-ingress-api-in-kubernetes-1.18/#specifying-the-class-of-an-ingress
  # ingressClassName: nginx
  # -- pathType is only for k8s >= 1.1=
  pathType: Prefix
resources:
  {}
  # We usually recommend not to specify default resources and to leave this as a conscious
  # choice for the user. This also increases chances charts run on environments with little
  # resources, such as Minikube. If you do want to specify resources, uncomment the following
  # lines, adjust them as necessary, and remove the curly braces after 'resources:'.
  # limits:
  #   cpu: 100m
  #   memory: 128Mi
  # requests:
  #   cpu: 100m
  #   memory: 128Mi

# Annotations to be added to the deployment
annotations: {}

# Annotations to be added to pod
podAnnotations: {}

nodeSelector: {}

tolerations: []

affinity: {}

# vmagent scraping configuration:
# https://github.com/VictoriaMetrics/VictoriaMetrics/blob/master/docs/vmagent.md#how-to-collect-metrics-in-prometheus-format

# use existing configmap if specified
# otherwise .config values will be used
configMap: ""

# -- priority class to be assigned to the pod(s)
priorityClassName: ""

serviceMonitor:
  enabled: false
  extraLabels: {}
  annotations: {}
#    interval: 15s
#    scrapeTimeout: 5s
  # -- Commented. HTTP scheme to use for scraping.
#    scheme: https
  # -- Commented. TLS configuration to use when scraping the endpoint
#    tlsConfig:
#      insecureSkipVerify: true

persistence:
  enabled: false
  # storageClassName: default
  accessModes:
    - ReadWriteOnce
  size: 10Gi
  annotations: {}
  extraLabels: {}
  existingClaim: ""
  # -- Bind Persistent Volume by labels. Must match all labels of targeted PV.
  matchLabels: {}

config:
  global:
    scrape_interval: 10s

  # scrape self by default
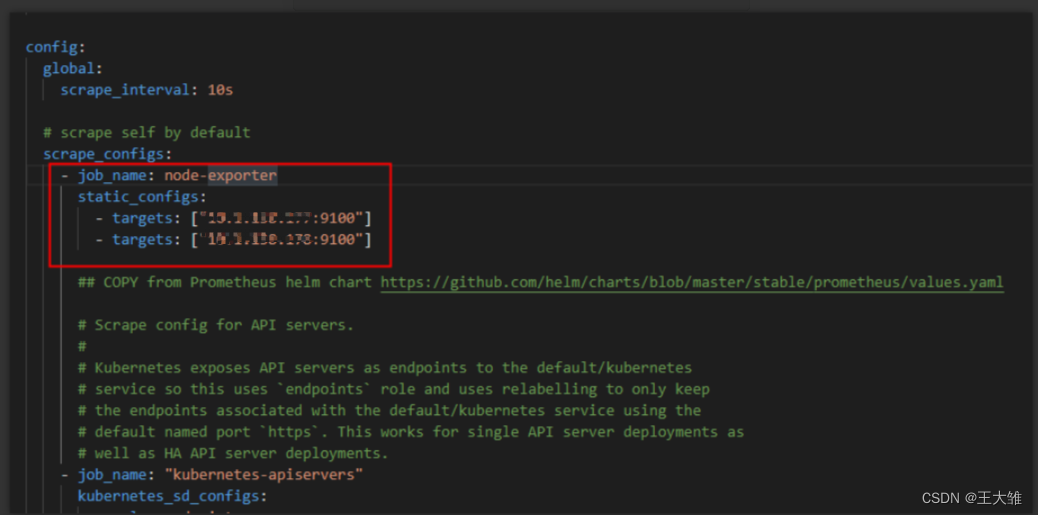
  scrape_configs:
    - job_name: node-exporter
      static_configs:
        - targets: ["10.1.138.177:9100"]
        - targets: ["10.1.138.178:9100"]

      ## COPY from Prometheus helm chart https://github.com/helm/charts/blob/master/stable/prometheus/values.yaml

      # Scrape config for API servers.
      #
      # Kubernetes exposes API servers as endpoints to the default/kubernetes
      # service so this uses `endpoints` role and uses relabelling to only keep
      # the endpoints associated with the default/kubernetes service using the
      # default named port `https`. This works for single API server deployments as
      # well as HA API server deployments.
    - job_name: "kubernetes-apiservers"
      kubernetes_sd_configs:
        - role: endpoints
      # Default to scraping over https. If required, just disable this or change to
      # `http`.
      scheme: https
      # This TLS & bearer token file config is used to connect to the actual scrape
      # endpoints for cluster components. This is separate to discovery auth
      # configuration because discovery & scraping are two separate concerns in
      # Prometheus. The discovery auth config is automatic if Prometheus runs inside
      # the cluster. Otherwise, more config options have to be provided within the
      # <kubernetes_sd_config>.
      tls_config:
        ca_file: /var/run/secrets/kubernetes.io/serviceaccount/ca.crt
        # If your node certificates are self-signed or use a different CA to the
        # master CA, then disable certificate verification below. Note that
        # certificate verification is an integral part of a secure infrastructure
        # so this should only be disabled in a controlled environment. You can
        # disable certificate verification by uncommenting the line below.
        #
        insecure_skip_verify: true
      bearer_token_file: /var/run/secrets/kubernetes.io/serviceaccount/token
      # Keep only the default/kubernetes service endpoints for the https port. This
      # will add targets for each API server which Kubernetes adds an endpoint to
      # the default/kubernetes service.
      relabel_configs:
        - source_labels:
            [
              __meta_kubernetes_namespace,
              __meta_kubernetes_service_name,
              __meta_kubernetes_endpoint_port_name,
            ]
          action: keep
          regex: default;kubernetes;https
    - job_name: "kubernetes-nodes"
      # Default to scraping over https. If required, just disable this or change to
      # `http`.
      scheme: https
      # This TLS & bearer token file config is used to connect to the actual scrape
      # endpoints for cluster components. This is separate to discovery auth
      # configuration because discovery & scraping are two separate concerns in
      # Prometheus. The discovery auth config is automatic if Prometheus runs inside
      # the cluster. Otherwise, more config options have to be provided within the
      # <kubernetes_sd_config>.
      tls_config:
        ca_file: /var/run/secrets/kubernetes.io/serviceaccount/ca.crt
        # If your node certificates are self-signed or use a different CA to the
        # master CA, then disable certificate verification below. Note that
        # certificate verification is an integral part of a secure infrastructure
        # so this should only be disabled in a controlled environment. You can
        # disable certificate verification by uncommenting the line below.
        #
        insecure_skip_verify: true
      bearer_token_file: /var/run/secrets/kubernetes.io/serviceaccount/token
      kubernetes_sd_configs:
        - role: node
      relabel_configs:
        - action: labelmap
          regex: __meta_kubernetes_node_label_(.+)
        - target_label: __address__
          replacement: kubernetes.default.svc:443
        - source_labels: [__meta_kubernetes_node_name]
          regex: (.+)
          target_label: __metrics_path__
          replacement: /api/v1/nodes/$1/proxy/metrics
    - job_name: "kubernetes-nodes-cadvisor"
      # Default to scraping over https. If required, just disable this or change to
      # `http`.
      scheme: https
      # This TLS & bearer token file config is used to connect to the actual scrape
      # endpoints for cluster components. This is separate to discovery auth
      # configuration because discovery & scraping are two separate concerns in
      # Prometheus. The discovery auth config is automatic if Prometheus runs inside
      # the cluster. Otherwise, more config options have to be provided within the
      # <kubernetes_sd_config>.
      tls_config:
        ca_file: /var/run/secrets/kubernetes.io/serviceaccount/ca.crt
        # If your node certificates are self-signed or use a different CA to the
        # master CA, then disable certificate verification below. Note that
        # certificate verification is an integral part of a secure infrastructure
        # so this should only be disabled in a controlled environment. You can
        # disable certificate verification by uncommenting the line below.
        #
        insecure_skip_verify: true
      bearer_token_file: /var/run/secrets/kubernetes.io/serviceaccount/token
      kubernetes_sd_configs:
        - role: node
      # This configuration will work only on kubelet 1.7.3+
      # As the scrape endpoints for cAdvisor have changed
      # if you are using older version you need to change the replacement to
      # replacement: /api/v1/nodes/$1:4194/proxy/metrics
      # more info here https://github.com/coreos/prometheus-operator/issues/633
      relabel_configs:
        - action: labelmap
          regex: __meta_kubernetes_node_label_(.+)
        - target_label: __address__
          replacement: kubernetes.default.svc:443
        - source_labels: [__meta_kubernetes_node_name]
          regex: (.+)
          target_label: __metrics_path__
          replacement: /api/v1/nodes/$1/proxy/metrics/cadvisor

    # Scrape config for service endpoints.
    #
    # The relabeling allows the actual service scrape endpoint to be configured
    # via the following annotations:
    #
    # * `prometheus.io/scrape`: Only scrape services that have a value of `true`
    # * `prometheus.io/scheme`: If the metrics endpoint is secured then you will need
    # to set this to `https` & most likely set the `tls_config` of the scrape config.
    # * `prometheus.io/path`: If the metrics path is not `/metrics` override this.
    # * `prometheus.io/port`: If the metrics are exposed on a different port to the
    # service then set this appropriately.
    - job_name: "kubernetes-service-endpoints"
      kubernetes_sd_configs:
        - role: endpoints
      relabel_configs:
        - action: drop
          source_labels: [__meta_kubernetes_pod_container_init]
          regex: true
        - action: keep_if_equal
          source_labels: [__meta_kubernetes_service_annotation_prometheus_io_port, __meta_kubernetes_pod_container_port_number]
        - source_labels:
            [__meta_kubernetes_service_annotation_prometheus_io_scrape]
          action: keep
          regex: true
        - source_labels:
            [__meta_kubernetes_service_annotation_prometheus_io_scheme]
          action: replace
          target_label: __scheme__
          regex: (https?)
        - source_labels:
            [__meta_kubernetes_service_annotation_prometheus_io_path]
          action: replace
          target_label: __metrics_path__
          regex: (.+)
        - source_labels:
            [
              __address__,
              __meta_kubernetes_service_annotation_prometheus_io_port,
            ]
          action: replace
          target_label: __address__
          regex: ([^:]+)(?::\d+)?;(\d+)
          replacement: $1:$2
        - action: labelmap
          regex: __meta_kubernetes_service_label_(.+)
        - source_labels: [__meta_kubernetes_namespace]
          action: replace
          target_label: kubernetes_namespace
        - source_labels: [__meta_kubernetes_service_name]
          action: replace
          target_label: kubernetes_name
        - source_labels: [__meta_kubernetes_pod_node_name]
          action: replace
          target_label: kubernetes_node
    # Scrape config for slow service endpoints; same as above, but with a larger
    # timeout and a larger interval
    #
    # The relabeling allows the actual service scrape endpoint to be configured
    # via the following annotations:
    #
    # * `prometheus.io/scrape-slow`: Only scrape services that have a value of `true`
    # * `prometheus.io/scheme`: If the metrics endpoint is secured then you will need
    # to set this to `https` & most likely set the `tls_config` of the scrape config.
    # * `prometheus.io/path`: If the metrics path is not `/metrics` override this.
    # * `prometheus.io/port`: If the metrics are exposed on a different port to the
    # service then set this appropriately.
    - job_name: "kubernetes-service-endpoints-slow"
      scrape_interval: 5m
      scrape_timeout: 30s
      kubernetes_sd_configs:
        - role: endpoints
      relabel_configs:
        - action: drop
          source_labels: [__meta_kubernetes_pod_container_init]
          regex: true
        - action: keep_if_equal
          source_labels: [__meta_kubernetes_service_annotation_prometheus_io_port, __meta_kubernetes_pod_container_port_number]
        - source_labels:
            [__meta_kubernetes_service_annotation_prometheus_io_scrape_slow]
          action: keep
          regex: true
        - source_labels:
            [__meta_kubernetes_service_annotation_prometheus_io_scheme]
          action: replace
          target_label: __scheme__
          regex: (https?)
        - source_labels:
            [__meta_kubernetes_service_annotation_prometheus_io_path]
          action: replace
          target_label: __metrics_path__
          regex: (.+)
        - source_labels:
            [
              __address__,
              __meta_kubernetes_service_annotation_prometheus_io_port,
            ]
          action: replace
          target_label: __address__
          regex: ([^:]+)(?::\d+)?;(\d+)
          replacement: $1:$2
        - action: labelmap
          regex: __meta_kubernetes_service_label_(.+)
        - source_labels: [__meta_kubernetes_namespace]
          action: replace
          target_label: kubernetes_namespace
        - source_labels: [__meta_kubernetes_service_name]
          action: replace
          target_label: kubernetes_name
        - source_labels: [__meta_kubernetes_pod_node_name]
          action: replace
          target_label: kubernetes_node
    # Example scrape config for probing services via the Blackbox Exporter.
    #
    # The relabeling allows the actual service scrape endpoint to be configured
    # via the following annotations:
    #
    # * `prometheus.io/probe`: Only probe services that have a value of `true`
    - job_name: "kubernetes-services"
      metrics_path: /probe
      params:
        module: [http_2xx]
      kubernetes_sd_configs:
        - role: service
      relabel_configs:
        - source_labels:
            [__meta_kubernetes_service_annotation_prometheus_io_probe]
          action: keep
          regex: true
        - source_labels: [__address__]
          target_label: __param_target
        - target_label: __address__
          replacement: blackbox
        - source_labels: [__param_target]
          target_label: instance
        - action: labelmap
          regex: __meta_kubernetes_service_label_(.+)
        - source_labels: [__meta_kubernetes_namespace]
          target_label: kubernetes_namespace
        - source_labels: [__meta_kubernetes_service_name]
          target_label: kubernetes_name
    # Example scrape config for pods
    #
    # The relabeling allows the actual pod scrape endpoint to be configured via the
    # following annotations:
    #
    # * `prometheus.io/scrape`: Only scrape pods that have a value of `true`
    # * `prometheus.io/path`: If the metrics path is not `/metrics` override this.
    # * `prometheus.io/port`: Scrape the pod on the indicated port instead of the default of `9102`.
    - job_name: "kubernetes-pods"
      kubernetes_sd_configs:
        - role: pod
      relabel_configs:
        - action: drop
          source_labels: [__meta_kubernetes_pod_container_init]
          regex: true
        - action: keep_if_equal
          source_labels: [__meta_kubernetes_pod_annotation_prometheus_io_port, __meta_kubernetes_pod_container_port_number]
        - source_labels: [__meta_kubernetes_pod_annotation_prometheus_io_scrape]
          action: keep
          regex: true
        - source_labels: [__meta_kubernetes_pod_annotation_prometheus_io_path]
          action: replace
          target_label: __metrics_path__
          regex: (.+)
        - source_labels:
            [__address__, __meta_kubernetes_pod_annotation_prometheus_io_port]
          action: replace
          regex: ([^:]+)(?::\d+)?;(\d+)
          replacement: $1:$2
          target_label: __address__
        - action: labelmap
          regex: __meta_kubernetes_pod_label_(.+)
        - source_labels: [__meta_kubernetes_namespace]
          action: replace
          target_label: kubernetes_namespace
        - source_labels: [__meta_kubernetes_pod_name]
          action: replace
          target_label: kubernetes_pod_name
      ## End of COPY

# -- Extra scrape configs that will be appended to `config`
extraScrapeConfigs: []


使用命令测试安装:
helm install vmagent vm/victoria-metrics-agent -f values.yaml -n victoria-metrics --debug --dry-run
使用命令安装:
helm install vmagent vm/victoria-metrics-agent -f values.yaml -n victoria-metrics
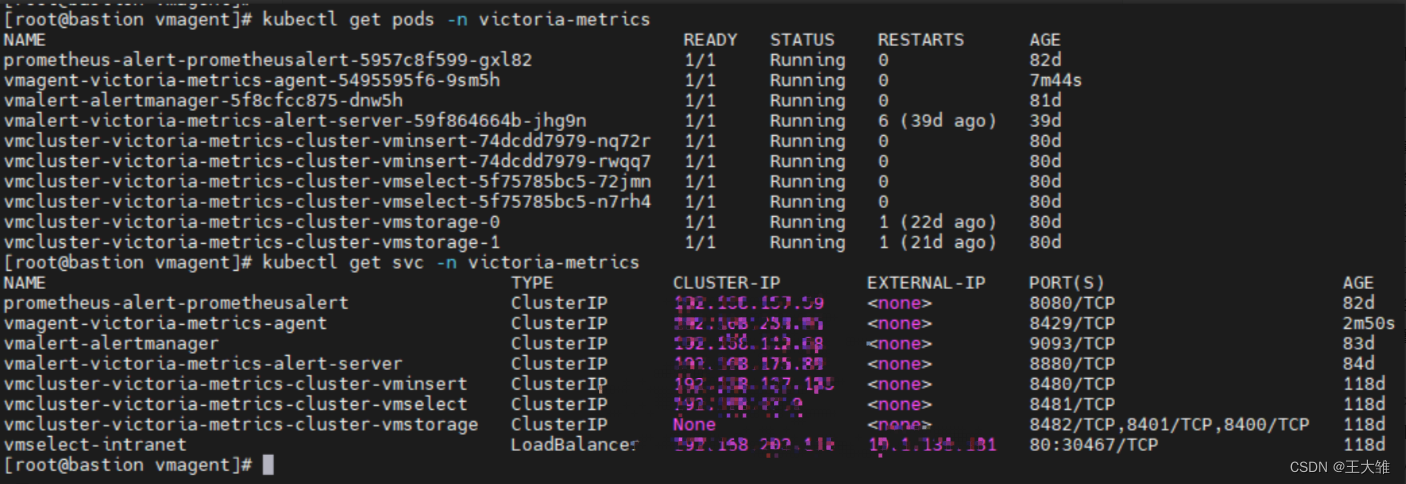
通过运行以下命令获取 pod 列表:
kubectl get pods -A | grep 'agent'
通过运行以下命令获取应用程序:
helm list -f vmagent -n victoria-metrics
使用命令查看应用程序版本的历史记录vmagent。
helm history vmagent -n victoria-metrics
更新配置
cd vmagent/
#修改value.yaml文件
helm upgrade vmagent vm/victoria-metrics-agent -f values.yaml -n victoria-metrics

vmgent deployment
[root@bastion ci-test]# kubectl get deploy vmagent-victoria-metrics-agent -n victoria-metrics -o yaml
apiVersion: apps/v1
kind: Deployment
metadata:
  annotations:
    deployment.kubernetes.io/revision: "6"
    meta.helm.sh/release-name: vmagent
    meta.helm.sh/release-namespace: victoria-metrics
  creationTimestamp: "2022-06-22T05:53:42Z"
  generation: 6
  labels:
    app.kubernetes.io/instance: vmagent
    app.kubernetes.io/managed-by: Helm
    app.kubernetes.io/name: victoria-metrics-agent
    app.kubernetes.io/version: v1.78.0
    helm.sh/chart: victoria-metrics-agent-0.8.8
  name: vmagent-victoria-metrics-agent
  namespace: victoria-metrics
  resourceVersion: "64544377"
  uid: 964ad1c5-8e52-4173-8cdd-4c138845f9c9
spec:
  progressDeadlineSeconds: 600
  replicas: 1
  revisionHistoryLimit: 10
  selector:
    matchLabels:
      app.kubernetes.io/instance: vmagent
      app.kubernetes.io/name: victoria-metrics-agent
  strategy:
    rollingUpdate:
      maxSurge: 25%
      maxUnavailable: 25%
    type: RollingUpdate
  template:
    metadata:
      annotations:
        checksum/config: 05df4ae3a0ba0f3719e0e0be1197216ea9c8d5a9f12fdb211b0aea2af9d24d8c
      creationTimestamp: null
      labels:
        app.kubernetes.io/instance: vmagent
        app.kubernetes.io/name: victoria-metrics-agent
    spec:
      containers:
      - args:
        - -promscrape.config=/config/scrape.yml
        - -remoteWrite.tmpDataPath=/tmpData
        - -remoteWrite.url=http://192.168.127.185:8480/insert/0/prometheus
        - -envflag.enable=true
        - -envflag.prefix=VM_
        - -loggerFormat=json
        image: victoriametrics/vmagent:v1.83.0
        imagePullPolicy: IfNotPresent
        livenessProbe:
          failureThreshold: 3
          initialDelaySeconds: 5
          periodSeconds: 15
          successThreshold: 1
          tcpSocket:
            port: http
          timeoutSeconds: 5
        name: victoria-metrics-agent
        ports:
        - containerPort: 8429
          name: http
          protocol: TCP
        readinessProbe:
          failureThreshold: 3
          httpGet:
            path: /health
            port: http
            scheme: HTTP
          initialDelaySeconds: 5
          periodSeconds: 15
          successThreshold: 1
          timeoutSeconds: 1
        resources: {}
        securityContext: {}
        terminationMessagePath: /dev/termination-log
        terminationMessagePolicy: File
        volumeMounts:
        - mountPath: /tmpData
          name: tmpdata
        - mountPath: /config
          name: config
        workingDir: /
      dnsPolicy: ClusterFirst
      restartPolicy: Always
      schedulerName: default-scheduler
      securityContext: {}
      serviceAccount: vmagent-victoria-metrics-agent
      serviceAccountName: vmagent-victoria-metrics-agent
      terminationGracePeriodSeconds: 30
      volumes:
      - emptyDir: {}
        name: tmpdata
      - configMap:
          defaultMode: 420
          name: vmagent-victoria-metrics-agent-config
        name: config
status:
  availableReplicas: 1
  conditions:
  - lastTransitionTime: "2022-06-22T06:28:44Z"
    lastUpdateTime: "2022-11-02T02:35:05Z"
    message: ReplicaSet "vmagent-victoria-metrics-agent-75d9758b9f" has successfully
      progressed.
    reason: NewReplicaSetAvailable
    status: "True"
    type: Progressing
  - lastTransitionTime: "2022-11-02T09:55:33Z"
    lastUpdateTime: "2022-11-02T09:55:33Z"
    message: Deployment has minimum availability.
    reason: MinimumReplicasAvailable
    status: "True"
    type: Available
  observedGeneration: 6
  readyReplicas: 1
  replicas: 1
  updatedReplicas: 1
node-exporter
使用以下命令添加 helm chart存储库
helm repo add prometheus-community https://prometheus-community.github.io/helm-charts
helm repo update
列出vm/victoria-metrics-agent可供安装的图表版本:
helm search repo prometheus-community/prometheus-node-exporter -l
victoria-metrics-agent将图表的默认值导出到文件values.yaml:
mkdir node-exporter
cd node-exporter/

helm show values prometheus-community/prometheus-node-exporter > values.yaml
根据环境需要更改values.yaml文件中的值。
# Default values for prometheus-node-exporter.
# This is a YAML-formatted file.
# Declare variables to be passed into your templates.
image:
  repository: quay.io/prometheus/node-exporter
  # Overrides the image tag whose default is {{ printf "v%s" .Chart.AppVersion }}
  tag: ""
  pullPolicy: IfNotPresent

imagePullSecrets: []
# - name: "image-pull-secret"

service:
  type: ClusterIP
  port: 9100
  targetPort: 9100
  nodePort:
  portName: metrics
  listenOnAllInterfaces: true
  annotations:
    prometheus.io/scrape: "true"

# Additional environment variables that will be passed to the daemonset
env: {}
##  env:
##    VARIABLE: value

prometheus:
  monitor:
    enabled: false
    additionalLabels: {}
    namespace: ""

    jobLabel: ""

    scheme: http
    basicAuth: {}
    bearerTokenFile:
    tlsConfig: {}

    ## proxyUrl: URL of a proxy that should be used for scraping.
    ##
    proxyUrl: ""

    ## Override serviceMonitor selector
    ##
    selectorOverride: {}

    relabelings: []
    metricRelabelings: []
    interval: ""
    scrapeTimeout: 10s

## Customize the updateStrategy if set
updateStrategy:
  type: RollingUpdate
  rollingUpdate:
    maxUnavailable: 1

resources: {}
  # We usually recommend not to specify default resources and to leave this as a conscious
  # choice for the user. This also increases chances charts run on environments with little
  # resources, such as Minikube. If you do want to specify resources, uncomment the following
  # lines, adjust them as necessary, and remove the curly braces after 'resources:'.
  # limits:
  #   cpu: 200m
  #   memory: 50Mi
  # requests:
  #   cpu: 100m
  #   memory: 30Mi

serviceAccount:
  # Specifies whether a ServiceAccount should be created
  create: true
  # The name of the ServiceAccount to use.
  # If not set and create is true, a name is generated using the fullname template
  name:
  annotations: {}
  imagePullSecrets: []
  automountServiceAccountToken: false

securityContext:
  fsGroup: 65534
  runAsGroup: 65534
  runAsNonRoot: true
  runAsUser: 65534

containerSecurityContext: {}
  # capabilities:
  #   add:
  #   - SYS_TIME

rbac:
  ## If true, create & use RBAC resources
  ##
  create: true
  ## If true, create & use Pod Security Policy resources
  ## https://kubernetes.io/docs/concepts/policy/pod-security-policy/
  pspEnabled: true
  pspAnnotations: {}

# for deployments that have node_exporter deployed outside of the cluster, list
# their addresses here
endpoints: []

# Expose the service to the host network
hostNetwork: true

# Share the host process ID namespace
hostPID: true

# Mount the node's root file system (/) at /host/root in the container
hostRootFsMount:
  enabled: true
  # Defines how new mounts in existing mounts on the node or in the container
  # are propagated to the container or node, respectively. Possible values are
  # None, HostToContainer, and Bidirectional. If this field is omitted, then
  # None is used. More information on:
  # https://kubernetes.io/docs/concepts/storage/volumes/#mount-propagation
  mountPropagation: HostToContainer

## Assign a group of affinity scheduling rules
##
affinity: {}
#   nodeAffinity:
#     requiredDuringSchedulingIgnoredDuringExecution:
#       nodeSelectorTerms:
#         - matchFields:
#             - key: metadata.name
#               operator: In
#               values:
#                 - target-host-name

# Annotations to be added to node exporter pods
podAnnotations:
  # Fix for very slow GKE cluster upgrades
  cluster-autoscaler.kubernetes.io/safe-to-evict: "true"

# Extra labels to be added to node exporter pods
podLabels: {}

# Custom DNS configuration to be added to prometheus-node-exporter pods
dnsConfig: {}
# nameservers:
#   - 1.2.3.4
# searches:
#   - ns1.svc.cluster-domain.example
#   - my.dns.search.suffix
# options:
#   - name: ndots
#     value: "2"
#   - name: edns0

## Assign a nodeSelector if operating a hybrid cluster
##
nodeSelector: {}
#   beta.kubernetes.io/arch: amd64
#   beta.kubernetes.io/os: linux

tolerations:
  - effect: NoSchedule
    operator: Exists

## Assign a PriorityClassName to pods if set
# priorityClassName: ""

## Additional container arguments
##
extraArgs: []
#   - --collector.diskstats.ignored-devices=^(ram|loop|fd|(h|s|v)d[a-z]|nvme\\d+n\\d+p)\\d+$
#   - --collector.textfile.directory=/run/prometheus

## Additional mounts from the host
##
extraHostVolumeMounts: []
#  - name: <mountName>
#    hostPath: <hostPath>
#    mountPath: <mountPath>
#    readOnly: true|false
#    mountPropagation: None|HostToContainer|Bidirectional

## Additional configmaps to be mounted.
##
configmaps: []
# - name: <configMapName>
#   mountPath: <mountPath>
secrets: []
# - name: <secretName>
#   mountPath: <mountPatch>
## Override the deployment namespace
##
namespaceOverride: ""

## Additional containers for export metrics to text file
##
sidecars: []
##  - name: nvidia-dcgm-exporter
##    image: nvidia/dcgm-exporter:1.4.3

## Volume for sidecar containers
##
sidecarVolumeMount: []
##  - name: collector-textfiles
##    mountPath: /run/prometheus
##    readOnly: false

## Additional InitContainers to initialize the pod
##
extraInitContainers: []

## Liveness probe
##
livenessProbe:
  failureThreshold: 3
  httpGet:
    httpHeaders: []
    scheme: http
  initialDelaySeconds: 0
  periodSeconds: 10
  successThreshold: 1
  timeoutSeconds: 1

## Readiness probe
##
readinessProbe:
  failureThreshold: 3
  httpGet:
    httpHeaders: []
    scheme: http
  initialDelaySeconds: 0
  periodSeconds: 10
  successThreshold: 1
  timeoutSeconds: 1
测试安装
helm install node-exporter prometheus-community/prometheus-node-exporter -f values.yaml -n victoria-metrics --debug --dry-run
安装
helm install node-exporter prometheus-community/prometheus-node-exporter -f values.yaml -n victoria-metrics
更新配置
cd node-exporter/
#修改value.yaml文件
helm upgrade node-exporter prometheus-community/prometheus-node-exporter -f values.yaml -n victoria-metrics

