客户流失
它是指现有的客户、用户、订阅者或任何类型的回头客停止与公司开展业务或结束与公司的关系。
客户流失的类型
- 合同客户流失:当客户签订了服务合同并决定取消服务时,例如有线电视,SaaS。
- 自愿流失:当用户自愿取消服务时,例如手机连接。
- 非合同流失:当客户未签订服务合同并决定取消服务时,例如零售商店中的消费者忠诚度。
- 非自愿流失:当客户在没有任何请求的情况下发生流失时,例如信用卡过期。
自愿流失的原因
- 缺乏使用
- 服务差
- 更优惠的价格
导入电信客户流失数据集
# Import required libraries
import numpy as np
import pandas as pd

# Import the dataset
dataset = pd.read_csv('telcochurndata.csv')

# Glance at the first five records
dataset.head()

# Print all the features of the data
dataset.columns


电信客户流失数据集的探索性数据分析
查找数据集中的流失者和非流失者的数量:
# Churners vs Non-Churners
dataset['Churn'].value_counts()

按流失率对数据进行分组并计算平均值,以确定流失者是否比非流失者拨打更多的客户服务电话:
# Group data by 'Churn' and compute the mean
print(dataset.groupby('Churn')['Customer service calls'].mean())

好耶!也许不足为奇的是,流失者似乎比非流失者打更多的客户服务电话。
找出一个州是否比另一个州有更多的流失者。
# Count the number of churners and non-churners by State
print(dataset.groupby('State')['Churn'].value_counts())
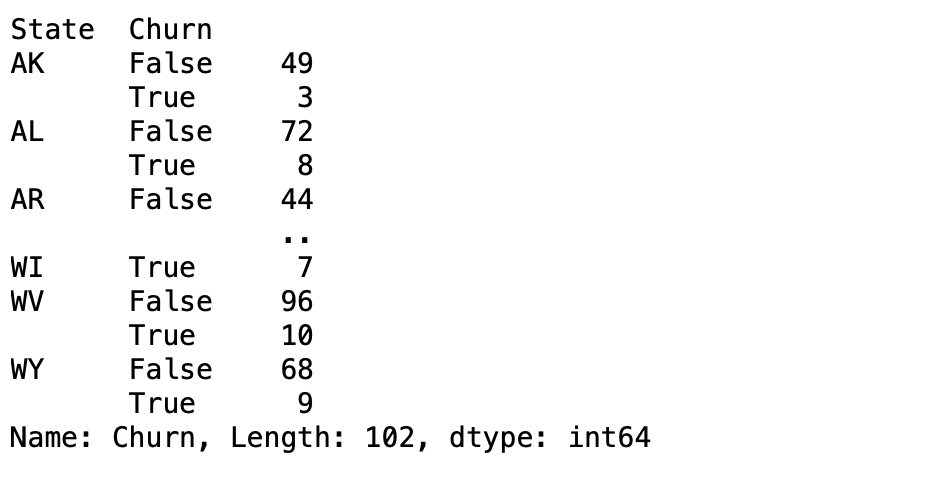
虽然California 是美国人口最多的州,但在我们的数据集中,来自California 的客户并不多。例如,Arizona (AZ)有64个客户,其中4个最终流失。相比之下,California有更高数量(和百分比)的客户流失。这对一个公司来说是非常有用的信息。
探索数据可视化:了解变量如何分布
# Import matplotlib and seaborn
import matplotlib.pyplot as plt
import seaborn as sns

# Visualize the distribution of 'Total day minutes'
plt.hist(dataset['Total day minutes'], bins = 100)

# Display the plot
plt.show()
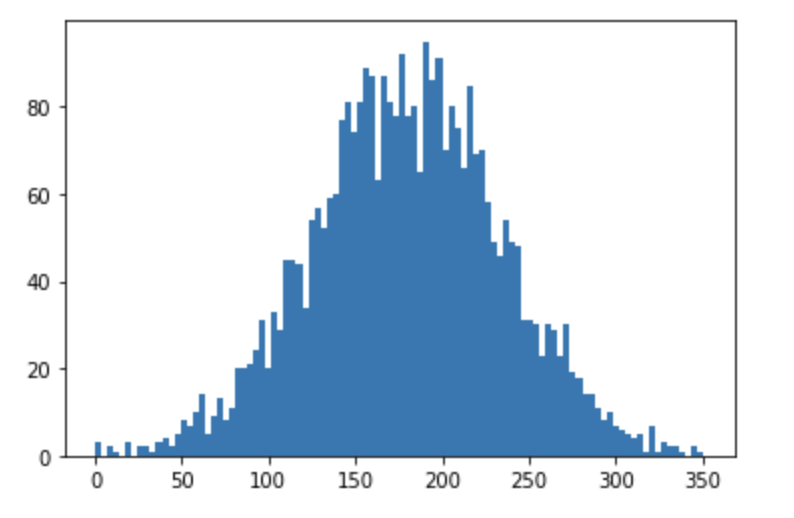
可视化客户流失者和非流失者之间的客户服务呼叫差异
# Create the box plot
sns.boxplot(x = 'Churn',
            y = 'Customer service calls',
            data = dataset,
            sym = "",
            hue = "International plan")
# Display the plot
plt.show()
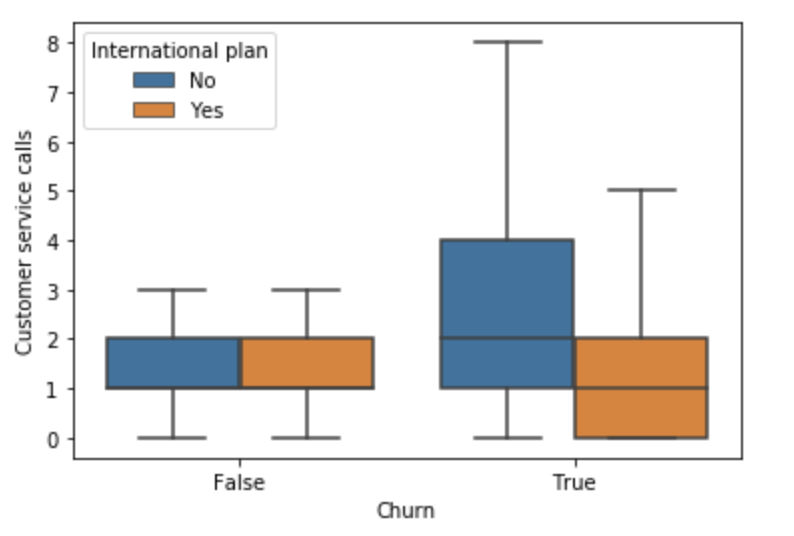
看起来那些确实流失的客户最终会留下更多的客户服务电话,除非这些客户也有国际计划,在这种情况下,他们留下更少的客户服务电话。这种类型的信息对于更好地理解客户流失的驱动因素非常有用。现在是时候学习如何在建模之前预处理数据了。
电信客户流失数据的预处理
许多机器学习模型对数据如何分布做出了某些假设。其中一些假设如下:
- 特征呈正态分布
- 特征的比例相同
- 特征的数据类型为数值
在电信公司流失数据中,Churn, Voice mail plan和International plan是二进制特征,可以很容易地转换为0和1。
# Features and Labels
X = dataset.iloc[:, 0:19].values
y = dataset.iloc[:, 19].values # Churn

# Encoding categorical data in X
from sklearn.preprocessing import LabelEncoder

labelencoder_X_1 = LabelEncoder()
X[:, 3] = labelencoder_X_1.fit_transform(X[:, 3])

labelencoder_X_2 = LabelEncoder()
X[:, 4] = labelencoder_X_2.fit_transform(X[:, 4])

# Encoding categorical data in y
labelencoder_y = LabelEncoder()
y = labelencoder_y.fit_transform(y)
使用One hot encoding的编码状态功能
# Removing extra column to avoid dummy variable trap
X_State = pd.get_dummies(X[:, 0], drop_first = True)

# Converting X to a dataframe
X = pd.DataFrame(X)

# Dropping the 'State' column
X = X.drop([0], axis = 1)

# Merging two dataframes
frames = [X_State, X]
result = pd.concat(frames, axis = 1, ignore_index = True)

# Final dataset with all numeric features
X = result
创建训练集和测试集
# Splitting the dataset into the Training and Test sets
from sklearn.model_selection import train_test_split
X_train, X_test, y_train, y_test = train_test_split(X, y,
                                                    test_size = 0.2,
                                                    random_state = 0)
缩放训练集和测试集的特征
# Feature Scaling
from sklearn.preprocessing import StandardScaler
sc = StandardScaler()
X_train = sc.fit_transform(X_train)
X_test = sc.transform(X_test)
在训练集上训练随机森林分类模型
# Import RandomForestClassifier
from sklearn.ensemble import RandomForestClassifier

# Instantiate the classifier
clf = RandomForestClassifier()

# Fit to the training data
clf.fit(X_train, y_train)
预测
# Predict the labels for the test set
y_pred = clf.predict(X_test)
评估模型性能
# Compute accuracy
from sklearn.metrics import accuracy_score

accuracy_score(y_test, y_pred)

混淆矩阵
from sklearn.metrics import confusion_matrix
print(confusion_matrix(y_test, y_pred))

从混淆矩阵中,我们可以计算以下度量:
- 真阳性(TP)= 51
- 真阴性(TN)= 575
- 假阳性(FP)= 4
- 假阴性(FN)= 37
- 精确率= TP/(TP+FP)= 0.92
- 召回= TP/(TP+FN)= 0.57
- 准确度=(TP+TN)/(TP+TN+FP+FN)= 0.9385


