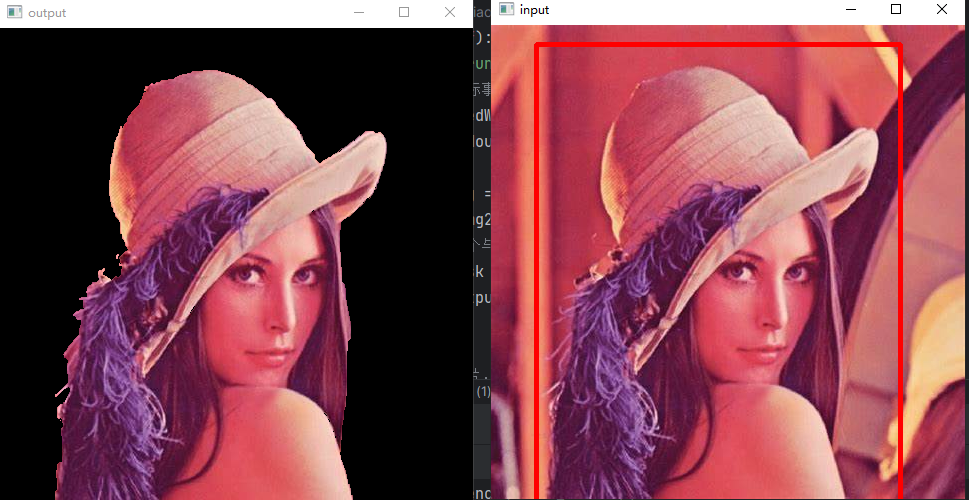
工作原理为:首先对大众淡水鱼图片进行数据清洗并做标签分类,之后基于残差网络ResNet50模型进行有监督的分类识别训练,获取识别模型。其次通过搭建回归模型设计出体重模型,对每一类淡水鱼分别拟合出对应的回归方程,将获取的某类淡水鱼轮廓面积与质量间的数据集合并为新数据集,之后对此类淡水鱼进行轮廓面积与质量间的深度学习回归训练,最终拟合出此类淡水鱼类的体重回归方程;最后在使用时当鱼类经过摄影区时获取较为完整的鱼类平面图,将获取到的鱼类图像进行背景模糊、自适应分割、轮廓标记等方式获取鱼类轮廓,通过搭建的识别模型获得此鱼类种类后做类别标记并计算轮廓面积,最终通过此类淡水鱼的类别去使用特有的体重模型获取此个体的质量。
分类识别模型训练中总共使用了32种淡水鱼,总计9253张图片,微调清洗后投入6120张图片,各类淡水鱼识别率达到95%以上,其中亚洲鲈鱼识别率为100%。体重模型以亚洲鲈鱼为例,此课题拟合了445份质量与轮廓面面积数据,最终计算体重偏差多数小于5%。
使用经典的ResNet-50作为预训练模型来Finetune,对32种淡水鱼类进行分类,由于样品数量较大,随机抽取样品进行迁移学习,测试结果准确率100%。并做鱼类重量计算。
1.Fish数据集
实验材料包括三份淡水鱼数据,第一份为来自爱发电社区的淡水鱼数据集,包含 30 类约 3000 张淡水鱼图片。 第二份为“FishImgDataset”,来自著名数据集网站“kaggle”,分为 31 个种类大约 8000 多张日常生活中常见的淡水鱼图片。 第三份为“BarraRulerDataset445-master”,完整保存了 445 份鲈鱼的原始照片以及其体重数据。
2.本实验的任务
本实践选取32种鱼类数据随机抽取数据进行迁移学习训练。 由于个别样品数量大,使微调时长变长,微调也不需要这么多样本,因此对超过200个的样品进行随机抽样,抽样200个,然后和样品数量少于200的样品合并,组成新的数据集,然后在新的数据集里随机抽样形成训练集、测试集、验证集,数据无重复,使用使用pandas 的进行数据处理,过程优雅大方。,最后Finetune训练及预测结果的输出。
3.经典的ResNet-50作为预训练模型
使用经典的ResNet-50作为预训练模型来Finetune,对32种淡水鱼类进行分类,由于样品数量较大,随机抽取样品进行迁移学习,测试结果准确率高。
查看当前挂载的数据集目录, 该目录下的变更重启环境后会自动还原
# View dataset directory. This directory will be recovered automatically after resetting environment.
!ls /home/aistudio/data
查看工作区文件, 该目录下的变更将会持久保存. 请及时清理不必要的文件, 避免加载过慢.
# View personal work directory. All changes under this directory will be kept even after reset. Please clean unnecessary files in time to speed up environment loading.
!ls /home/aistudio/work
如果需要进行持久化安装, 需要使用持久化路径, 如下方代码示例:
# If a persistence installation is required, you need to use the persistence path as the following:
!mkdir /home/aistudio/external-libraries码片
同时添加如下代码, 这样每次环境(kernel)启动的时候只要运行下方代码即可:
# Also add the following code, so that every time the environment (kernel) starts, just run the following code:
import sys
CPU环境启动请务必执行该指令
%set_env CPU_NUM=2 代码片
安装paddlehub
!pip install paddlehub==1.6.0 -i https://pypi.tuna.tsinghua.edu.cn/simple
!hub install ernie
import os
import pandas as pd #用列表生成 DataFrame,便于到出text文档。
import numpy as np
import matplotlib.pyplot as plt
from PIL import Image, ImageDraw, ImageFont #显示图片
```python
!mkdir data/fish_pic
4.解压数据
!unzip -o picture/last.zip -d picture/newfish
!unzip -o data/data212523/data.zip -d data/fish_pic
5.制作数据准备函数。
5.1 32种鱼类对应的学名
生成类别用于结果判定。
fish_name=['Bangus',
 'Big Head Carp',
 'Black Spotted Barb',
 'Catfish',
 'Climbing Perch',
 'Fourfinger Threadfin',
 'Freshwater Eel',
 'Glass Perchlet',
 'Goby',
 'Gold Fish',
 'Gourami',
 'Grass Carp',
 'Green Spotted Puffer',
 'Indian Carp',
 'Indo-Pacific Tarpon',
 'Jaguar Gapote',
 'Janitor Fish',
 'Knifefish',
 'Long-Snouted Pipefish',
 'Mosquito Fish',
 'Mudfish',
 'Mullet',
 'Pangasius',
 'Perch',
 'Scat Fish',
 'Silver Barb',
 'Silver Carp',
 'Silver Perch',
 'Snakehead',
 'Tenpounder',
 'Tilapia',
 'bass'
 ]
fish_name
5.2 生成鱼类名字字典、标签字典
name_list=[]   #生成标签文档
with open ('data/label_list.txt','w+') as f:
    for i in range(1,33):
        name_list.append('fish_'+str(i))
        f.write('fish_'+str(i)+'\n')

name_dict={b:a for a,b in enumerate(name_list)}
name_dict
real_name={a:b for a,b in zip(name_list,fish_name)}
real_name
5.3 生成图片路径和标签列表对应的字典 ,用于生成DataFrame
#此函数生成包括路径和标签的字典,可以直接生成DataFrame,后面是用路径列表生成DataFrame.
# def data_list():
#     path="data/fish_pic/fish_data/fish_image23" #图片所在文件夹
#     address_list = []   #图片地址列表
#     label_list = []     #标签列表
#     for root, dirs, files in os.walk(path, topdown=False):
#         for name in files:
#             address = os.path.join(root, name) #获取图片路径
#             address_list.append(address)
#             label = address.split('/')[4]      #路径分割后,截取目录名即为标记名,开始的时候大脑里转的是map,lambda,还是apply!一直出不来 为啥我不早点想出来呢,
#             label_list.append(name_dict.get(label)) #截取目录名对应的标注
#     return {'address':address_list,'label':label_list} #生成字典
# data_list()
5.4 生成图片路径列表 ,用于生成DataFrame
#生成图片路径列表
def data_list():
    path="data/fish_pic/fish_data/fish_image23" #图片所在文件夹
    path_list = []   #图片地址列表
    for root, dirs, files in os.walk(path, topdown=False):
        for name in files:
            path = os.path.join(root, name) #获取图片路径
            path_list.append(path)
    return path_list #生成路径列表
#data_list()
5.5 用列表生成 DataFrame,便于到出text文档。
df = pd.DataFrame(data_list(),columns=['filepath'])     #生成数据框。
df['filepath'] = df.filepath.str[5:]                     #按要求产生相对路径。只要工作目录下的相对路径 。
df['label']=df.filepath.apply(lambda x:x.split('/')[3]).map(name_dict) #用映射生成标签df.head()
5.6 简单出个图确认前面的工作是否正常。
grouped=df.label.value_counts() #查看样品分布情况
type(grouped)
plt.rcParams['font.sans-serif']=['SimHei'] #用来正常显示中文标签
plt.rcParams['axes.unicode_minus']=False #用来正常显示负号
plt.figure(figsize=(10,2))

# 这里是调节横坐标的倾斜度,rotation是度数,以及设置刻度字体大小
plt.xticks(rotation=45,fontsize=10)
plt.yticks(fontsize=10)
plt.title('''Fish Category''',fontsize = 20)
plt.bar(grouped.index,grouped,color='r',tick_label=name_list,facecolor='#9999ff',edgecolor='white')
plt.savefig('/home/aistudio/work/bar_result.jpg')
# 可见我们数据很不整齐,全部投入使用吃力不讨好,因此,考虑随机抽样参与训练。
例:

5.7 通过分析 样品个数大于两百的分类情况。
grouped[grouped.values>200].sum() #
grouped[grouped.values<200].sum()
5.8 随机采样,形成新的数据集
由于个别样品数量大,使微调时长边长,微调也不需要这么多样本,因此对超过200个的样品进行随机抽样,抽样200个,然后和样品数量少于200的样品合并,组成新的数据集,进行后续的Finetune训练。
1、先找出样品个数大于200样品标签。
2、提取样品数量少于200个的样品,形成新的数据集。
3、从样品个数多于200个的品类种随机抽取200样品,加入到上述数据集。
4、最后共获得6120个样品的数据集。

label_index = grouped[grouped.values>200].index # 样品数量大于200个标签值(label标签对应的 值)

extract=df.loc[~df['label'].isin(label_index)] #取非,样品数少于200的样品,全作为工作样品,
for i in label_index:
    #d=df.loc[df['label']==i].sample(200)
    d=df[df['label']==i].sample(200)           #样品数量大于200个的样品随机抽取200个作为工作样品。
    extract=extract.append(d)                  #分别补充至
len( extract)
#新数据的数据分布。
grouped=extract.label.value_counts() #样本数量统计
#plt.bar(grouped.index,grouped)
plt.figure(figsize=(10,2))
plt.title('''New Fish Category''',fontsize = 20)
grouped.plot(kind='bar')
<matplotlib.axes._subplots.AxesSubplot at 0x7f935138c890>
/opt/conda/envs/python35-paddle120-env/lib/python3.7/site-packages/matplotlib/font_manager.py:1331: UserWarning: findfont: Font family ['sans-serif'] not found. Falling back to DejaVu Sans
  (prop.get_family(), self.defaultFamily[fontext]))
例:

5.9 样品列表生成,关键操作
样品数据框随机打乱,按9:1比例随机生成 测试集、验证集、训练集列表文档。
df_new=extract.copy()                      #样品数据框随机打乱,按9:1比例生成 测试集,验证集,训练集列表文档。
df_new = df_new.sample(frac=1.0)           #打乱数据
df_validate = df_new.sample(frac=0.1)  #取同数量样本作为验证集
df_new.drop(index=df_validate.index,inplace=True) #去除测试集
df_test = df_new.sample(20)                          #随机抽取20个样本作为测试集
df_train = df_new.drop(index=df_test.index)         #剩下的为训练集
len(df_train.index)
5.10 生成数据列表文件
df_test['filepath'] = 'data/'+df_test['filepath'] #测试集已跳出 深度学习微调环境需要补充完整路径,是个坑。
#df_test.to_csv('data/test_list.txt', sep=' ', index=0,header=0) #导出 验证集列表
df_validate.to_csv('data/validate_list.txt', sep=' ', index=0,header=0) #导出 验证集列表
df_train.to_csv('data/train_list.txt', sep=' ', index=0,header=0) #导出 训练集列表
我们来看看 我们数据图片都长什么样子的。
import matplotlib.pyplot as plt
from PIL import Image, ImageDraw, ImageFont
test_img = df_test.sample(1)['filepath'].tolist()[0]  #我们就从测试集里面先抽一张出来看看(提取路径)

img = Image.open(test_img).resize((256,256)) # 放大来看看!
print(img.format,img.size)		 # 输出图片基本信息

# draw = ImageDraw.Draw(img)
# font=ImageFont.truetype('simhei.ttf',30)
# draw.text((20,20),'正确',(100,000,100), font=font)
plt.figure(figsize=(10,10))
plt.imshow(img)
6. 基于ResNet50,去组建适合于我们本次实验的My_ResNet50残差网络
1.选取ResNet_50的V2般本作为模型引入。
2.进行数据引入,即将我们之前设计的txt文件引入。
3.生成数据读取器。
4.调整适合的配置
5.微调原ResNet模型为二分类模型
6.训练迭代
7.预测
8.导出结果列表
import paddlehub as hub
6.1 模型引入
#resnet50要远好于其它的类型,在训练时表现更稳定,收敛更快。损失值相比较的话,resnet50更少一点,所以要较好一些。若是较为复杂数据集情况下可以选择resnet152
#在本次实验中resnet152训练较慢且准确度大约处于70%,而resnet50训练速度较快且识别的准确率在90%以上。
#同时resnet50还有“v1”、“v1.5”、“v2”版本,v2的表现最好
module = hub.Module(name="resnet_v2_50_imagenet")
# module = hub.Module(name="resnet_v2_18_imagenet")
# module = hub.Module(name="resnet_v2_34_imagenet")
# module = hub.Module(name="resnet_v2_101_imagenet")
#module = hub.Module(name="resnet_v2_152_imagenet")
6.2 数据准备
着需要加载图片数据集。我们使用自定义的数据进行体验
from paddlehub.dataset.base_cv_dataset import BaseCVDataset

class DemoDataset(BaseCVDataset):
   def __init__(self):
       # 数据集存放位置

       self.dataset_dir = "data"
       super(DemoDataset, self).__init__(
           base_path=self.dataset_dir,
           train_list_file="train_list.txt",
           validate_list_file="validate_list.txt",
           #test_list_file="test_list.txt",
           label_list_file="label_list.txt",
           )
dataset = DemoDataset()
!unzip -oq /home/aistudio/data/data212523/data.zip
6.3 生成数据读取器
接着生成一个图像分类的reader,reader负责将dataset的数据进行预处理,接着以特定格式组织并输入给模型进行训练。
当我们生成一个图像分类的reader时,需要指定输入图片的大小。
ata_reader = hub.reader.ImageClassificationReader(
    image_width=module.get_expected_image_width(),
    image_height=module.get_expected_image_height(),
    images_mean=module.get_pretrained_images_mean(),
    images_std=module.get_pretrained_images_std(),
    dataset=dataset)
6.4 调整适合的配置
在进行Finetune前,我们可以设置一些运行时的配置,例如如下代码中的配置,表示:
use_cuda:设置为False表示使用CPU进行训练。如果您本机支持GPU,且安装的是GPU版本的PaddlePaddle,我们建议您将这个选项设置为True;
epoch:迭代轮数;
batch_size:每次训练的时候,给模型输入的每批数据大小为32,模型训练时能够并行处理批数据,因此batch_size越大,训练的效率越高,但是同时带来了内存的负荷,过大的batch_size可能导致内存不足而无法训练,因此选择一个合适的batch_size是很重要的一步;
log_interval:每隔10 step打印一次训练日志;
eval_interval:每隔50 step在验证集上进行一次性能评估;
checkpoint_dir:将训练的参数和数据保存到cv_finetune_turtorial_demo目录中;
strategy:使用DefaultFinetuneStrategy策略进行finetune;
更多运行配置,请查看RunConfig
同时PaddleHub提供了许多优化策略,如AdamWeightDecayStrategy、ULMFiTStrategy、DefaultFinetuneStrategy等,详细信息参见策略
config = hub.RunConfig(
    use_cuda= True,                              #是否使用GPU训练,默认为False,高级算力环境用True,cpu环境写True会报错;
    num_epoch=5,                                #Fine-tune的轮数,cpu 环境用3玩玩就好,高级算力可以试试10;
    checkpoint_dir="cv_finetune_turtorial_demo",#模型checkpoint保存路径, 若用户没有指定,程序会自动生成;
    batch_size=3,                              #训练的批大小,如果使用GPU,请根据实际情况调整batch_size;
    #eval_interval=10,
    log_interval=20,                         #模型评估的间隔,默认每100个step评估一次验证集;
    strategy=hub.finetune.strategy.DefaultFinetuneStrategy())  #Fine-tune优化策略;
6.5 组建Finetune Task,微调原ResNet模型为二分类模型
有了合适的预训练模型和准备要迁移的数据集后,我们开始组建一个Task。 由于该数据设置是一个二分类的任务,而我们下载的分类module是在ImageNet数据集上训练的千分类模型,所以我们需要对模型进行简单的微调,把模型改造为一个二分类模型: 获取module的上下文环境,包括输入和输出的变量,以及Paddle Program; 从输出变量中找到特征图提取层feature_map; 在feature_map后面接入一个全连接层,生成Task;
input_dict, output_dict, program = module.context(trainable=True)
img = input_dict["image"]
feature_map = output_dict["feature_map"]
feed_list = [img.name]

task = hub.ImageClassifierTask(
    data_reader=data_reader,
    feed_list=feed_list,
    feature=feature_map,
    num_classes=dataset.num_labels,
    config=config)
6.6 开始训练迭代
我们选择finetune_and_eval接口来进行模型训练,这个接口在finetune的过程中,会周期性的进行模型效果的评估,以便我们了解整个训练过程的性能变化。
run_states = task.finetune_and_eval()
6.7 预测
当Finetune完成后,我们使用模型来进行预测,先通过以下命令来获取测试的图片
import numpy as np
import matplotlib.pyplot as plt
import matplotlib.image as mpimg
import pandas as pd
from PIL import ImageEnhance
#开始时清除上次遗留下来的文件保存值
Notee=open('data/jisuan.txt',mode='a')
Notee.truncate(0)

with open("zhongliang/test.txt","r") as f:
    filepath = f.readlines()

data =[filepath[i].split(" ")[0] for i in range(10)]
#print("22222222222222222",data)

label_map = dataset.label_dict()
index = 0
run_states = task.predict(data=data)
results = [run_state.run_results for run_state in run_states]
address_dict={}
# address=[]
# label=[]
#打开文件“jisuan.txt”,用于保存得到的结果(仅仅数字)
Note=open('data/jisuan.txt',mode='a')
for batch_result in results:
    print("6666",batch_result)
    batch_result = np.argmax(batch_result, axis=2)[0]
    print("7777",batch_result)
    for result in batch_result:
        index += 1
        dataw = 1+int(result)
        Note.write(str(dataw))   #写数据,将识别的鱼类序号记录起来
        Note.write("\n")
        result = label_map[result]
        address_dict[data[index - 1]] = result
        # address.append(data[index - 1])
        # label.append(result)
        print("input %i is %s, and the predict result is %s" %
              (index, data[index - 1], result))

        if data[index - 1].split('/')[4]== result:
            print('识别正确')
            plt.figure(dpi=150)
            test_img = data[index - 1]  #提取路径
            img = Image.open(test_img).resize((256,256))
            img=ImageEnhance.Contrast(img).enhance(5)
            txt=real_name.get(result)
            plt.title('Name: '+txt)
            # draw = ImageDraw.Draw(img)*
            # font=ImageFont.truetype('simhei.ttf',10)*
            # draw.text((20,20),txt,(0,0,0), font=font)*
            plt.imshow(img)
        else:
            print('识别不正确')
6.8 最后还可导出结果列表
import pandas as pd
df=pd.DataFrame.from_dict(address_dict,orient='index')
df =  df.reset_index()
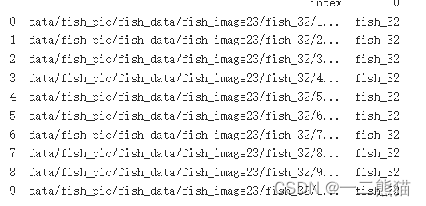
print(df)
df.columns=['addr','lab']
df.to_csv('data/result.txt',sep=' ',index=0,header=0)  #导出结果,跟test_list比较下,是否一致。
# pip install scikit-image
! pip install scikit-image -i http://pypi.douban.com/simple --trusted-host pypi.douban.com
# ! pip install scikit-image
7. 以下为获取k,b系数,以及计算需要计算的鱼质量
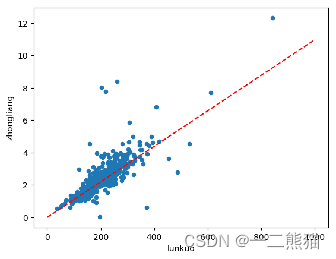
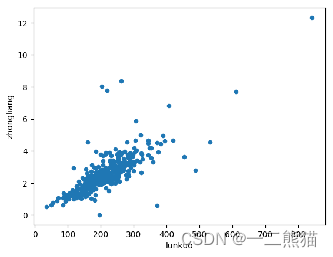
通过公式“y=kx+b”来获取质量,其中y为质量,k为系数,不同种类淡水鱼有不同的系数,x为需要计算的某条鱼的轮廓面积,b为增益系数。 1.首先获取这一类淡水鱼的数据集中的轮廓面积,并将其单独存放于weight.txt文件中。 2.将其轮廓面积与对应的体重合并到jiegou.txt文件作为新的训练数据集。 3.将新数据集转换为表格形式并做数据展示,通过折线图可以清晰的看到,轮廓面积和质量之间有一定的线性关系。 4.通过最小二乘法进行线性回归,最终拟合并得到这一类淡水鱼的k、b值。
#获取所有图片的轮廓面积
from PIL import Image
import PIL.ImageOps
import numpy as np
import matplotlib.pyplot as plt
import matplotlib.image as mpimg
from skimage.io import imsave
from PIL import ImageEnhance
import cv2
Notee=open('zhongliang/lunkuo.txt',mode='a')
Notee.truncate(0)

with open("zhongliang/dedaolunkuo.txt","r") as f:
    filepath = f.readlines()

data =[filepath[i].split(" ")[0] for i in range(445)]
for number in range(0,445):
    #背景转化为黑色
    #in_path  = "data/fish_pic/fish_data/fish_image23/fish_3/300.jpg"
    xuhao = 0         #这里为需要计算的图片质量序号,(0——9)
    in_path  = data[number]
    print('path is : '+data[number])
    dizhi="zhongliang/1.jpg"
    out_path = dizhi
    out_path_area = "zhongliang/2.jpg"
    Img = cv2.imread(str(in_path))
    Img2 = np.array(Img, copy=True)
    white_px = np.asarray([255, 255, 255])
    black_px = np.asarray([0  , 0  , 0  ])

    (row, col, _) = Img.shape

    for r in range(row):
        for c in range(col):
            px = Img[r][c]
            if all(px == white_px):
                Img2[r][c] = black_px

    imsave(out_path, Img2)


    #对转化后的图片进行描边
    mat_img = cv2.imread(out_path)
    mat_img2 = cv2.imread(out_path,cv2.CV_8UC1)

    #cv2.imshow("Initial image",mat_img)
    #cv2.waitKey(0)

    #自适应分割
    dst = cv2.adaptiveThreshold(mat_img2,210,cv2.BORDER_REPLICATE,cv2.THRESH_BINARY_INV,3,10)
    #提取轮廓
    contours,heridency = cv2.findContours(dst,cv2.RETR_EXTERNAL,cv2.CHAIN_APPROX_SIMPLE)
    #标记轮廓
    cv2.drawContours(mat_img,contours,-1,(255,0,255),3)

    imsave(out_path_area, mat_img)
    #计算轮廓面积
    area = 0
    for i in contours:
        area += cv2.contourArea(i)
    area*=100
    print("area is :",area)

    def MY_ConTourArea(cnt): #传入一个轮廓
        rect = cv2.minAreaRect(cnt)  #最小外接矩形
        box = cv2.boxPoints(rect)
        box = np.int0(box)
        return cv2.contourArea(box)#cv2.contourArea()底层使用的是格林公式,对边界上的所有像素点没有相加

    myarea = 0
    for i in contours:
        myarea += MY_ConTourArea(i)
    myarea/=2
    myarea += area
    print("myarea is :",myarea)

    Note=open('zhongliang/lunkuo.txt',mode='a')
    Note.write(str(area))   #写数据
    Note.write("\n")
pip install xlwt
# # 修改合适txt,只使用一次

# # 需要修改的txt文件
# filename = r"zhongliang/weight.txt"
# # 重新保存的txt文件
# new_filename = r"zhongliang/NewWeight.txt"
# # 打开需要修改的和重新保存的txt文件
# with open(filename,encoding="utf-8") as f1, open(new_filename,"w",encoding="utf-8") as f2:
#     for line in f1:
#         new_line = line[4:]     # [:-3] 表示后三个
#         f2.write(new_line)
# f1.close()
# f2.close()
#合并两个txt,以经有合并后的“jiegou.txt”了,就不需要再进行合并
import sys
import os

Notee=open('zhongliang/hebing.txt',mode='a')
Notee.truncate(0)

f1=open("zhongliang/lunkuo.txt","r")
line1 = f1.read().splitlines()
f2 = open("zhongliang/Weight.txt","r")
line2 = f2.read().splitlines()
list = []
for i in range(0,len(line1)):
    a =(line1[i]+" "+line2[i]+"\n")
    list.append(a)
    line=f1.readlines()
with open('zhongliang/hebing.txt', 'a') as month_file:
     for line in list:
         s = line
         month_file.writelines(s)
# coding=gbk
import numpy as np
import xlrd
import xlwt
f = open('zhongliang/hebing.txt','r') #打开数据文本文档,注意编码格式的影响,这里用的是ANSI编码
wb = xlwt.Workbook(encoding = 'ANSI') #打开一个excel文件
ws1 = wb.add_sheet('first') #添加一个新表
row = 1 #写入的起始行
col = 0 #写入的起始列
k = 0
ws1.write(0, 0 ,"lunkuo")
ws1.write(0, 1 ,"zhongliang")
for lines in f:
    a = lines.split(' ') #txt文件中每行的内容按‘ ’分割并存入数组中
    k+=1
    #rb = xlrd.open_workbook('C:\\Users\\DELL\\Desktop\\biao.xlsx')
    #ws1 = rb.get_ws1(0)
    for i in range(len(a)):
        ws1.write(row, col ,a[i])#向Excel文件中写入每一项
        col += 1
    row += 1
    col = 0
wb.save("zhongliang/hebing.xlsx")
7.1 以下为最小二乘法回归
# import pandas as pd
# data = pd.read_excel("zhongliang/hebing.xlsx")
# data
# import matplotlib.pyplot as plt
# data = pd.read_excel("zhongliang/hebing.xlsx")
# data.plot.scatter(x= 'lunkuo',y='zhongliang')
# plt.show()
# from sklearn.linear_model import LinearRegression
# features = data ['lunkuo'].values.reshape(-1,1)
# target  = data ['zhongliang']
# regression = LinearRegression()
# model = regression.fit(features,target)
# model.intercept_
# #b值
# model.coef_
# #K值
# import matplotlib.pyplot as plt
# data = pd.read_excel("zhongliang/hebing.xlsx")
# data.plot.scatter(x= 'lunkuo',y='zhongliang')
# plt.plot([0,1000],[0,10.97144892],'r--' )
# plt.show()
# new_x = 1000
# new_x = np.array(new_x).reshape(1, -1)
# pre_y = model.predict(new_x)
# print(pre_y)
pip install measure
pip install imutils
最小二乘法拟合获取的轮廓数据以及拟合线条图
7.2 搭建重量模型
首先载入需要用到的库,它们分别是:
paddle.fluid:引入PaddlePaddle深度学习框架的fluid版本库;
numpy:NumPy是Python语言的一个扩展程序库。支持高端大量的维度数组与矩阵运算,此外也针对数组运算提供大量的数学函数库。NumPy的核心功能是"ndarray"(即n-dimensional array,多维数组)数据结构。
os: python的模块,可使用该模块对操作系统、目录、文件等进行操作
matplotlib.pyplot:用于生成图,在验证模型准确率和展示成本变化趋势时会使用到
#1,导入各类库
import paddle
import paddle.fluid as fluid
from paddle.fluid.dygraph.nn import Linear
import numpy as np
import random
# 载入数据
data = np.genfromtxt("zhongliang/hebing_train.csv", delimiter=",",encoding='gb2312')
x_data = data[1:,0]
y_data = data[1:,1]
#把列表转为数组,重构数组
x_data=np.array(x_data).reshape([-1,1])
y_data=np.reshape(y_data,[-1,1])
x_data=np.array(x_data).astype("float32")
y_data=np.array(y_data).astype("float32")
#3,准备模型
class MNIST(fluid.dygraph.Layer):
    def __init__(self):
        super(MNIST,self).__init__()
         # 定义一个全连接层,输入输出1
        self.fc=Linear(input_dim=1,output_dim=1,act=None)
    def forward(self,inputs):#网络向前方式
        x=self.fc(inputs)
        return x
#4,开始训练
with fluid.dygraph.guard():
    model=MNIST()
    model.train()
    iterid=[] #训练次数列表
    losses=[] # 损失值列表

    #将numpy.ndarray转换为Tensor
    image=fluid.dygraph.to_variable(x_data)
    label=fluid.dygraph.to_variable(y_data)

    # 定义优化器,使用梯度下降Adam优化器,学习率设置为0.001
    optimizer = fluid.optimizer.AdamOptimizer(learning_rate=0.001, parameter_list=model.parameters())
    #optimizer = fluid.optimizer.SGDOptimizer(learning_rate=0.001, parameter_list=model.parameters())
    #optimizer = fluid.optimizer.AdamOptimizer(learning_rate=0.01, regularization=fluid.regularizer.L2Decay(regularization_coeff=0.1),
    #                                          parameter_list=model.parameters())
    EPOCH_NUM=30000 #训练次数
    for epoch_id in range(EPOCH_NUM):
        #计算模型输出
        predict=model(image)

#PaddlePaddle提供了很多的损失函数的接口,比如交叉熵损失函数(cross_entropy)。
#因为本项目是一个线性回归任务,所以我们使用的是均方差损失函数。
#可以调用fluid.layers.square_error_cost(input= ,laybel= )实现方差计算。
#因为fluid.layers.square_error_cost(input= ,laybel= )求的是一个Batch的损失值,
#所以我们还要通过调用fluid.layers.mean(loss)对方差求平均。
#将输入定义为 房价预测值,label定义为 标签数据。进而计算损失值。
        loss=fluid.layers.square_error_cost(predict,label)#计算损失函数
        avg_loss=fluid.layers.mean(loss)

        iterid.append(epoch_id)
        losses.append(avg_loss.numpy())# 保存损失值中间状态

        if epoch_id % 1000 ==0:
            print("epoch_id is {},avg_loss is {}".format(epoch_id,avg_loss.numpy()))
        avg_loss.backward()#反向传播 得到参数的梯度参数值

        optimizer.minimize(avg_loss)# 最小化损失函数,清除本次训练的梯度
        model.clear_gradients

    #保存模型参数
    fluid.save_dygraph(model.state_dict(),"one_yuan")
#输出模型的损失图
import matplotlib.pyplot as plt
%matplotlib inline
plt.plot(iterid,losses)
plt.grid()
plt.show()
#5,检测效果
Input = 29300

with fluid.dygraph.guard():
    model_dict,_=fluid.load_dygraph("one_yuan")
    model.load_dict(model_dict)#加载模型参数
    model.eval()
    #29300来测试,正确结果为3.335
    test_data=np.array([Input]).astype("float32")
    test_data=fluid.dygraph.to_variable(test_data)
    result=model(test_data)
    print(result.numpy())
model.parameters()
#############验证处

from PIL import Image
import PIL.ImageOps
import numpy as np
import matplotlib.pyplot as plt
import matplotlib.image as mpimg
from skimage.io import imsave
from PIL import ImageEnhance
import cv2

with open("data/test_list.txt","r") as f:
    filepath = f.readlines()

data =[filepath[i].split(" ")[0] for i in range(10)]

#背景转化为黑色
#in_path  = "data/fish_pic/fish_data/fish_image23/fish_3/300.jpg"
xuhao = 4    #这里为需要计算的图片质量序号,(0——9)
in_path  = data[xuhao]
print('path is : '+data[xuhao])
dizhi="zhongliang/1.jpg"
out_path = dizhi
out_path_area = "zhongliang/2.jpg"
Img = cv2.imread(str(in_path))
Img2 = np.array(Img, copy=True)
# 1.全局阈值法
# ret, mask_all = cv2.threshold(src=Img,                  # 要二值化的图片
#                               thresh=200,               # 全局阈值
#                               maxval=255,               # 大于全局阈值后设定的值
#                               type=cv2.THRESH_BINARY)   # 设定的二值化类型,THRESH_BINARY:表示小于阈值置0,大于阈值置填充色

# imsave(out_path, mask_all)
white_px = np.asarray([255, 255, 255])
black_px = np.asarray([0  , 0  , 0  ])

(row, col, _) = Img.shape

for a in range(row-2):
    for b in range(col-2):
        da = 0
        r = a+1
        c =b+1
        #像素点周边八个区域,内部点计算算法
        px = Img[r][c]
        p1 = Img[r-1][c-1],
        p2 = Img[r-1][c] ,
        p3 = Img[r-1][c+1] ,
        p4 = Img[r][c-1] ,
        p5 = Img[r][c+1] ,
        p6 = Img[r+1][c-1],
        p7 = Img[r+1][c] ,
        p8 = Img[r+1][c+1]
        if all(px == white_px):
            Img2[r][c] = black_px

imsave(out_path, Img2)

#对转化后的图片进行描边
mat_img = cv2.imread(out_path)
mat_img2 = cv2.imread(out_path,cv2.CV_8UC1)

#cv2.imshow("Initial image",mat_img)
#cv2.waitKey(0)

#自适应分割+提取轮廓+标记轮廓
dst = cv2.adaptiveThreshold(mat_img2,210,cv2.BORDER_REPLICATE,cv2.THRESH_BINARY_INV,3,10)
contours,heridency = cv2.findContours(dst,cv2.RETR_EXTERNAL,cv2.CHAIN_APPROX_SIMPLE)
cv2.drawContours(mat_img,contours,-1,(255,0,255),3)

imsave(out_path_area, mat_img)
#计算轮廓面积
area = 0

def MY_ConTourArea(cnt): #传入一个轮廓
    rect = cv2.minAreaRect(cnt)  #最小外接矩形
    box = cv2.boxPoints(rect)
    box = np.int0(box)
    return cv2.contourArea(box)#cv2.contourArea()底层使用的是格林公式,对边界上的所有像素点没有相加


for i in contours:
    area += MY_ConTourArea(i)
print("area is :",area)


areatwo = 0
for i in contours:
    areatwo += cv2.contourArea(i)
areatwo*=100
print("areatwo is :",areatwo)

#计算确切面积
#获取系数
Note=open('data/jisuan.txt',mode='r')
notedata = Note.readlines()
xishu = 0
datab = 0
fishmapdata = open('zhongliang/fish_data_map.txt',mode='r')
for line in fishmapdata:
    if int(line[0:2])==int(notedata[xuhao]):         #这里的序号指的是需要计算的图片的在“jisuan.txt”文件中的序号,然后通过这个对应的序号在map中找到相对的质量系数
        #print('the fishmapdata is : '+line[2:10])
        xishu = line[2:14]
        datab = line[14:25]

print('the mapdata is : '+ str(notedata[xuhao])+'the fishmapdata is : '+str(xishu))
print('the datab is : '+str(datab))

#将预测结果保存起来
# Note = open('zhongliang/picture_one/yuce.txt',mode='a')
# Note.write("The path is: "+str(in_path)+"  ")   #写数据


#根据最小二乘法得到回归方程的k和b后,进行y=Kx+b的模型计算计算

lastdata = areatwo*float(xishu)+float(datab)
last = "The weight of this fish is : "+str(lastdata)+" kg"
# Note.write(str(lastdata))
# Note.write("\n")
print(last)

plt.figure(dpi=150)
test_img = in_path  #提取路径
img = Image.open(test_img).resize((256,256))
img=ImageEnhance.Contrast(img).enhance(5)
plt.title(last)
plt.imshow(Img2)


# import imutils
# cnts = cv2.findContours(dst, cv2.RETR_LIST, cv2.CHAIN_APPROX_SIMPLE)
# cnts = imutils.grab_contours(cnts)
# c = max(cnts, key = cv2.contourArea)
# print("area is :",c)

# #计算确切面积
# Note=open('data/jisuan.txt',mode='r')
# notedata = Note.readlines()
# xishu = 0
# datab = 0
# fishmapdata = open('zhongliang/fish_data_map.txt',mode='r')
# for line in fishmapdata:
#     if int(line[0:2])==int(notedata[xuhao]):         #这里的序号指的是需要计算的图片的在“jisuan.txt”文件中的序号,然后通过这个对应的序号在map中找到相对的质量系数
#         #print('the fishmapdata is : '+line[2:10])
#         xishu = line[2:13]
#         datab = line[13:40]

# print('the mapdata is : '+ str(notedata[xuhao])+'the fishmapdata is : '+str(xishu))
# print('the datab is : '+str(datab))


# #根据最小二乘法得到回归方程的k和b后,进行y=Kx+b的模型计算计算

# lastdata = area*float(xishu)+float(datab)
# last = "The weight of this fish is : "+str(lastdata)+" kg"
# print(last)

# plt.figure(dpi=150)
# test_img = in_path  #提取路径
# img = Image.open(test_img).resize((256,256))
# img=ImageEnhance.Contrast(img).enhance(5)
# plt.title(last)
# plt.imshow(img)


#################################################################################
# 在二值图像中,如果两个像素点相邻且值相同(同为0或同为1),那么就认为这两个像素点在一个相互连通的区域内。
# 而同一个连通区域的所有像素点,都用同一个数值来进行标记,这个过程就叫连通区域标记。
# 通过标记所有的联通区域的方式确定图片中淡水鱼的轮廓面积(筛选出大于500像素点的轮廓并做记录,最大的一块为淡水鱼轮廓面积)


# #coding=utf-8
# import numpy as np
# import scipy.ndimage as ndi
# from skimage import measure,color
# import matplotlib.pyplot as plt

# # data = microstructure(l=256)*1 #生成测试图片
# in_path  = "data/fish_pic/fish_data/fish_image23/fish_3/300.jpg"
# Img = cv2.imread(str(in_path))
# labels = measure.label(in_path,connectivity=2)  #

# #筛选连通区域大于500的
# properties = measure.regionprops(labels)

# valid_label = set()
# for prop in properties:
#     if prop.area > 500:
#         valid_label.add(prop.label)
# current_bw = np.in1d(labels, list(valid_label)).reshape(labels.shape)


# dst = color.label2rgb(current_bw)  #根据不同的标记显示不同的颜色
# print('regions number:', current_bw.max()+1)  #显示连通区域块数(从0开始标记)

# fig, (ax1, ax2, ax3) = plt.subplots(1, 3, figsize=(8, 4))
# ax1.imshow(data, plt.cm.gray, interpolation='nearest')
# ax1.axis('off')
# ax2.imshow(current_bw, plt.cm.gray, interpolation='nearest')
# ax2.axis('off')
# ax3.imshow(dst,interpolation='nearest')
# ax3.axis('off')

# fig.tight_layout()
# plt.show()
import numpy as np
import matplotlib.pyplot as plt
import math
file1 = open('zhongliang/picture_one/picture_one_yuce.txt')  #打开文档
file2 = open('zhongliang/picture_one/picture_one_zhenshi.txt')  #打开文档
data1 = file1.readlines() #读取文档数据
data2 = file2.readlines() #读取文档数据
part_1 = []  #新建列表,用于保存第一列数据
part_2 = []
for num in data1:
	# split用于将每一行数据用逗号分割成多个对象
    #取分割后的第0列,转换成float格式后添加到para_1列表中
    part_1.append(float(num.split(',')[0]))
for num in data2:
	# split用于将每一行数据用逗号分割成多个对象
    #取分割后的第0列,转换成float格式后添加到para_1列表中
    part_2.append(float(num.split(',')[0]))
plt.figure()
plt.title("Contrast")
plt.xlabel("Sign")
plt.ylabel("Weight")
plt.plot(part_1,color = 'green', label = 'yuce')
plt.plot(part_2,color = 'red', label = 'zhenshi')
plt.show()
#1、平均绝对误差(Mean Absolute Error, MAE):是绝对误差的平均值,可以更好地反映预测值误差的实际情况
#方法一:
Sum = 0
for i in range(len(part_1)):
    Sum += abs(part_2[i] - part_1[i])
    MAE = Sum/len(part_1)

print("Mean absolute error : " + str(MAE))

#方法二:
# from sklearn.metrics import mean_absolute_error
# print(mean_absolute_error(part_1,part_2))#Y_real为实际值,Y_pre为预测值
#2、均方误差(Mean Square Error, MSE):是真实值与预测值的差值的平方,然后求和的平均,一般用来检测模型的预测值和真实值之间的偏差
MSE =np.sum([(x - y) ** 2 for x, y in zip(part_1, part_2)]) / len(part_1)
print("The accuracy of the regression model is measured by mean square error :" + str(MSE))

#3、均方根误差(Root Mean Square Error, RMSE):即均方误差开根号,方均根偏移代表预测的值和观察到的值之差的样本标准差
RMSE = math.sqrt(MSE)
print("The root mean square error measures the accuracy of regression models, :" + str(RMSE))
#4、R²(R squared, Coefficient of determination):决定系数,反映的是模型拟合数据的准确程度,一般R² 的范围是0到1。
#其值越接近1,表明方程的变量对y的解释能力越强,这个模型对数据拟合的也较好
#计算R²
from sklearn.metrics import r2_score
print(r2_score(part_2,part_1))#Y_real为实际值,Y_pre为预测值
import matplotlib.pyplot as plt
y = np.linspace(0,10,100)
file1 = open('zhongliang/picture_two/picture_two_yuce.txt')  #打开文档
file2 = open('zhongliang/picture_two/picture_two_zhenshi.txt')  #打开文档
file3 = open('zhongliang/picture_two/picture_two_lunkuo.txt')  #打开文档
data1 = file1.readlines() #读取文档数据
data2 = file2.readlines() #读取文档数据
data3 = file3.readlines() #读取文档数据

part_1 = []  #新建列表,用于保存第一列数据
part_2 = []
part_3 = []
for num in data1:
	# split用于将每一行数据用逗号分割成多个对象
    #取分割后的第0列,转换成float格式后添加到para_1列表中
    part_1.append(float(num.split(',')[0]))
for num in data2:
	# split用于将每一行数据用逗号分割成多个对象
    #取分割后的第0列,转换成float格式后添加到para_1列表中
    part_2.append(float(num.split(',')[0]))
for num in data3:
	# split用于将每一行数据用逗号分割成多个对象
    #取分割后的第0列,转换成float格式后添加到para_1列表中
    part_3.append(float(num.split(',')[0]))

plt.figure()
plt.title("Contrast——Weight")
plt.xlabel("Contour area")
plt.ylabel("Weight")
plt.plot(part_3,part_1,color = 'green',  label = 'yuce')
plt.plot(part_3,part_2,color = 'red', label = 'zhenshi')
plt.show()
回归模型的准确率是只预测值与真实值之间的平均差异。通常采用均方误差(Mean Squared Error,MSE)或者均方根误差(Root Mean Squared Error,RMSE)来度量回归模型的准确率,MSE表示预测值与真实值之间的平方差的平均值,计算公式为:MSE=(1/n)*∑(yi-yi估计)²,其中yi为预测值,n为样本数,RMSE为MSE的平方根。
实验结果分析
1.淡水鱼单个体识别效果
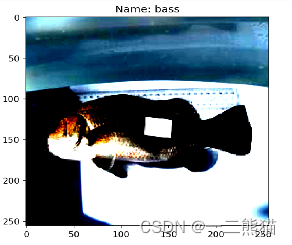
2.使用残差网络单次识别多只鲈鱼结果
3.获取轮廓面积算法选择算法一,算法二淡水鱼类的形态与其轮廓的最小外接矩形有很大的偏差,舍去。
4.算法三最大连通区域中由于背景经过黑户,最终得到的效果为背景中的某一块区域,不符合结果。
5.体重模型损失函数结果

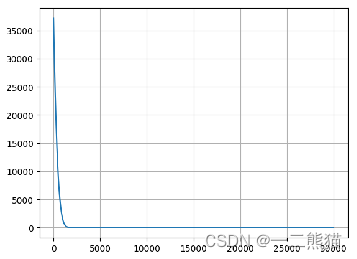
6.所有损失函数值折线图
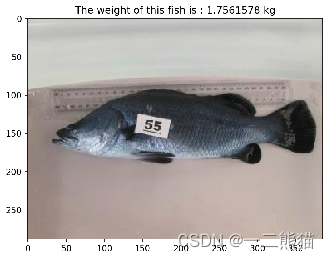
7.实验个体原图及计算出的体重图
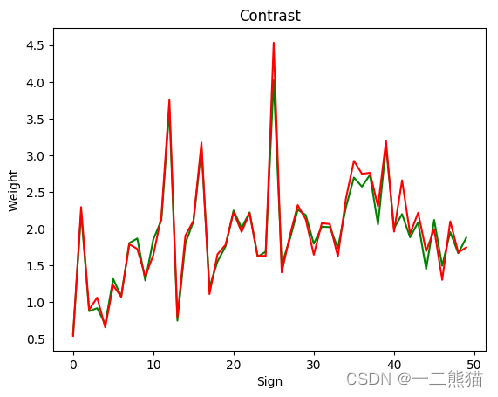
8.五十只鲈鱼个体体重预测数据(绿色折线)和真实数据(红色折线),拟合效果较好。横坐标为鲈鱼个体编号,纵坐标为质量。
9.五十只鲈鱼个体体重预测情况(绿色是预测值,红色为真实值),横坐标为轮廓面积,纵坐标为质量。
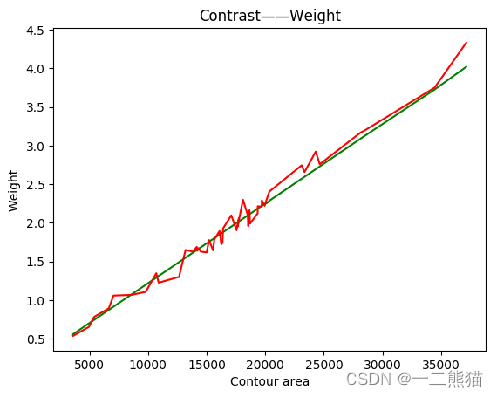
算出来的轮廓面积与质量映射数据集中,含有一部分噪声点异常点,有一些噪声点的偏差与普通数据相比差距异常大,通过去除这些噪声点异常点后再投入拟合模型训练,之后再使用模型预测在实际应用中会更好。
