MNE
官网链接
导包
import mne
import matplotlib.pyplot as plt
加载数据集
不同格式数据集使用的函数不同,具体在官网搜索
raw = mne.io.read_raw_brainvision(r"test.vhdr", preload=True)
此语句为了画图方便
%matplotlib
降采样
raw.resample(200)
查看数据
# 一屏展示10个位置信号,长10秒
raw.plot(duration=10, n_channels=10)
# 绘制PSD
raw.plot_psd(fmax=60)
plt.show()


滤波
高通滤波、低通滤波
raw.filter(1, 60)
过滤市电
raw.notch_filter(50)
查看数据
raw.plot(duration=10, n_channels=10)
raw.plot_psd(fmax=60)
plt.show()

标记坏导
坏导是手动添加的,直接补充在bads列表内
raw.info["bads"].append("T7")
print(raw.info)
插值坏导
# reset_bads=True作用是插值之后把bads列表清空
raw.interpolate_bads(reset_bads=True, mode='mean')
重参考
# use average of mastoid channels as reference
raw.set_eeg_reference(ref_channels=['TP9', 'TP10'])
ICA
ica = mne.preprocessing.ICA(n_components=20, random_state=0)
ica.fit(raw)
查看捕获到的伪迹
raw.load_data()
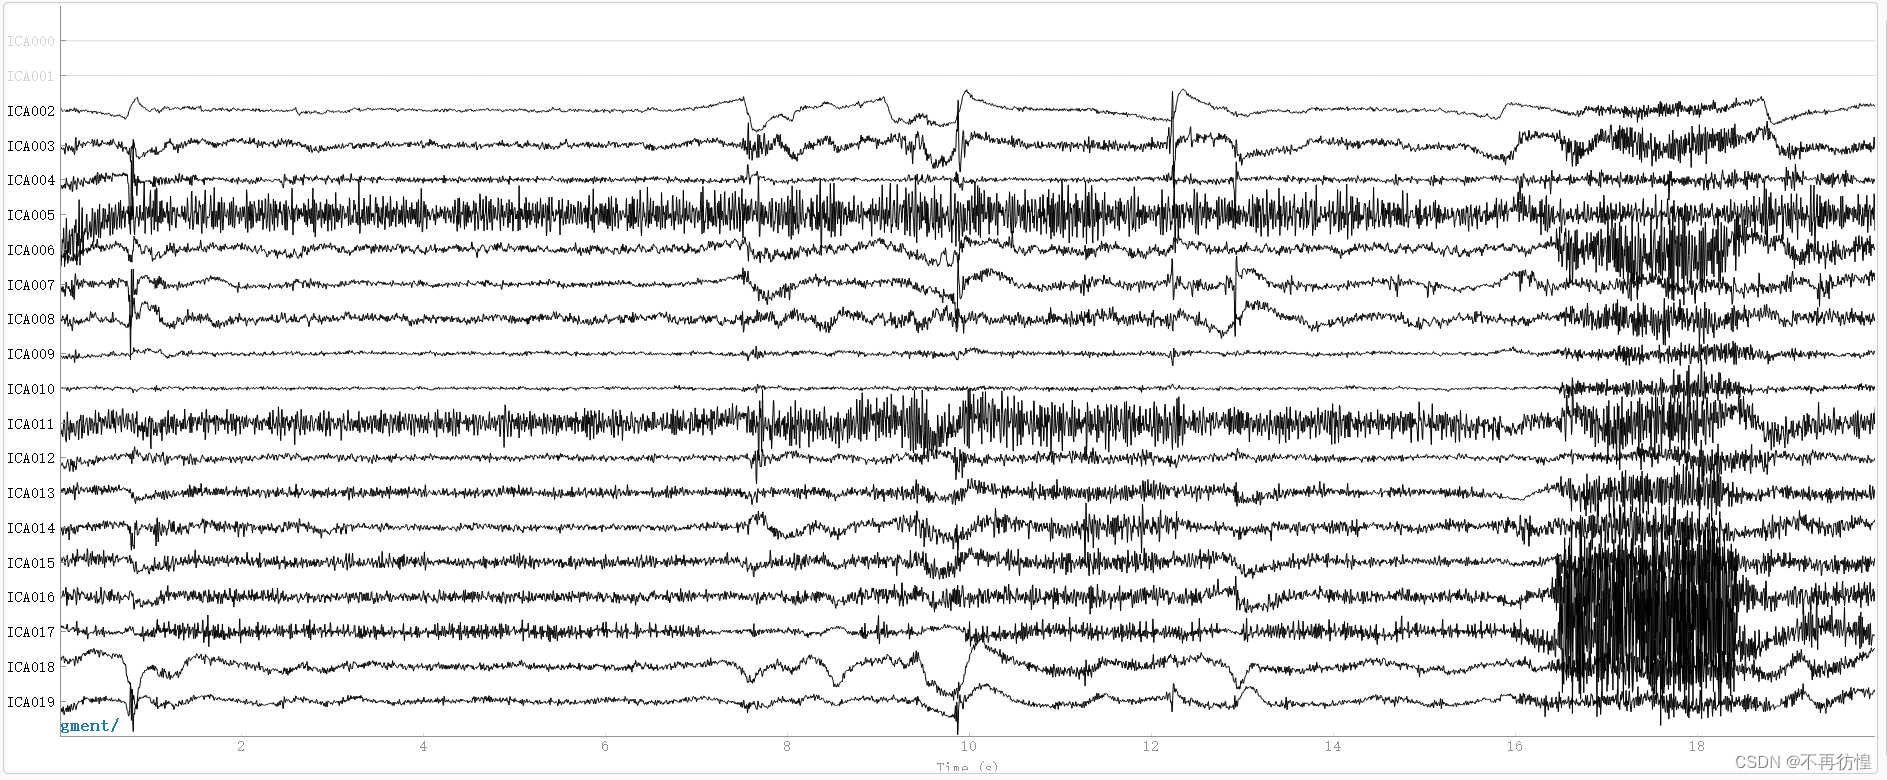
ica.plot_sources(raw, show_scrollbars=False)

ica.plot_components()

删除伪迹
# 删除前两个
ica.exclude = [0, 1]
ica.apply(raw)

raw.load_data()
ica.plot_sources(raw, show_scrollbars=False)
前两个变灰,消失
![[虚幻引擎插件说明] DTOperateFile 使用蓝图操作文件](https://img-blog.csdnimg.cn/img_convert/dc01c35d8e802d3588b5b0738d88e6a4.png)
