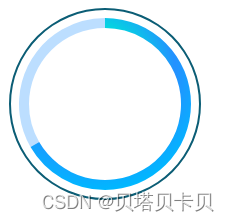
const value_ze = 60
const value2_ze = 30
var myChart = echarts.init( document.getElementById( 'myChart' )) ;
var option = {
title: {
text: ` 目标完成率` [ ` { a| ${ value_ze} } ` '{b|%}' ] .join( '' ) ,
itemGap: 10 ,
textStyle: {
fontSize: '14' ,
color: '#fff' ,
fontWeight: 500
} ,
subtextStyle: {
rich: {
a: {
fontSize: '32' ,
color: '#fff' ,
fontWeight: 500 ,
fontFamily: "numStyle"
} ,
b: {
fontSize: '14' ,
color: '#fff' ,
padding: [ 8 , 0 , 0 , 6 ]
} ,
}
} ,
left: 'center' ,
top: '35%' ,
} ,
grid: {
top: '0%' ,
left: '0%' ,
right: '0%' ,
bottom: '0%' ,
containLabel: true
} ,
visualMap: {
show: false,
} ,
series: [
{
name: '' ,
type: 'pie' ,
radius: [ '94%' , '96%' ] ,
center: [ '50%' , '50%' ] ,
itemStyle: {
label: {
show: false,
} ,
} ,
hoverAnimation: false,
data: [
{
value: 100 ,
label: {
show: false,
} ,
itemStyle: {
normal: {
color: "#0b5d75"
}
} ,
}
] ,
} ,
{
type: 'pie' ,
radius: [ '76%' , '86%' ] ,
center: [ '50%' , '50%' ] ,
data: [
{
value: value_ze,
itemStyle: {
normal: {
color: new echarts.graphic.RadialGradient( 0.4 , 0.3 , 1 , [
{
offset: 0.25 ,
color: '#00dddd' // 0 % 处的颜色
} ,
{
offset: 0.5 ,
color: '#2491ff' // 0 % 处的颜色
} ,
{
offset: 0.75 ,
color: '#00b7ff' // 0 % 处的颜色
} ,
{
offset: 1 ,
color: '#fff' // 100 % 处的颜色
}
] )
}
} ,
} ,
{ value: value2_ze, itemStyle: { color: 'rgba(34, 145, 255, 0.3)' } } ,
] ,
label: {
//将视觉引导图关闭
show: false,
} ,
// 初始化echarts的动画效果
animationType: 'scale' ,
animationEasing: 'elasticOut' ,
animationDelay: function ( idx) {
return Math.random( ) * 200 ;
}
}
]
} ;
myChart.setOption( option) ;
