基本介绍
实际工程中,未来预测是值得研究的课题之一,大部分深度模型在短期预测上表现不错,在中长
期预测上往往欠佳。
本文依然借助LSTM专栏的一些基础预测,探讨未来预测的简单实现方式。
程序设计
直接多步预测
·直接多步预测的本指还是单步预测,多步转单步,这种做法的问题是如果我们要预测N个时间
步,则复杂度很高,比如预测未来10天,则意味着我们要构建10个模型;
·另外需要注意的是,在使用这种方法的时候,我们在进行特征工程的时候要比较小心,因为我们
在序列问题的特征工程过程中常常会涉及到滞后特征的引入;
·时间窗的长度和我们处理无序的结构化问题有一些区别,长度的概念对应的是样本的数量,但是
实际上在结构化数据中,对应特征的维度。
递归多步预测
·基础数据加载和网络搭建可以参考时序预测IMATLAB实现LSTM时间序列预测文章,以下介绍
未来预测的实现方式。
·预测未来10个值,需要修改的地方如下:
numTimeSteps Test+10
idx = numTimeStepsTrain:(numTimeStepsTrain+numTimeStepsTest+10);
numTimeStepsTest = numel(XTest);
for i = 2:numTimeStepsTest+10
    [net,YPred(:,i)] = predictAndUpdateState(net,YPred(:,i-1),'ExecutionEnvironment','cpu');
end

YPred = sig*YPred + mu;
YTest = dataTest(2:end);
RMSE  = sqrt(mean((YPred(1:numel(XTest))-YTest).^2));
MAPE  = mean((YPred(1:numel(XTest))-YTest)./YTest);
disp(["RMSE1  ",RMSE ])
disp(["MAPE1 ", MAPE])
% 使用预测值绘制训练时序
figure
plot(dataTrain(1:end-1),'-.','Color',[0 0 255]./255,'linewidth',0.8,'Markersize',4,'MarkerFaceColor',[0 0 255]./255)
hold on
idx = numTimeStepsTrain:(numTimeStepsTrain+numTimeStepsTest+10);
plot(idx,[data(numTimeStepsTrain) YPred],'-.','Color',[255 0 0]./255,'linewidth',0.8,'Markersize',4,'MarkerFaceColor',[255 0 0]./255)
hold off
xlabel("Month")
ylabel("Cases")
title("Forecast")
legend(["Observed" "Forecast"])
% 将预测值与测试数据进行比较。
figure
subplot(2,1,1)
plot(YTest,'b:o','Color',[0 0 255]./255,'linewidth',0.8,'Markersize',4,'MarkerFaceColor',[0 0 255]./255)
hold on
plot(YPred,'k-s','Color',[0 0 0]./255,'linewidth',0.8,'Markersize',5,'MarkerFaceColor',[0 0 0]./255)
hold off
legend(["Observed" "Forecast"])
ylabel("Cases")
title("Forecast")
subplot(2,1,2)
stem(YPred(1:numel(XTest)) - YTest,'filled','Color',[180 60 0]./255,'linewidth',1,'Markersize',6,'MarkerFaceColor',[180 60 0]./255)
xlabel("Month")
ylabel("Error")
title("RMSE = " + RMSE)
预测效果

多输出策略
·传统的机器学习算法包括LRIGBDTISVM无法直接构建多输出模型而要借助于直接预测、递归预
测或者混合策略,但是神经网络可以打破这样的限制,可以非常灵活的支持多输入或者多输出的
形式。
·数据为单变量时序数据,导入时出现问题可能涉及数据转置操作,data=[data{:}]是把cell转换为
double,也可以直接使用自己的数据。
·需要注意的是我这里没有严格划分数据集,大家可以按照需要自行处理。
%长短时记忆的神经网络LSTM
clc;clear;
warning off;
%导入数据
load data ;
data = [data{:}]';
n=length(data);
u=n-10-10+1;
%%
%准备输入和输出训练数据
input_train=zeros(10,u);
for i=1:u
    input_train(:,i)=data(i:i+10-1)';
end
output_train=zeros(10,u);
for i=1:u
   output_train(:,i)=data(i+10:i+10+10-1)';
end

%% 归一化(全部特征 均归一化)
[inputn,inputps]=mapminmax(input_train);
[outputn,outputps]=mapminmax(output_train);
%% LSTM 层设置,参数设置
inputSize = size(inputn,1);    %数据输入x的特征维度
outputSize = size(outputn,1);  %数据输出y的维度
numhidden_units=600;
%% lstm
layers = [ ...
    sequenceInputLayer(inputSize)                 %输入层设置
    lstmLayer(numhidden_units,'name','hidden')    %隐藏层
    dropoutLayer(0.2,'name','dropout')            %隐藏层权重丢失率,防止过拟合
    fullyConnectedLayer(outputSize)               %全连接层设置
    regressionLayer('name','out')];               %回归层(因为预测值为连续值,所以为回归层)
%% trainoption(lstm)
opts = trainingOptions('sgdm', ...      %优化算法
    'MaxEpochs',600, ...                %遍历样本最大循环数
    'MiniBatchSize',20,...              %批处理
    'GradientThreshold',1,...           %梯度阈值
    'ExecutionEnvironment','gpu',...    %运算环境
    'InitialLearnRate',0.005, ...       %初始学习率
    'LearnRateSchedule','piecewise', ...%学习率计划
    'LearnRateDropPeriod',200, ...      %epoch后学习率更新
    'LearnRateDropFactor',0.8, ...      %学习率衰减速度
    'Verbose',0, ...                    %命令控制台是否打印训练过程
    'Plots','training-progress'...      %打印训练进度
    );

%% 网络训练
tic
net = trainNetwork(inputn,outputn,layers,opts);
% 预测
toc;
bn  = predict(net,inputn);
outputnn=mapminmax('reverse',bn,outputps);

%% 测试数据
%导入测试数据
dat= data;
nn=length(dat);
uu=nn-10-10+1;
%准备测试数据
input_test=zeros(10,uu);
for i=1:uu
    input_test(:,i)=dat(i:i+10-1)';
end
inputn_test=mapminmax('apply',input_test,inputps);
%网络测试输出
yLSTMoutput = predict(net,inputn_test);
%网络输出反归一化
LSTMoutput= mapminmax('reverse',yLSTMoutput,outputps);
o1=LSTMoutput(1,1:end-1);
o2=LSTMoutput(:,end)';
LSTMoutputnew=[o1 o2];
output_test=dat(10+1:nn)';

%% 未来预测
%输入单组数据进行网络测试
afLSTMoutputtest =dat(nn-10+1:nn,1);
afLSTMoutputtestn=mapminmax('apply',afLSTMoutputtest,inputps);
%网络预测输出
af = predict(net,afLSTMoutputtestn);
%网络输出反归一化
afLSTMoutput=mapminmax('reverse',af,outputps);
aaf=afLSTMoutput'-(afLSTMoutput(1)-LSTMoutputnew(end));
afLSTMoutnew=[o1 o2 aaf];%合并
afLSTMoutnew=smooth(afLSTMoutnew);
%% 数据绘图
t0=1:n;
t1=n-nn+10+1:n;
t2=n-nn+10+1:n+10;
afLSTMoutnew=afLSTMoutnew(1:end);
output_test=output_test(1:end);
figure()
plot(t1,output_test,'-','Color',[0 0 180]./255,'linewidth',0.8,'Markersize',4,'MarkerFaceColor',[0 0 180]./255);
hold on
plot(t2,afLSTMoutnew,'-','Color',[255 0 0]./255,'linewidth',0.8,'Markersize',5,'MarkerFaceColor',[255 0 0]./255)
legend('实际值','预测值','Location','NorthWest')
title('网络预测输出','fontsize',12)
ylabel('函数输出','fontsize',12)
xlabel('样本','fontsize',12)
h = gca;
h.FontName = '华文宋体';
h.FontSize = 12;
grid minor;
axis tight
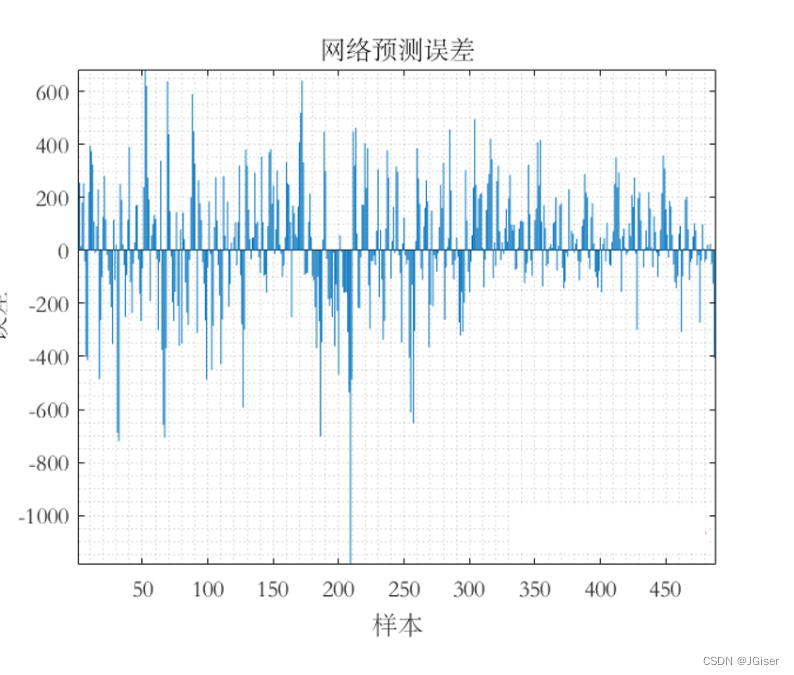
%% 预测误差
%———————————————————————————————————————
error=LSTMoutputnew-output_test;
figure()
bar(error)
title('网络预测误差','fontsize',12)
ylabel('误差','fontsize',12)
xlabel('样本','fontsize',12)
预测效果
