准备
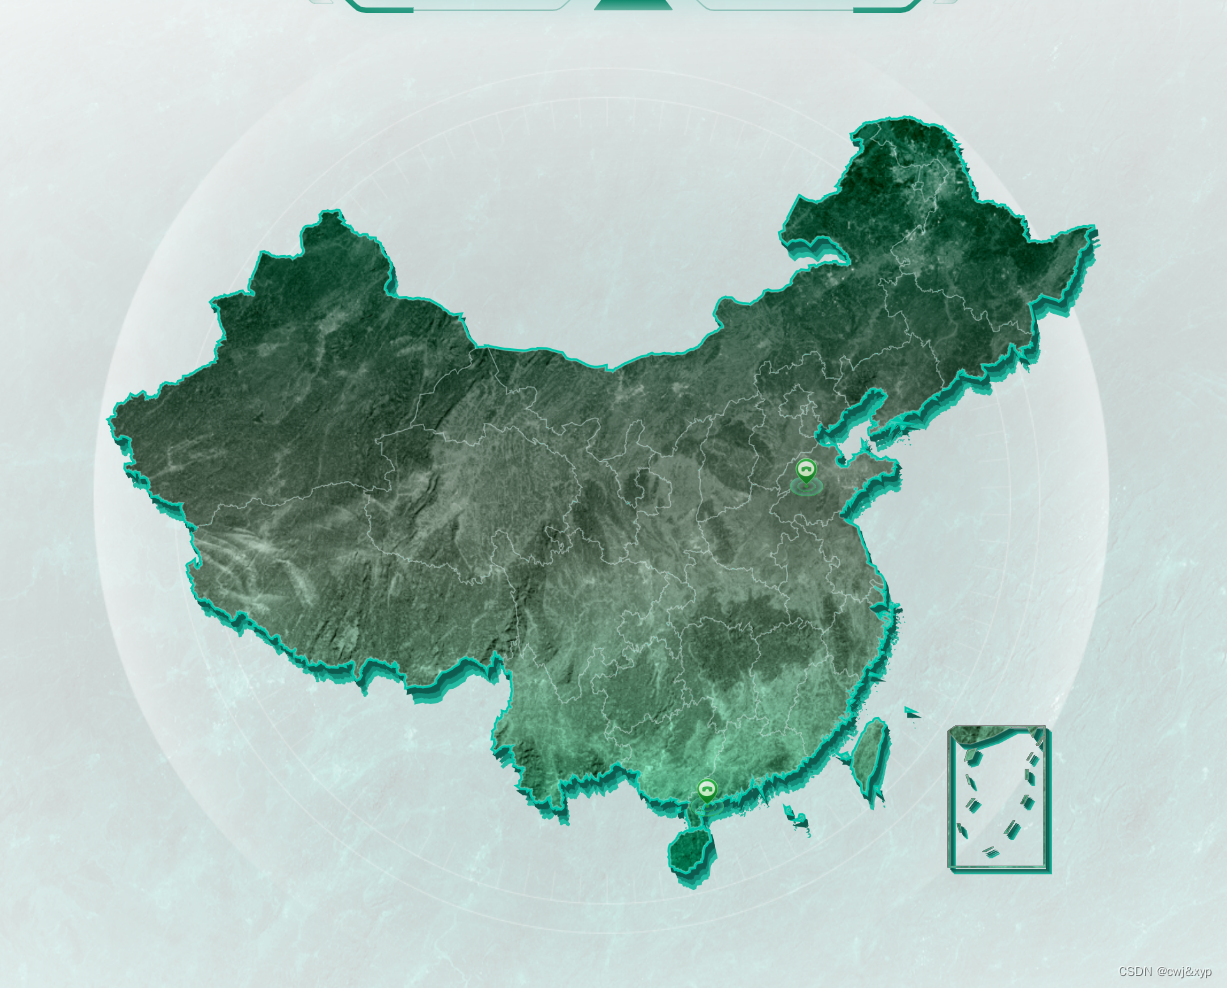
要实现地图可点击、下钻,为了使地图有3D效果,原本用map3D需要下载依赖echarts-gl,由于存在地图下钻后在区域内无法展示完整地图,改用2D地图
"echarts": "^5.4.2",
// "echarts-gl": "^2.0.9",
效果展示
结尾附上源码
实现
注册地图
地图需要有dom才能挂载,需要将挂载方法写在mounted中
挂载完成后,传入配置项渲染地图、如果有事件也在此时配置
其中on和getZr().on的区别为,前者是内容区的点击事件,即地图区域,后者为整个区域,包含地图和dom区域的空白部分区域。
this.chart = echarts.init(this.$refs.chart, '', {
        renderer: this.type,
      })
      this.chart.setOption(this.chartOption)
      this.chart.on('click', this.handleClick)
      this.chart.on('mousemove', this.handleMousemove)
      this.chart.getZr().on('mousemove', this.handleMouseout)
下钻
在echarts5中不再内置地图数据,在项目中使用的是阿里云的数据。
axios
        .get(url)
        .then((res) => {})
注意,在本地获取数据没有问题,但当发布到测试环境或者生产环境可能会返回数据403,需要在index.html中添加一行代码配置
<meta name="referrer" content="no-referrer" />
在点击事件中添加方法,重新获取数据配置项,渲染数据
打点
打点使用的是静态的点scatter,还可以使用自带动态效果的点effectScatter(目前只支持涟漪效果)
此项目中有一个问题是可能会出现经纬度相同的点,处理数据代码如下:
let arr = data.filter((child) => child.lat === item.lat && child.lng === item.lng)
          if (arr.length > 0) {
            item.childs = arr.map((item) => {
              return {
                value: [item.lng, item.lat, item.projectName, item.stage],
                lineData: [item.useMaterialNumber || 0, item.freeMaterialNumber || 0, item.demandMaterialNumber || 0],
                iconList,
                ...item,
              }
            })
          } else {
            item.childs = []
          }
阴影效果
设置多层geo添加阴影和边框,注意多层会导致地图渲染卡顿,尽量减少使用。
南海诸岛
由于地图数据返回的南海诸岛展开九段线,会导致中国地图渲染效果不理想,可以给地图设置map:'china',会自带南海诸岛缩略图,然后中国地图数据采用去掉九段线的数据
源码
map.vue
<template>
<div>
<div class="echartMapTestView">
<chart-view
class="map-view"
:chart-option="mapOpt"
height="856px"
width="856px"
:mapName="mapName"
@click="handleMapClick"
@backType="backType"
/>
</div>
</div>
</template>
<script>
// import { mapRequest } from '@/api/cockpit'
import * as echarts from 'echarts'
import axios from 'axios'
import chartView from './chartView.vue'
import { getProvincesCode, getCityCode, getMapList } from '@/api/cockpit.js'
import { yellowIcon, blueIcon, greenIcon, defaultIcon } from './icon.js'
const chinaData = require('./china.json')
let iconObj = {
useMaterialNumber: greenIcon,
freeMaterialNumber: yellowIcon,
demandMaterialNumber: blueIcon,
defaultIcon: defaultIcon,
}
export default {
name: 'echartMapTestView',
components: {
chartView,
},
data() {
return {
mapType: 'country', // 当前地图层级 province 省 city:城市
mapOpt: {},
mapName: '中国',
provinceCodeList: [],
cityCodeList: [],
provinceData: {
name: '',
code: null,
}, // 当前选中的省份code
mapPopData: [], // 地图数据
domImg: require('@/assets/images/cockpit/860img.png'),
domImg600: require('@/assets/images/cockpit/600img.png'),
iconInterval: null, //icon切换定时器
iconIndex: 0, //展示的icon索引
mapCode: null,
mapList: [],
mapJson: null,
}
},
created() {
this.getCountryData()
},
mounted() {
this.$nextTick(() => {
this.intervalInitMap(100000, '中国', 'country')
})
},
beforeDestroy() {
this.clearIconInterval()
},
methods: {
// 地图点击事件
handleMapClick(params) {
const { name, seriesType } = params
// 如果点击的是地图上的marker不下钻
if (seriesType !== 'map') return
if (this.mapType == 'country') {
let curName = name
if (name == '台湾省') {
curName = '台湾'
} else if (name == '北京市') {
curName = '北京'
} else if (name == '上海市') {
curName = '上海'
} else if (name == '重庆市') {
curName = '重庆'
} else if (name == '天津市') {
curName = '天津'
}
let index = this.provinceCodeList.findIndex((item) => item.name == curName)
if (index > -1) {
this.provinceData.name = name
this.provinceData.code = this.provinceCodeList[index].id
this.intervalInitMap(this.provinceCodeList[index].id, name, 'province')
} else {
this.provinceData = {
name: '',
code: null,
}
}
} else if (this.mapType == 'province') {
this.handleCity(name)
}
},
handleCity(name) {
getCityCode(this.provinceData.code).then((res) => {
if (res && res.length > 0) {
let index = res.findIndex((item) => item.name == name)
if (index > -1) {
this.intervalInitMap(res[index].id, name, 'city')
}
}
})
},
intervalInitMap(url, name, type) {
this.clearIconInterval()
this.initMap(url, name, type, true)
this.startInterval()
},
async initMap(url, name, type, newMap) {
let curUrl = `https://geo.datav.aliyun.com/areas_v3/bound/${url}_full.json`
if (url == '710000') {
curUrl = `https://geo.datav.aliyun.com/areas_v3/bound/${url}.json`
}
const data = await getMapList({
city: type == 'city' ? url : '',
province: type == 'country' ? '' : this.provinceData.code,
})
let formateArr = []
if (data && data.length) {
data.forEach((item) => {
let iconList = []
if (item.useMaterialNumber) iconList.push('useMaterialNumber')
if (item.freeMaterialNumber) iconList.push('freeMaterialNumber')
if (item.demandMaterialNumber) iconList.push('demandMaterialNumber')
if (!iconList.length) iconList.push('defaultIcon')
let arr = data.filter((child) => child.lat === item.lat && child.lng === item.lng)
if (arr.length > 0) {
item.childs = arr.map((item) => {
return {
value: [item.lng, item.lat, item.projectName, item.stage],
lineData: [item.useMaterialNumber || 0, item.freeMaterialNumber || 0, item.demandMaterialNumber || 0],
iconList,
...item,
}
})
} else {
item.childs = []
}
if (item.childs.length) {
let sarr = formateArr.filter((child) => child.lat === item.lat && child.lng === item.lng)
if (!sarr.length) {
let obj = JSON.parse(JSON.stringify(item))
let curData = {
value: [item.lng, item.lat, item.projectName, item.stage],
// lineData: [item.useMaterialNumber || 0, item.freeMaterialNumber || 0, item.demandMaterialNumber || 0],
iconList,
...obj,
}
formateArr.push(curData)
}
} else {
let obj = JSON.parse(JSON.stringify(item))
let curData = {
value: [item.lng, item.lat, item.projectName, item.stage],
// lineData: [item.useMaterialNumber || 0, item.freeMaterialNumber || 0, item.demandMaterialNumber || 0],
iconList,
...obj,
}
formateArr.push(curData)
}
})
}
this.mapList = formateArr.length > 0 ? [...formateArr] : []
axios
.get(curUrl)
.then((res) => {
this.mapCode = url
this.mapName = name
this.mapType = type
const mapData = res.data
this.mapJson = mapData
const jsonMap = { mark: this.mapName, json: mapData }
this.mapOpt = this.getSimpleMap(jsonMap, formateArr, newMap)
})
.catch(() => {})
},
getSimpleMap(jsonMap, data, newMap) {
let mapName = jsonMap.mark == '中国' ? 'china' : jsonMap.mark
let mapData = jsonMap.mark == '中国' ? chinaData : jsonMap.json
if (!echarts.getMap(jsonMap.mark)) {
echarts.registerMap(mapName, mapData)
}
const defaultConfig = {
tooltip: {
// 窗口外框
trigger: 'item',
formatter: () => {
return ''
},
},
geo: [
{
map: mapName,
type: 'map',
layoutCenter: ['50%', '50%'],
layoutSize: '100%',
zoom: 0.9,
// top: 'top',
// left: 20,
roam: false,
itemStyle: {
borderColor: '#00C4A7',
borderWidth: 4,
areaColor: {
image: this.domImg, //
repeat: 'repeat', // // 是否平铺,可以是 'repeat-x', 'repeat-y', 'no-repeat'
},
shadowColor: 'rgb(13,92,79)',
shadowOffsetX: 2,
shadowOffsetY: 4,
},
regions: [
//单独设置南海展示
{
name: '南海诸岛',
value: 0,
itemStyle: {
borderWidth: 0,
shadowColor: 'rgb(13,92,79)',
shadowOffsetX: 2,
shadowOffsetY: 2,
},
},
],
emphasis: {
disabled: true,
tooltip: {
show: false,
},
},
},
{
map: mapName,
type: 'map',
layoutCenter: ['50%', '50%'],
layoutSize: '100%',
zoom: 0.9,
// top: 'top',
// left: 20,
roam: false,
zlevel: -2,
tooltip: {
show: false,
},
itemStyle: {
areaColor: {
image: this.domImg, //
repeat: 'repeat', // // 是否平铺,可以是 'repeat-x', 'repeat-y', 'no-repeat'
},
shadowColor: 'rgb(14,102,88)',
shadowOffsetX: 4,
shadowOffsetY: 6,
},
regions: [
{
name: '南海诸岛',
value: 0,
itemStyle: {
shadowColor: 'rgb(14,102,88)',
shadowOffsetX: 3,
shadowOffsetY: 3,
},
},
],
},
{
map: mapName,
type: 'map',
layoutCenter: ['50%', '50%'],
layoutSize: '100%',
zoom: 0.9,
tooltip: {
show: false,
},
// top: 'top',
// left: 20,
roam: false,
zlevel: -3,
itemStyle: {
areaColor: {
image: this.domImg, //
repeat: 'repeat', // // 是否平铺,可以是 'repeat-x', 'repeat-y', 'no-repeat'
},
shadowColor: 'rgb(20,140,121)',
shadowOffsetX: 5,
shadowOffsetY: 10,
},
regions: [
{
name: '南海诸岛',
value: 0,
itemStyle: {
shadowColor: 'rgb(20,140,121)',
shadowOffsetX: 4,
shadowOffsetY: 4,
},
},
],
},
{
map: mapName,
type: 'map',
tooltip: {
show: false,
},
layoutCenter: ['50%', '50%'],
layoutSize: '100%',
zoom: 0.9,
// top: 'top',
// left: 20,
roam: false,
zlevel: -5,
itemStyle: {
areaColor: {
image: this.domImg, //
repeat: 'repeat', // // 是否平铺,可以是 'repeat-x', 'repeat-y', 'no-repeat'
},
shadowColor: 'rgb(36,185,161)',
shadowOffsetX: 6,
shadowOffsetY: 14,
},
regions: [
{
name: '南海诸岛',
value: 0,
itemStyle: {
shadowColor: 'rgb(25,178,154)',
shadowOffsetX: 5,
shadowOffsetY: 5,
},
},
],
},
],
series: [
{
type: 'map',
map: mapName, // 自定义扩展图表类型
animation: false,
// 点击选中后的效果
top: 'top',
left: 'left',
zoom: 0.9,
select: {
//不设置会有默认颜色
label: {
show: false,
},
// 清除点击选中后的背景色
itemStyle: {
color: null,
},
},
itemStyle: {
// 地图样式
borderColor: 'rgba(255,255,255,0.25)',
borderWidth: 1,
areaColor: {
image: this.domImg, //
repeat: 'repeat', // // 是否平铺,可以是 'repeat-x', 'repeat-y', 'no-repeat'
},
},
label: {
show: false,
color: '#FFFFFF',
fontSize: 12,
fontWeight: 400,
},
emphasis: {
// 鼠标移入动态的时候显示的默认样式
label: {
show: true,
color: '#FFFFFF',
fontSize: 15,
fontWeight: 600,
},
itemStyle: {
areaColor: {
//鼠标悬浮背景色
type: 'linear',
x: 0,
y: 0,
x2: 0,
y2: 1,
colorStops: [
{
offset: 0,
color: 'rgba(30, 139, 114,0.8)', // 0% 处的颜色
},
{
offset: 1,
color: 'rgba(30, 139, 114,0.2)', // 100% 处的颜色
},
],
global: false, // 缺省为 false
},
borderColor: '#FFFFFF',
borderWidth: 2,
},
},
layoutCenter: ['50%', '50%'],
layoutSize: '100%',
},
{
type: 'scatter',
coordinateSystem: 'geo',
symbol: (value, param) => {
return iconObj[param.data.iconList[this.iconIndex % param.data.iconList.length]]
},
symbolSize: [26, 30],
label: {
show: false,
},
itemStyle: {
color: 'rgba(255, 178, 76, 1)',
},
tooltip: {
// 窗口外框
trigger: 'item',
position: 'top',
padding: 0,
borderWidth: 0,
borderColor: '#FFFFFF',
backgroundColor: 'rgba(30, 139, 114, 0.8)', //调整tooltip背景透明度
opacity: 0.8,
formatter: (params) => {
// const { data } = params
const childs = params.data.childs
const str = `
<div>
${childs
.map((data) => {
return `
<div style="padding:12px;
color: #fff;text-align:left;">
<div style="font-size: 18px;font-weight: 400;line-height: 21px;color: #FFFFFF;">
${data.value[2]}
</div>
<div style="font-size: 12px;font-weight: 400;color: #FFFFFF;padding-top:4px;padding-bottom:8px;border-bottom:${
data.lineData[0] || data.lineData[1] || data.lineData[2] ? '1px solid #ffffff' : 'none'
}">项目阶段:${data.value[3]}</div>
<div style="display:${data.lineData[0] || data.lineData[1] || data.lineData[2] ? 'flex' : 'none'}" >
${data.lineData
.map((item, index) => {
return `
<div style="margin-top:8px;margin-bottom:16px;width:${item + '%'};height:8px;background:${
index == 0 ? '#6CE6C9' : index == 1 ? '#E7AF1D' : '#3987FF'
}"></div>
`
})
.join('')}
</div>
<div style="display:${data.lineData[0] || data.lineData[1] || data.lineData[2] ? 'flex' : 'none'};flex-wrap: wrap;" >
${data.lineData
.map((item, index) => {
return `<div style="width:50%;display:flex;align-items:center">
<div style="width:4px;height:10px;background:${index == 0 ? '#6CE6C9' : index == 1 ? '#E7AF1D' : '#3987FF'}"></div>
<div style="margin-left:8px">
<div style="color: #D8FDF9;font-size: 12px;">${
index == 0 ? '使用中物资量' : index == 1 ? '闲置物资量' : '新需物资量'
}</div>
<div style="color: #FFFFFF;font-size: 16px;">${item || '--'}</div>
</div>
</div>`
})
.join('')}
</div>
</div>
`
})
.join('')}
</div>
`
return str
},
},
data: data,
showEffectOn: 'render',
rippleEffect: {
show: false,
brushType: 'fill',
number: 1,
},
zlevel: 9,
},
],
}
const opt = Object.assign({}, defaultConfig)
const { legend, tooltip, series, geo, grid } = opt
const chartOpt = {
grid,
legend,
tooltip,
geo,
series,
newMap: newMap,
animation: false,
}
return chartOpt
},
// 返回上一级
backType() {
if (this.mapType == 'province') {
this.intervalInitMap(100000, '中国', 'country')
} else if (this.mapType == 'city') {
this.intervalInitMap(this.provinceData.code, this.provinceData.name, 'province')
}
},
getCountryData() {
getProvincesCode().then((res) => {
if (res && res.length > 0) {
this.provinceCodeList = [...res]
}
})
},
startInterval() {
this.iconInterval = setInterval(() => {
if (this.iconIndex < 2) {
this.iconIndex = this.iconIndex + 1
} else {
this.iconIndex = 0
}
this.mapOpt = this.getSimpleMap({ mark: this.mapName, json: this.mapJson }, this.mapList, false)
}, 5000)
},
clearIconInterval() {
if (this.iconInterval) {
clearInterval(this.iconInterval)
this.iconInterval = null
}
},
},
}
</script>
<style lang="scss" scoped>
.echartMapTestView {
padding: 10px;
width: 100%;
// height: 1000px;
margin-top: -40px;
.map-view {
height: 100%;
}
}
</style>
chartView.vue
<!--
    图表
    @params: width 宽度
    @params: height 高度
    @params: autoResize 是否自动调整大小
    @params: chartOption 图表的配置
-->
<template>
  <div class="chart" :style="{ height: height, width: width }">
    <div ref="chart" class="test-bg" :style="{ height: height, width: width }"></div>
    <div class="float-content">
      <span class="area-name">当前地区:{{ mapName }}</span>
      <div class="back-content" v-if="mapName != '中国'">
        <img src="@/assets/images/cockpit/undo.svg" /><span class="back-btn" @click="backType"> 返回上一级</span>
      </div>
    </div>
  </div>
</template>
<script>
// 引入 echarts 核心模块,核心模块提供了 echarts 使用必须要的接口。
import * as echarts from 'echarts/core'
// 引入柱状图图表,图表后缀都为 Chart
import { BarChart } from 'echarts/charts'
// 引入提示框,标题,直角坐标系组件,组件后缀都为 Component
import { TitleComponent, TooltipComponent, GridComponent } from 'echarts/components'
// 引入 Canvas 渲染器,注意引入 CanvasRenderer 或者 SVGRenderer 是必须的一步
import { CanvasRenderer } from 'echarts/renderers'

// 注册必须的组件
echarts.use([TitleComponent, TooltipComponent, GridComponent, BarChart, CanvasRenderer])

export default {
  name: 'ChartView',
  props: {
    width: {
      type: String,
      default: '100%',
    },
    mapName: {
      type: String,
      default: '全国',
    },
    height: {
      type: String,
      default: '350px',
    },
    autoResize: {
      type: Boolean,
      default: true,
    },
    chartOption: {
      type: Object,
      required: true,
    },
    type: {
      type: String,
      default: 'canvas',
    },
    playHighlight: {
      type: Boolean,
      default: false,
    },
  },
  data() {
    return {
      chart: null,
      // 动画定时器
      iconDataIndex: null,
      areaDataIndex: null,
    }
  },
  watch: {
    chartOption: {
      deep: true,
      handler(newVal) {
        this.setOptions(newVal)
      },
    },
  },
  mounted() {
    this.initChart()
    if (this.autoResize) {
      window.addEventListener('resize', this.resizeHandler)
    }
  },
  beforeDestroy() {
    if (!this.chart) {
      return
    }
    if (this.autoResize) {
      window.removeEventListener('resize', this.resizeHandler)
    }
    this.chart.dispose()
    this.chart = null
  },
  methods: {
    resizeHandler() {
      this.chart.resize()
    },
    initChart() {
      this.chart = echarts.init(this.$refs.chart, '', {
        renderer: this.type,
      })
      this.chart.setOption(this.chartOption)
      this.chart.on('click', this.handleClick)
      this.chart.on('mousemove', this.handleMousemove)
      this.chart.getZr().on('mousemove', this.handleMouseout)
    },
    handleClick(params) {
      this.$emit('click', params)
    },
    handleMousemove(params) {
      if (params.seriesType == 'scatter') {
        this.iconDataIndex = params.dataIndex
        this.areaDataIndex = null
      } else if (params.seriesType == 'map') {
        this.iconDataIndex = null
        // 切换地图悬浮切换高亮部分
        if (this.areaDataIndex !== null && this.areaDataIndex != params.dataIndex) {
          this.chart.dispatchAction({
            type: 'downplay',
            seriesIndex: 0,
            dataIndex: this.areaDataIndex,
          })
        }

        this.areaDataIndex = params.dataIndex
      }
    },
    handleMouseout(event) {
      if (!event.target) {
        if (this.iconDataIndex !== null) {
          this.chart.dispatchAction({
            type: 'hideTip',
            seriesIndex: 1,
            dataIndex: this.iconDataIndex,
          })
        } else if (this.areaDataIndex !== null) {
          this.chart.dispatchAction({
            type: 'downplay',
            seriesIndex: 0,
            dataIndex: this.areaDataIndex,
          })
        }

        this.iconDataIndex = null
        this.areaDataIndex = null
      }
    },
    setOptions(option) {
      this.clearChart()
      this.resizeHandler()
      if (this.chart) {
        this.chart.setOption(option)
        if (option.newMap) return
        if (this.iconDataIndex !== null) {
          this.chart.dispatchAction({
            type: 'showTip',
            seriesIndex: 1,
            dataIndex: this.iconDataIndex,
          })
        } else if (this.areaDataIndex !== null) {
          this.chart.dispatchAction({
            type: 'highlight',
            seriesIndex: 0,
            dataIndex: this.areaDataIndex,
          })
        }
      }
    },
    refresh() {
      this.setOptions(this.chartOption)
    },
    clearChart() {
      this.chart && this.chart.clear()
    },
    backType() {
      this.$emit('backType')
    },
  },
}
</script>
<style scoped lang="scss">
.chart {
  position: relative;
}

.test-bg {
  background-image: url('@/assets/images/cockpit/white-bg.png');
  background-size: cover;
  // background-color: aquamarine;
}
.float-content {
  position: absolute;
  bottom: 0;
  left: 0;
  z-index: 999;
  width: 100%;
  display: flex;
  align-items: center;
  justify-content: center;
  .area-name {
    font-size: 28px;
    font-weight: 600;
    font-style: italic;
    color: #086c61;
    line-height: 40px;
  }
  .back-btn {
    font-size: 16px;
    font-family: Microsoft YaHei-Regular, Microsoft YaHei;
    font-weight: 400;
    color: #06645a;
    line-height: 19px;
  }
  .back-content {
    margin-left: 20px;
    display: flex;
    align-content: center;
    cursor: pointer;
    img {
      width: 16px;
      height: 16px;
    }
  }
}
</style>

![[C++] 为什么头文件最好只做声明](https://img-blog.csdnimg.cn/ea931934be3544158cf5073239a08651.png)