一。概述
架构图:

拓扑图:

prometheus 是一个开源系统,用于构建监控和报警的工具包。
Prometheus 收集其指标并将其存储为时间序列数据,即指标信息与记录它的时间戳一起存储,以及称为标签的可选键值对。
特点:
- 具有由指标名称和键/值对标识的时间序列数据的多维数据模型
- PromQL,一种灵活的查询语言,可利用此维度
- 不依赖分布式存储;单服务器节点是自治的
- 时序收集通过 HTTP 上的拉取模型进行
- 通过中间网关支持推送时间序列
- 通过服务发现或静态配置发现目标
- 多种图形和仪表板支持模式
如上图所示:采集层负责数据的获取 ,支持多种exporters Download | Prometheus支持什么可以去官网查看 应用层支持报表展示和报警发出
二。部署
部署prometheus
(1) docker 部署 我这个是windows环境后面也可以是linux 一样的 或者去下载安装包
Download | Prometheus
docker run -p 9090:9090 -d -v C:/Users/E2/Desktop/dockerv/prometheus:/opt/bitnami/prometheus/conf bitnami/prometheus在docker 挂载目录添加配置文件prometheus.yml :
# my global config
global:
  scrape_interval:     15s # 设置多久获取一次数据
  evaluation_interval: 15s # 多久更新一次 报警规则
  # scrape_timeout is set to the global default (10s).

# Alertmanager 配置
alerting:
  alertmanagers:
  - static_configs:
    - targets:
      #alertManager 服务因为我这个alertManager 没有容器部署放到本地所以这样
      - host.docker.internal:9093

# 加载报警规则文件
rule_files:
   - "first_rules.yml"
  # - "second_rules.yml"

# A scrape configuration containing exactly one endpoint to scrape:
# Here it's Prometheus itself.
scrape_configs:
  # The job name is added as a label `job=<job_name>` to any timeseries scraped from this config.
  - job_name: 'prometheus'

    # 监管自身
    # scheme defaults to 'http'.

    static_configs:
    - targets: ['localhost:9090']
  #springboot的监控
  - job_name: guanwang-service
    metrics_path: /actuator/prometheus
 # spring boot 项目地址和端口注意下监控
    static_configs:
    - targets: ['host.docker.internal:2020']
      labels:
        applicaton: guanwang-kelk
        env: dev
 # 黑盒测试配置文件这个只使用了http_2xx 来测接口可用性
  - job_name: 'http_status'
    metrics_path: /probe
    params:
      module: [http_2xx]
    file_sd_configs:
      - files:
        - '/opt/bitnami/prometheus/conf/job_web.yaml'
        refresh_interval: 30s
    relabel_configs:
      - source_labels: [__address__]
        target_label: __param_target
      - target_label: __address__
        #blackbox_exporter 的服务端口
        replacement: host.docker.internal:9115
  #云场站admin模块
  - job_name: yun-admin-service
    metrics_path: /sys/actuator/prometheus
    static_configs:
    - targets: ['host.docker.internal:8080']
      labels:
        applicaton: yun-admin-service
        env: dev
添加报警规则 (这个需要 alertManager 服务的支持 安装在后面说明 )配置文件 就是上一个配置文件引入的那个 first_rules.yml 其他的可以看看文档自己去判断筛选和数值
groups:
- name: 生产GIS接口监控
  rules:
  - alert: geoServer接口功能报警
    #筛选数据 查出来就会报警 这个判断黑盒测试的接口状态不为200 的
    expr: probe_http_status_code{project="geoserver"} !=200
    for: 15s
    labels:
      severity: 严重
    annotations:
      description: "接口出现异常:{{ $labels.project }}"
      summary: "Web 访问异常:{{ $labels.desc }}:已无法访问"
添加黑盒测试配置文件 (这个需要你去下载 blackbox_exporter 安装支持可以帮你去测试接口可用性和接口时间) job_web.yaml
- targets:
  - https://*/geoserver/ows?service=WFS&version=1.1.0&request=GetFeature&typeName=ne%3Acloud_pipe_line_1&startIndex=0&propertyName=shape%2Cconduit_material%2Cconduit_type%2Cconduit_id%2Csection_no%2Cburying_type%2Csection_length%2Cstart_burying%2Cend_burying&outputFormat=application%2Fjson&maxFeatures=5000&srsName=EPSG%3A4326&cql_filter=tenant_id%3D871009%20and%20conduit_id%20IS%20NULL&_t=1688970060542
  labels:
    env: test
    app: web
    project: geoserver
    desc: geoserver要素查询
- targets:
  - https://*/geoserver/ow?service=WFS&version=2.0.0&request=GetFeature&typeName=ne%3Acloud_customer_1&propertyName=shape%2Ccustomer_name%2Ccustomer_type%2Ctelephone%2Ccustomer_addr%2Cdoc_number&outputFormat=application%2Fjson&maxFeatures=100000&srsName=EPSG%3A4326&startIndex=0&service=WFS&version=2.0.0&request=GetFeature&typeName=ne%3Acloud_customer_1&propertyName=shape%2Ccustomer_name%2Ccustomer_type%2Ctelephone%2Ccustomer_addr%2Cdoc_number&outputFormat=application%2Fjson&maxFeatures=100000&srsName=EPSG%3A4326&startIndex=0
  labels:
    env: test
    app: web
    project: geoserver
    desc: geoserver爆管分析
    not_200: yes # 这个自定义标签是为了标识某些地址在正常情况下不是返回200状态码
2.搭建 blackBox_exproter 先去官网下载 完成后启动项目 默认的配置文件
modules:
  http_2xx:
    prober: http
    http:
      preferred_ip_protocol: "ip4"
  http_post_2xx:
    prober: http
    http:
      method: POST
  tcp_connect:
    prober: tcp
  pop3s_banner:
    prober: tcp
    tcp:
      query_response:
      - expect: "^+OK"
      tls: true
      tls_config:
        insecure_skip_verify: false
  grpc:
    prober: grpc
    grpc:
      tls: true
      preferred_ip_protocol: "ip4"
  grpc_plain:
    prober: grpc
    grpc:
      tls: false
      service: "service1"
  ssh_banner:
    prober: tcp
    tcp:
      query_response:
      - expect: "^SSH-2.0-"
      - send: "SSH-2.0-blackbox-ssh-check"
  irc_banner:
    prober: tcp
    tcp:
      query_response:
      - send: "NICK prober"
      - send: "USER prober prober prober :prober"
      - expect: "PING :([^ ]+)"
        send: "PONG ${1}"
      - expect: "^:[^ ]+ 001"
  icmp:
    prober: icmp
  icmp_ttl5:
    prober: icmp
    timeout: 5s
    icmp:
      ttl: 5
代表黑盒测试支持那些类型的测试一般不用改,之前有dns 测试需要添加额外的配置
3.搭建alertManager 也是去官方下载 启动 修改配置文件
global:
  smtp_smarthost: 'smtp.163.com:25'
  smtp_from: 'XX@163.com'
  smtp_auth_username: 'XX@163.com'
  smtp_auth_password: 'XX'
  smtp_require_tls: false
templates:
  - 'C:/Users/E2/Desktop/dockerv/alertmanager-0.25.0.windows-amd64/alertmanager-0.25.0.windows-amd64/data/tml/*.tmpl'
route:
  group_by: ['alertname']
  group_wait: 30s
  group_interval: 5m
  repeat_interval: 1h
  receiver: 'mail'
receivers:
  - name: 'mail'
    email_configs:
        #可以配置多个用,链接
      - to: 'XX@qq.com'
        send_resolved: true
        html: '{{ template "email.tmpl" . }}'
inhibit_rules:
  - source_match:
      severity: 'critical'
    target_match:
      severity: 'warning'
    equal: ['alertname', 'dev', 'instance']
我这面只配置了邮件 默认是web_hook 需要你自己去实现接口还支持企业微信这个要自己去看下怎么选择和配置了
配置邮件发送显示的模版 :
{{ define "email.tmpl" }}
{{ range .Alerts }}
 <pre>
实例: {{ .Labels.instance }}
信息: {{ .Annotations.summary }}
详情: {{ .Annotations.description }}
时间: {{ .StartsAt.Format "2006-01-02 15:04:05" }}
 </pre>
{{ end }}
{{ end }}
C:/Users/E2/Desktop/dockerv/alertmanager-0.25.0.windows-amd64/alertmanager-0.25.0.windows-amd64/data/tml/*.tmpl 我的放置路径文件当中也有配置
4.spring boot 接入 刚刚prometheus.yml 配置了一个spring boot项目的监管,现在项目需要做支持
引入依赖 项目
	<dependency>
			<groupId>org.springframework.boot</groupId>
			<artifactId>spring-boot-starter-actuator</artifactId>
		</dependency>

		<dependency>
			<groupId>io.micrometer</groupId>
			<artifactId>micrometer-registry-prometheus</artifactId>
		</dependency>
使用了springfox swagger 可能会报错 要通过代码配置暴露所有
    @Bean
    public WebMvcEndpointHandlerMapping webEndpointServletHandlerMapping(
            WebEndpointsSupplier webEndpointsSupplier, ServletEndpointsSupplier servletEndpointsSupplier,
            ControllerEndpointsSupplier controllerEndpointsSupplier, EndpointMediaTypes endpointMediaTypes,
            CorsEndpointProperties corsProperties, WebEndpointProperties webEndpointProperties, Environment environment) {
        List<ExposableEndpoint<?>> allEndpoints = new ArrayList<>();
        Collection<ExposableWebEndpoint> webEndpoints = webEndpointsSupplier.getEndpoints();
        allEndpoints.addAll(webEndpoints);
        allEndpoints.addAll(servletEndpointsSupplier.getEndpoints());
        allEndpoints.addAll(controllerEndpointsSupplier.getEndpoints());
        String basePath = webEndpointProperties.getBasePath();
        EndpointMapping endpointMapping = new EndpointMapping(basePath);
        boolean shouldRegisterLinksMapping = webEndpointProperties.getDiscovery().isEnabled() &&
                (StringUtils.hasText(basePath) || ManagementPortType.get(environment).equals(ManagementPortType.DIFFERENT));
        return new WebMvcEndpointHandlerMapping(endpointMapping, webEndpoints, endpointMediaTypes,
                corsProperties.toCorsConfiguration(), new EndpointLinksResolver(allEndpoints, basePath),
                shouldRegisterLinksMapping, null);
    }
/**
* @author chenkang
* @date 2023/7/11 16:02
*/
@Configuration
public class PrometheusConfig {
@Resource
private ModuleConfig moduleConfig;
@Bean
MeterRegistryCustomizer<MeterRegistry> metricsCommonTags() {
return registry -> registry.config().commonTags("application",moduleConfig.getName());
}
}不然yaml 配置就可以:
management:
  endpoint:
    prometheus:
      enabled: true
    metrics:
      enabled: true
  metrics:
    export:
      prometheus:
        enabled: true
    tags:
      #这个尽量去配置不然你用好多面板模版的时候 会只认这个标签
      application: menhu-guanwang
5.安装 grafana 也是docker 这面--link 了刚刚安装的prometheus 不然连不上
docker run -d --name grafana -p 3000:3000 -v C:/Users/E2/Desktop/dockerv/grafana/data:/var/lib/grafana --link d13cacf78b0ecd41271542c3bd393948aee07b31ebfe880d4b4ad5b73e66d02f:prometheus grafana/grafana
启动后访问3000 默认的账号密码是admin/admin 登陆后修改密码 现在启动所有项目

选择创建数据源:
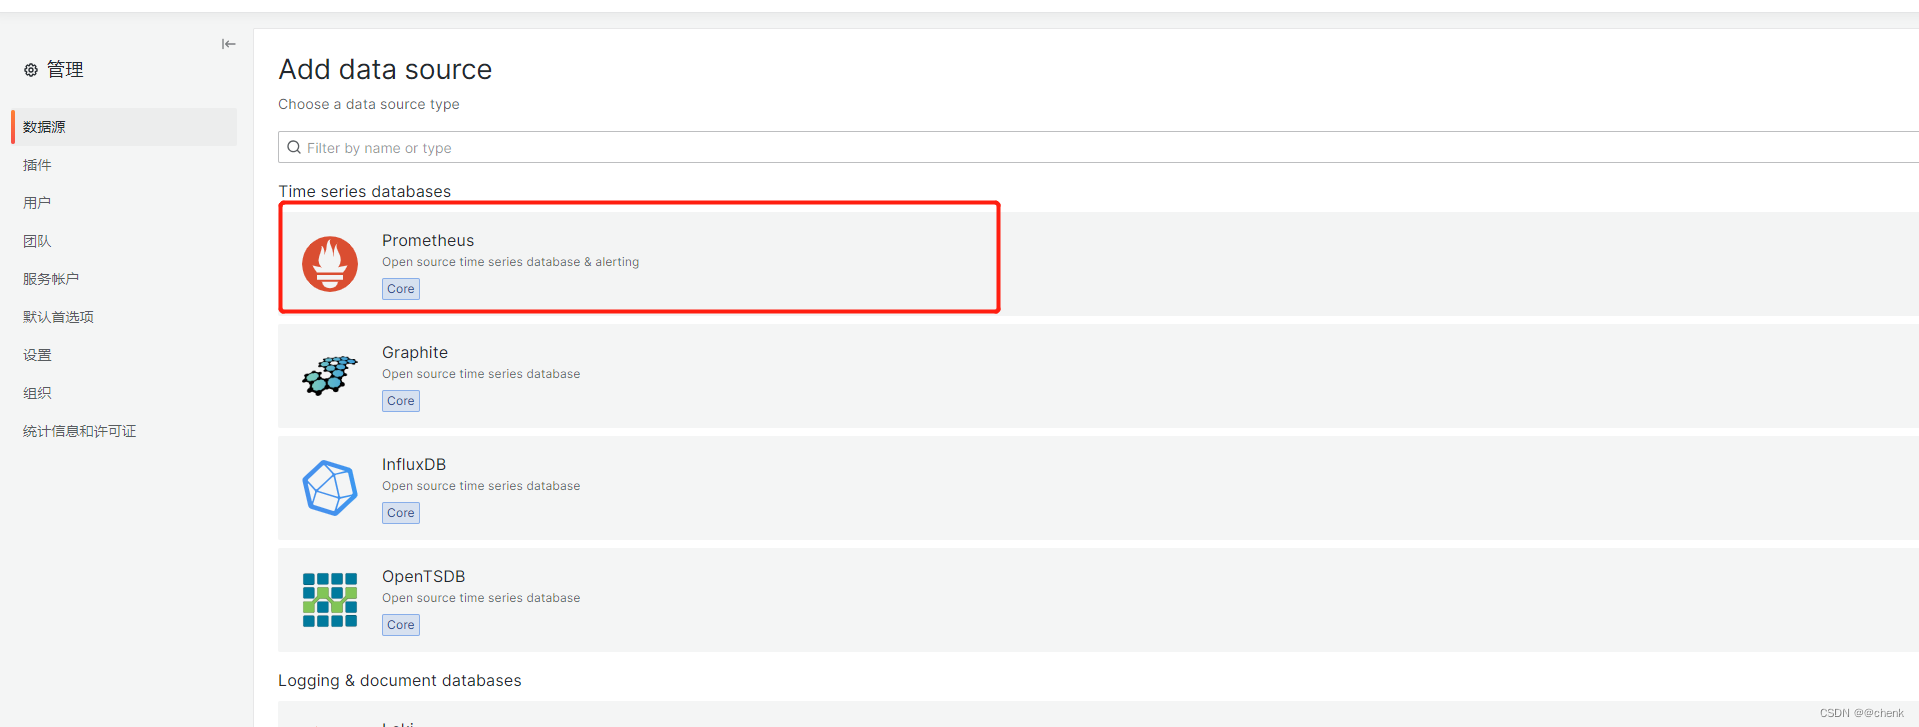

因为我这个是docker装的host 就是填写link 起的别名如果你是安装包直接填写ip 我的是最新版本所以版本
链接成功了就:
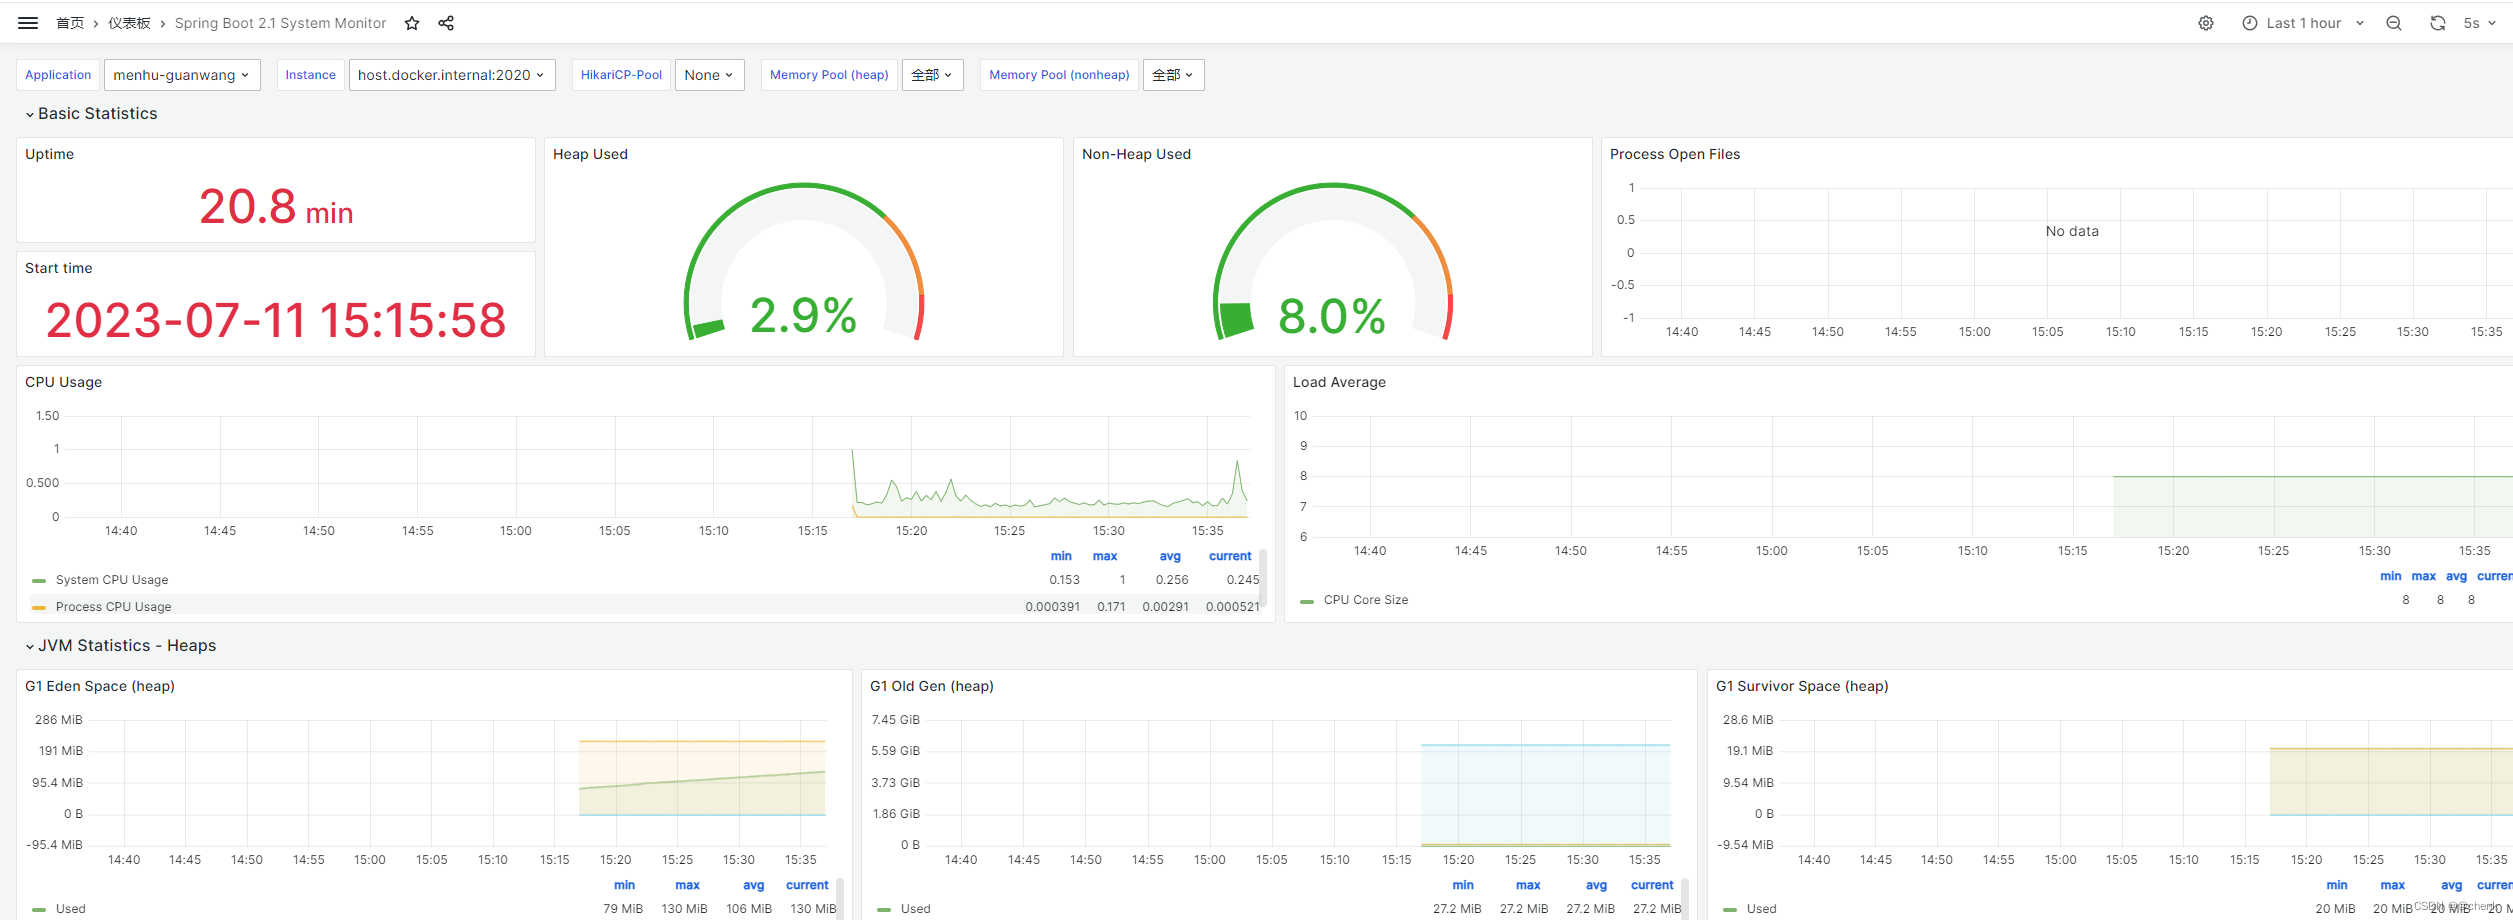
6.配置grafana 面板
官方已经做好了很多的面板模版 不用你自己配置,自己想配置也行 官方的模版地址
Dashboards | Grafana Labs
spring boot 那块:
我用的模版ID 10280

仪表盘选择导入选择 模版ID 点击确定
想监管服务的响应时间 可以使用 micrometer-registry-prometheus @Timed注解 和 @Counted 注解 不然也是会带的 只不过不细分
黑盒测试:新增一个面板
模版ID 找不到了