目录
1.Prometheus环境搭建
1.1 下载和安装Prometheus
1.2 配置Prometheus
1.3 配置Prometheus抓取Spring Boot应用Metrics
1.4 启动Prometheus
2.Grafana环境搭建
2.1 下载和安装Grafana
2.2 配置Grafana数据源
2.3 创建Dashboard
3、NodeExporter(服务器监控)插件配置安装
3.1 下载和安装Node Exporter 插件
3.2配置prometheus.yml
3.3配置Grafana
3.4遇到的坑及解决方法
4、Spring boot应用的监控配置
4.1 springboot工程pom.xml 配置
4.2 application.properties或application.yml 配置
4.3 定义Prometheus监控任务
4.4 配置Grafana的dashboard
1.Prometheus环境搭建
1.1 下载和安装Prometheus
访问Prometheus官方网站(https://prometheus.io/download/),下载适合操作系统的Prometheus版本。解压下载的文件,将包含Prometheus二进制文件和配置文件的目录放在合适的位置。
1.2 配置Prometheus
在Prometheus的安装目录中,找到prometheus.yml配置文件。打开并编辑该文件,以配置Prometheus以抓取Spring Boot应用程序的指标数据。
1.3 配置Prometheus抓取Spring Boot应用Metrics
在prometheus.yml文件中,找到scrape_configs部分,并添加一个新的抓取配置,如下所示:
scrape_configs:
- job_name: 'spring_boot_app'
metrics_path: '/actuator/prometheus'
static_configs:
- targets: ['localhost:8080'] # 使用你的Spring Boot应用程序的实际主机和端口替换在此配置中,我们指定了应用程序的/actuator/prometheus端点作为Prometheus抓取指标数据的路径。确保将targets中的localhost:8080替换为你的Spring Boot应用程序的实际主机名和端口号。
以下是我机器的实际配置:
# my global config

global:

  scrape_interval: 5s # Set the scrape interval to every 15 seconds. Default is every 1 minute.

  evaluation_interval: 5s # Evaluate rules every 15 seconds. The default is every 1 minute.

  # scrape_timeout is set to the global default (10s).


# Alertmanager configuration

alerting:

  alertmanagers:

    - static_configs:

        - targets:

          # - alertmanager:9093


# Load rules once and periodically evaluate them according to the global 'evaluation_interval'.

rule_files:

  # - "first_rules.yml"

  # - "second_rules.yml"


# A scrape configuration containing exactly one endpoint to scrape:

# Here it's Prometheus itself.

# scrape_configs:

  # The job name is added as a label `job=<job_name>` to any timeseries scraped from this config.

#   - job_name: "prometheus"


    # metrics_path defaults to '/metrics'

    # scheme defaults to 'http'.


#     static_configs:

 #      - targets: ["localhost:9090"]


scrape_configs:


  - job_name: 'springboot-69-8084'

    metrics_path: '/actuator/prometheus'

    static_configs:

      - targets: ['localhost:8084'] # 使用你的Spring Boot应用程序的实际主机和端口替换


  - job_name: 'springboot-69-8082'

    metrics_path: '/actuator/prometheus'

    static_configs:

      - targets: ['localhost:8082'] # 使用你的Spring Boot应用程序的实际主机和端口替换


  - job_name: 'springboot-69-8761'

    metrics_path: '/actuator/prometheus'

    static_configs:

      - targets: ['localhost:8761'] # 使用你的Spring Boot应用程序的实际主机和端口替换


  - job_name: "nacos_162_8848"

    metrics_path: '/actuator/prometheus'

    static_configs:

      - targets: ['192.168.3.162:8848']


  - job_name: "prometheus_162"

    static_configs:

      - targets: ["192.168.3.162:9090"]


  - job_name: "prometheus_69"

    static_configs:

      - targets: ["192.168.3.69:9090"]


  - job_name: "linux_exporter_162"

    metrics_path: '/metrics'

    static_configs:

      - targets: ["192.168.3.162:9100"]


  - job_name: order-jvm  #监控Job名称

    static_configs:

- targets: ['localhost:8314'] #待监控机器列表,node exporter默认端口9100,多台机器用“,”分隔。1.4 启动Prometheus
在Prometheus的安装目录中,使用命令行运行以下命令以启动Prometheus:
- 对于Linux/macOS:
./prometheus --config.file=prometheus.yml- 对于Windows:
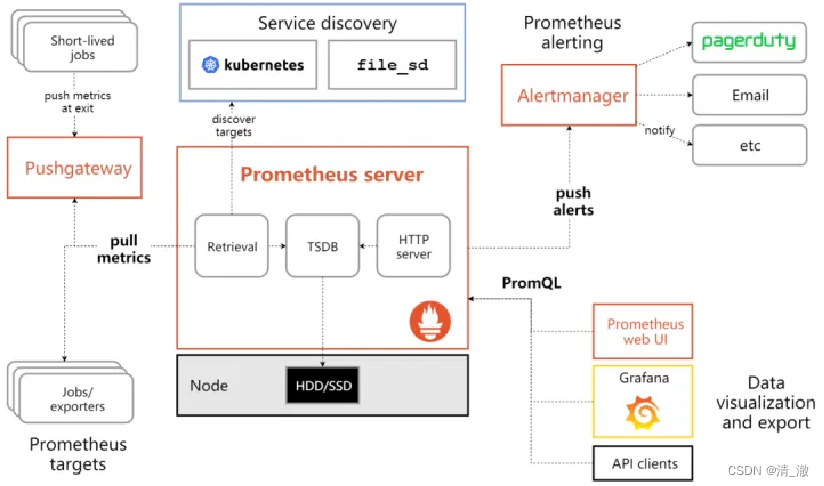
prometheus.exe --config.file=prometheus.yml现在,Prometheus已经开始运行并监控你的Spring Boot应用程序的指标数据。接下来,需要安装和配置Grafana,以实现指标数据的可视化。
启动成功日志如下

浏览器访问: http://localhost:9090/targets?search=

2.Grafana环境搭建
2.1 下载和安装Grafana
访问Grafana官方网站(https://grafana.com/grafana/download/),下载适合你操作系统的Grafana版本。安装完成后,按照Grafana官方文档中的说明启动Grafana服务。
Windows版本,直接安装运行即可
grafana-enterprise-10.0.1.windows-amd64.msi
Linux版本:
sudo yum install -y https://dl.grafana.com/enterprise/release/grafana-enterprise-10.0.1-1.x86_64.rpm修改配置文件 /etc/grafana/grafana.ini 中端口为3001,并重启
[root@grafana ~]# systemctl daemon-reload

[root@grafana ~]# systemctl start grafana-server

[root@grafana ~]# systemctl enable grafana-server

[root@grafana ~]# systemctl status grafana-server
浏览器访问:
http://192.168.3.162:3001/ admin / admin

2.2 配置Grafana数据源
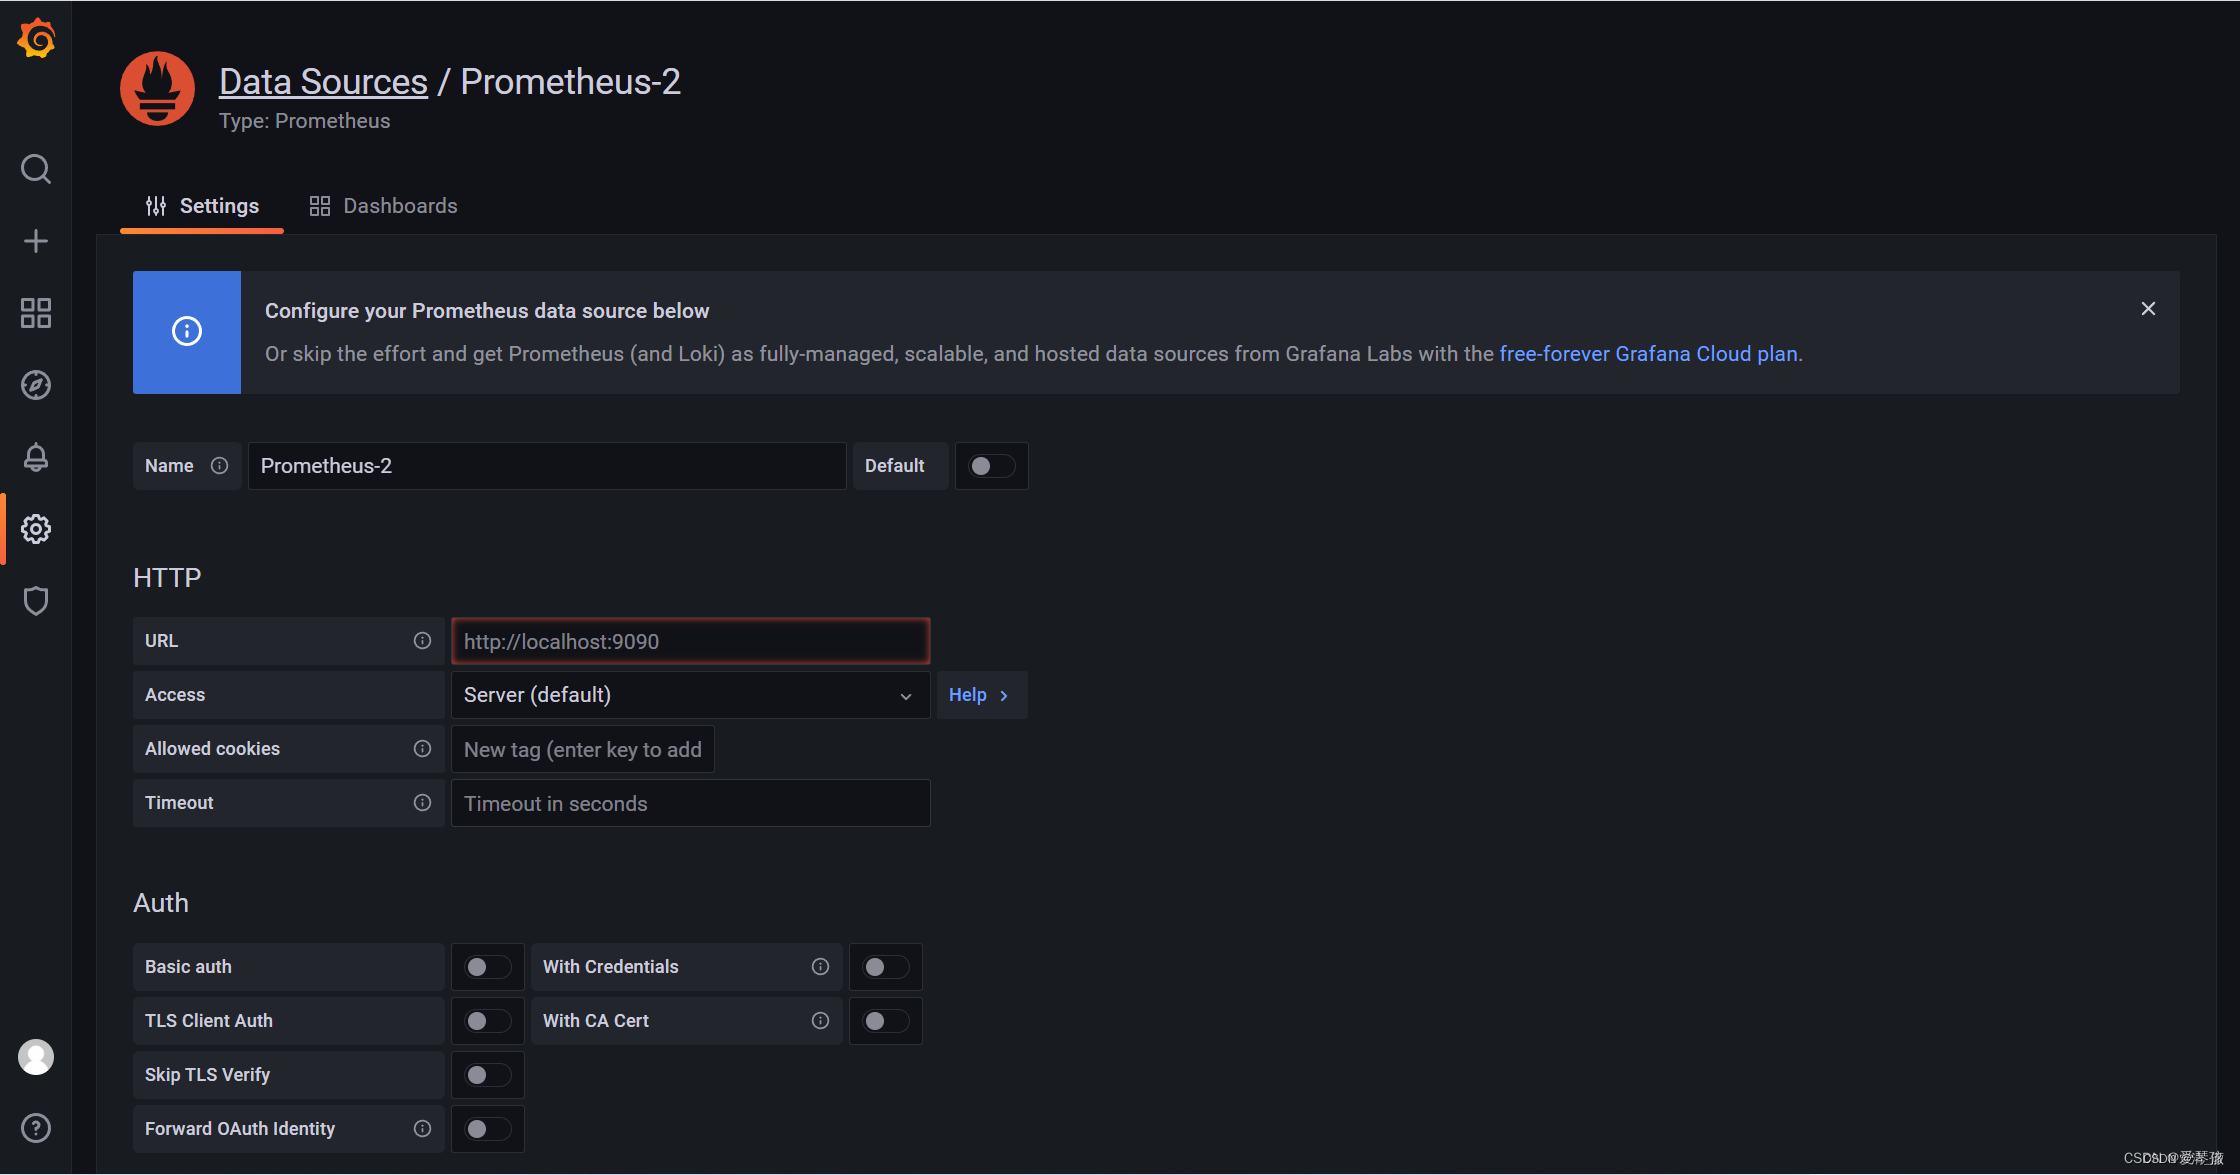
登录Grafana(默认用户名和密码均为admin),然后转到Configuration > Data Sources。点击Add data source,选择Prometheus作为数据源类型。
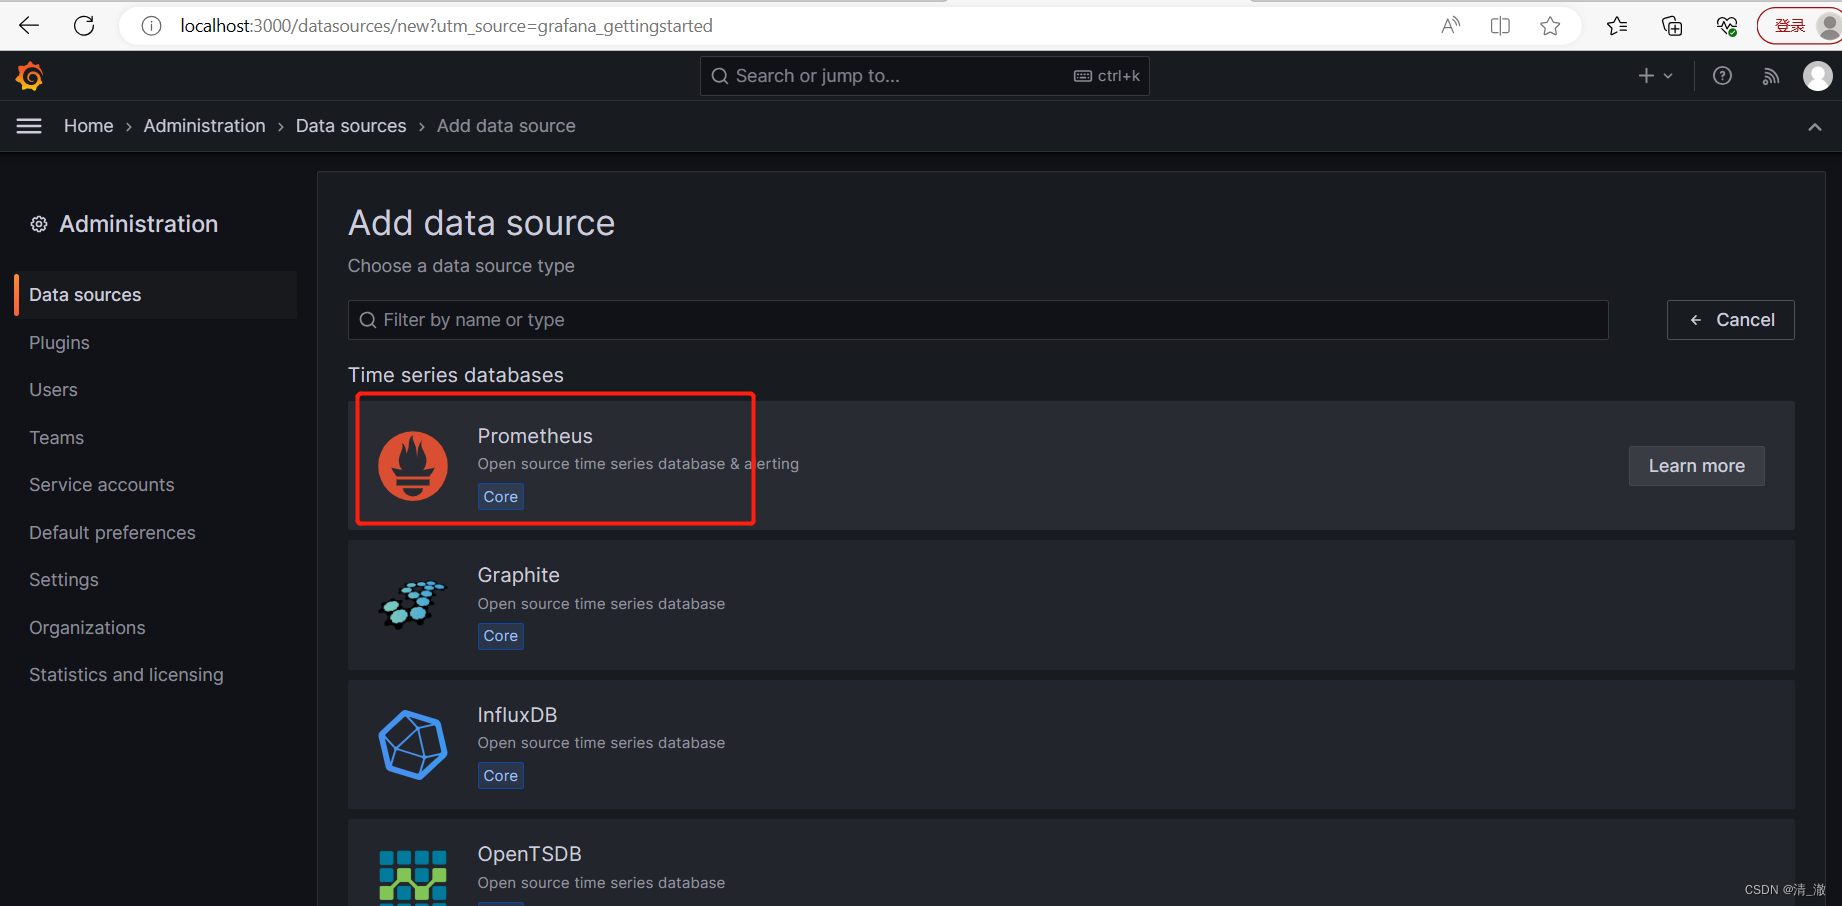
在URL字段中,输入Prometheus实例的地址(例如http://localhost:9090),然后将Access设置为Server。点击Save & Test按钮以测试和保存数据源配置。
2.3 创建Dashboard
完成数据源配置后,转到Dashboards > Manage,点击New dashboard按钮创建一个新的Dashboard。
在新的Dashboard中,点击Add new panel以添加图表。在图表编辑器中,你可以选择查询Prometheus数据源的指标数据。例如,要查看Spring Boot应用程序的HTTP请求数,可以输入以下PromQL查询:
rate(http_server_requests_seconds_count[1m])3、NodeExporter(服务器监控)插件配置安装
3.1 下载和安装Node Exporter 插件
Node Exporter 安装及启动运行
https://github.com/prometheus/node_exporter/releases
wget https://github.com/prometheus/node_exporter/releases/download/v1.6.0/node_exporter-1.6.0.linux-amd64.tar.gz
tar zxvf node_exporter-1.6.0.linux-amd64.tar.gz
cd /usr/local/node_exporter-1.3.1.linux-amd64
nohup ./node_exporter --web.listen-address=":9100" &
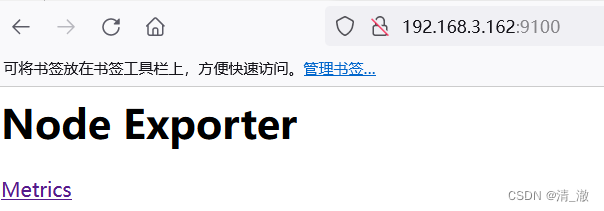
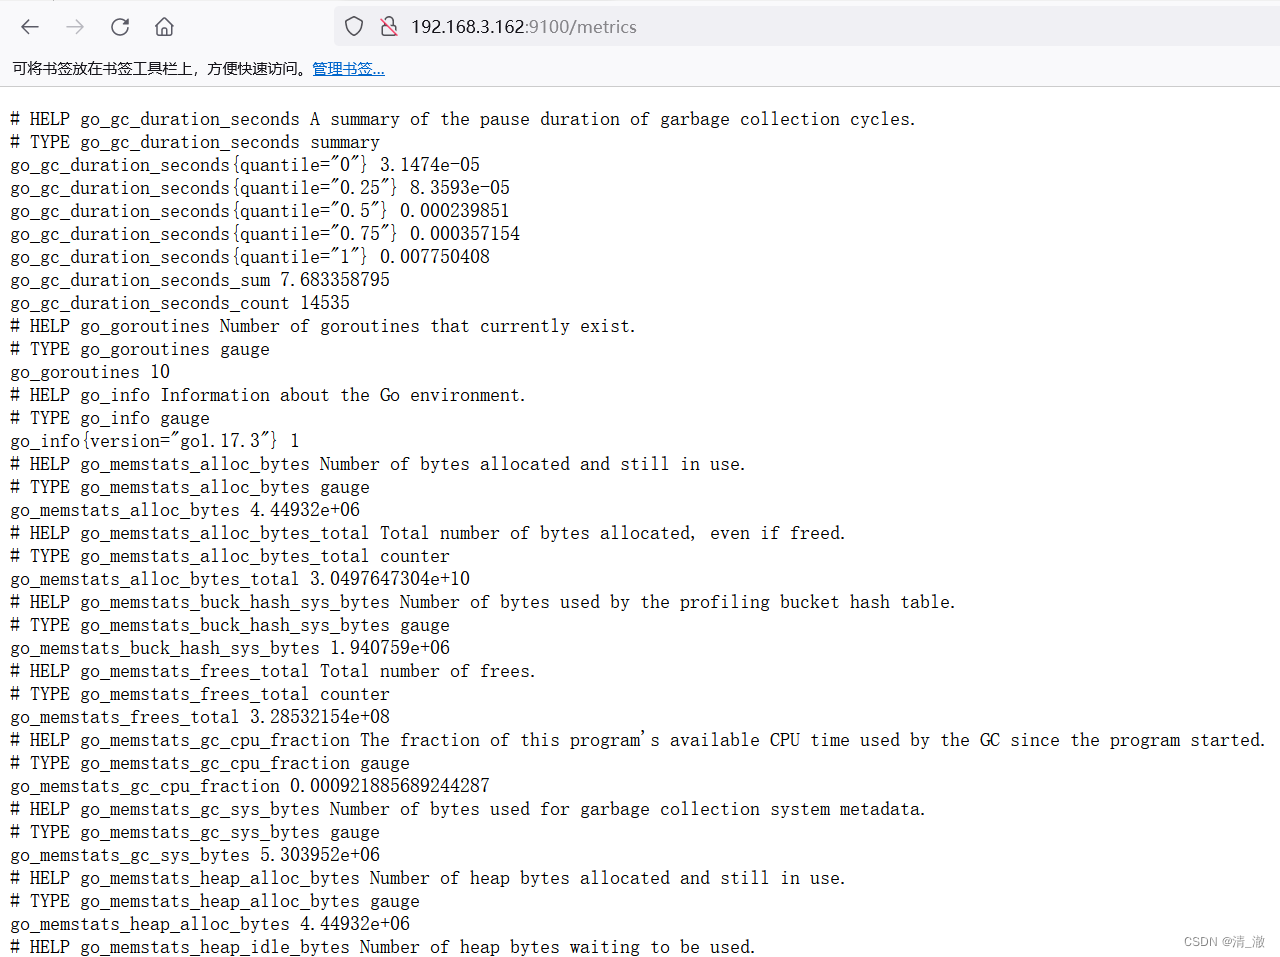
可见,插件已经抓取到服务器的监控信息。
3.2配置prometheus.yml

将192.168.3.162:9100的ip和端口配置到一个新建job
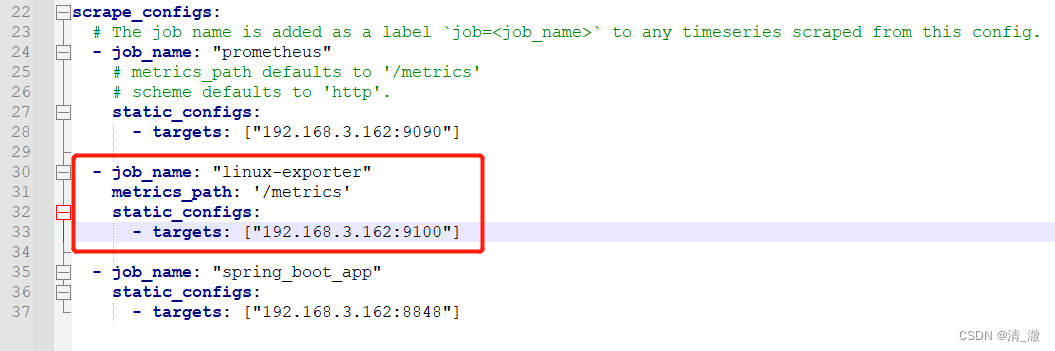
配置完后,重启普罗米修斯:
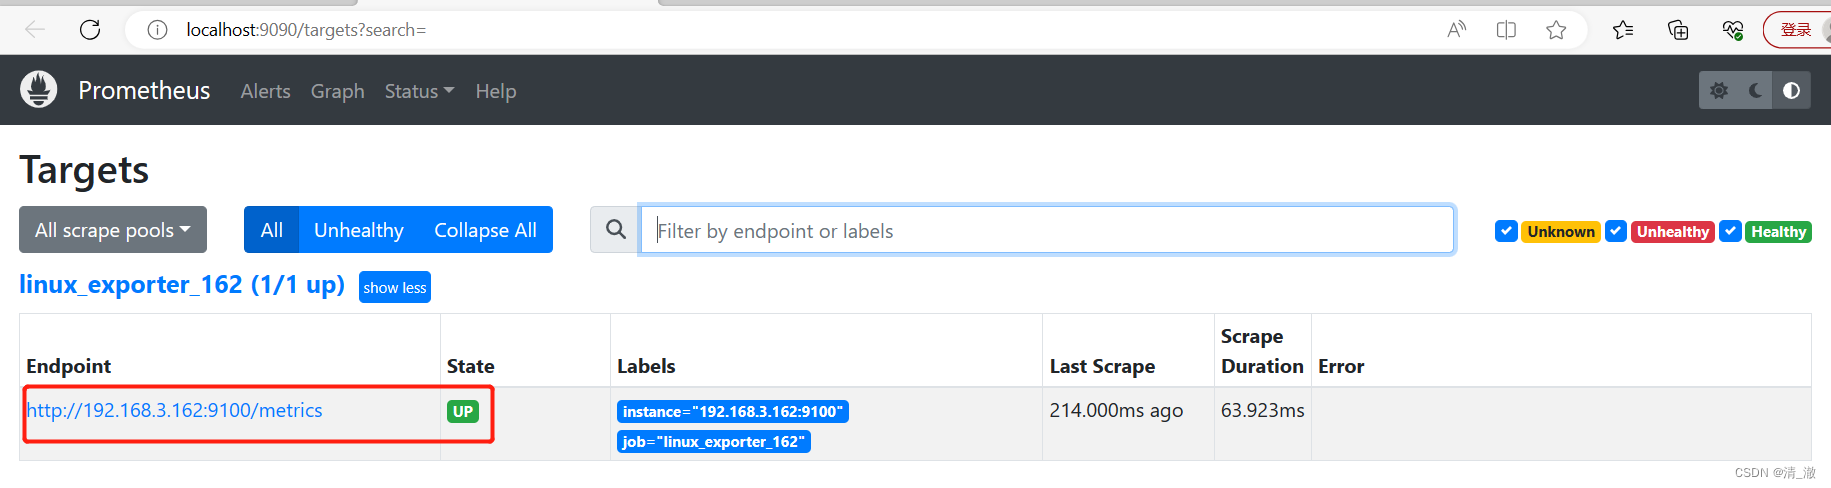
可以看到普罗米修斯已经监控到9100的job,点击确认查看监控详情:

3.3配置Grafana
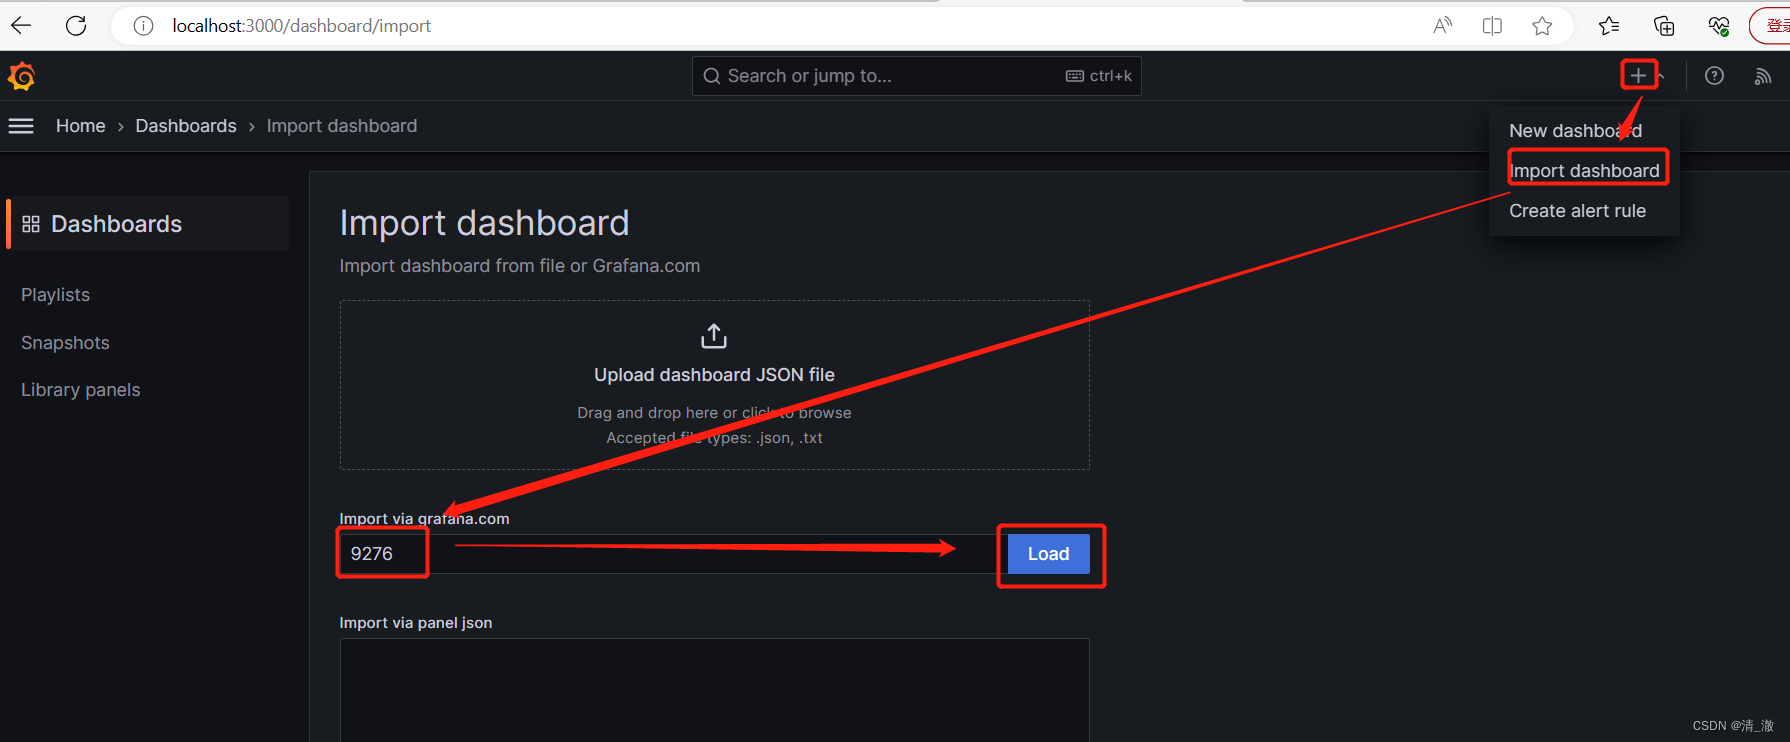
这里我们使用官方的模板配置 9276 :
grafana模板下载地址
https://grafana.com/grafana/dashboards
数据源选Prometheus:
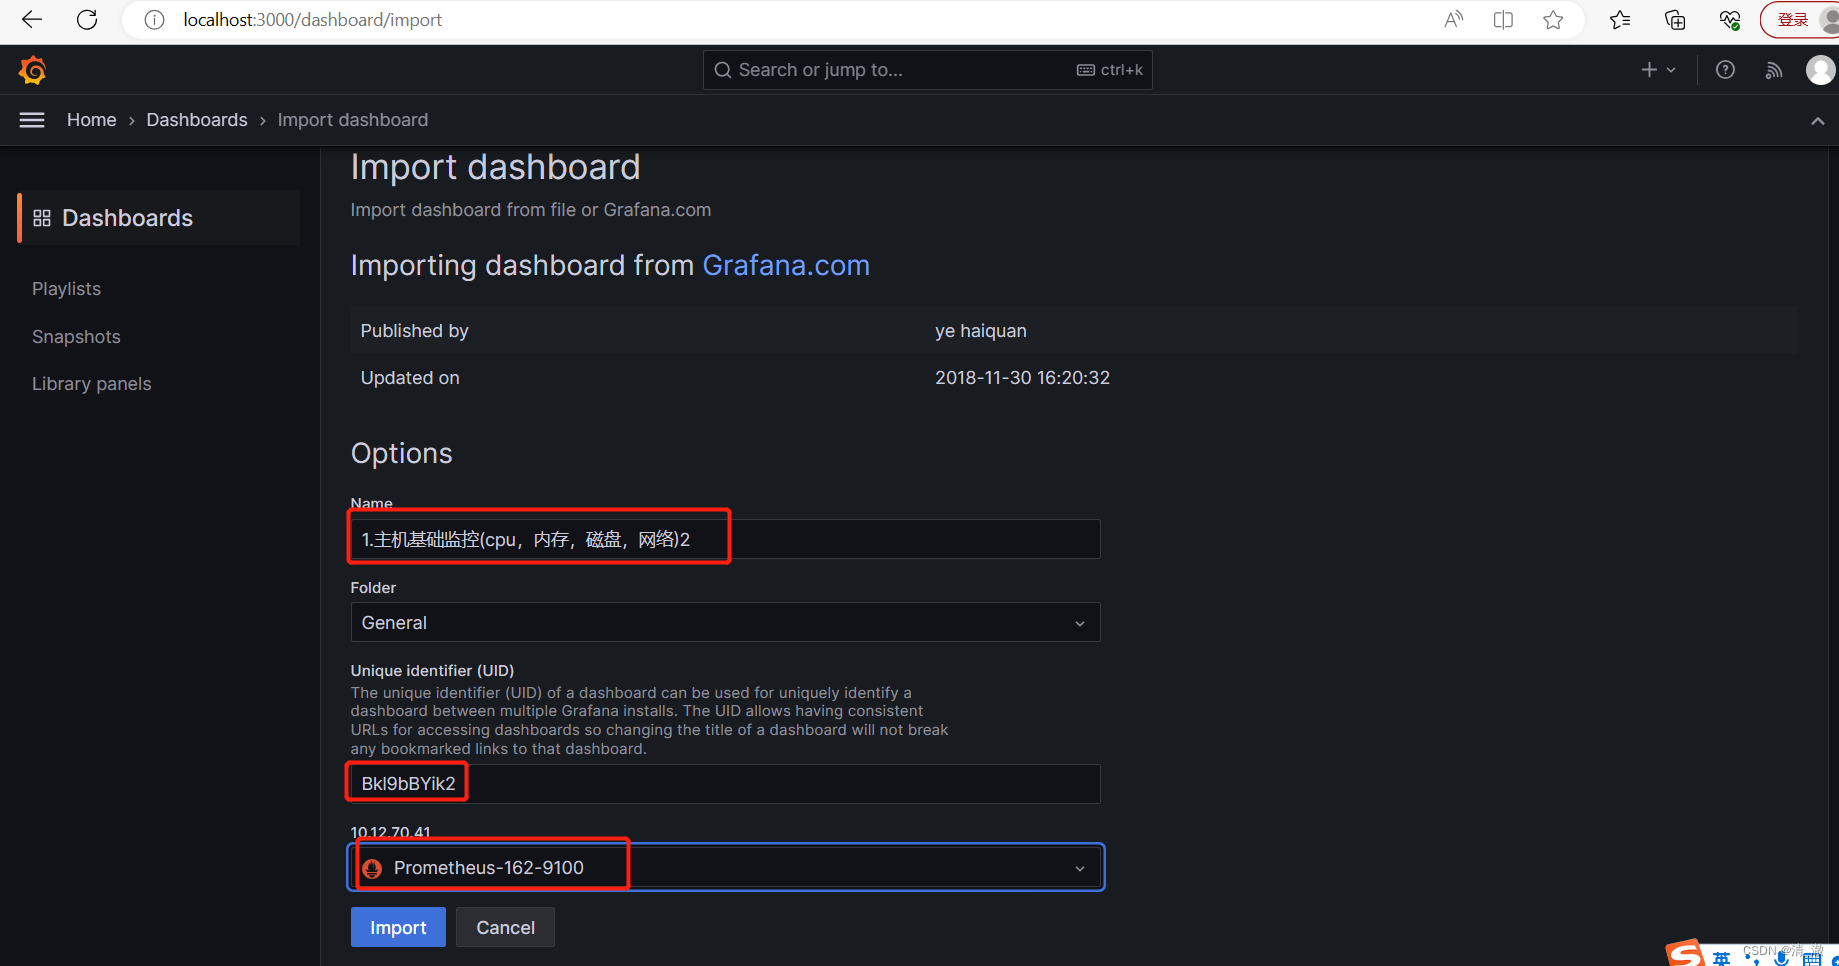
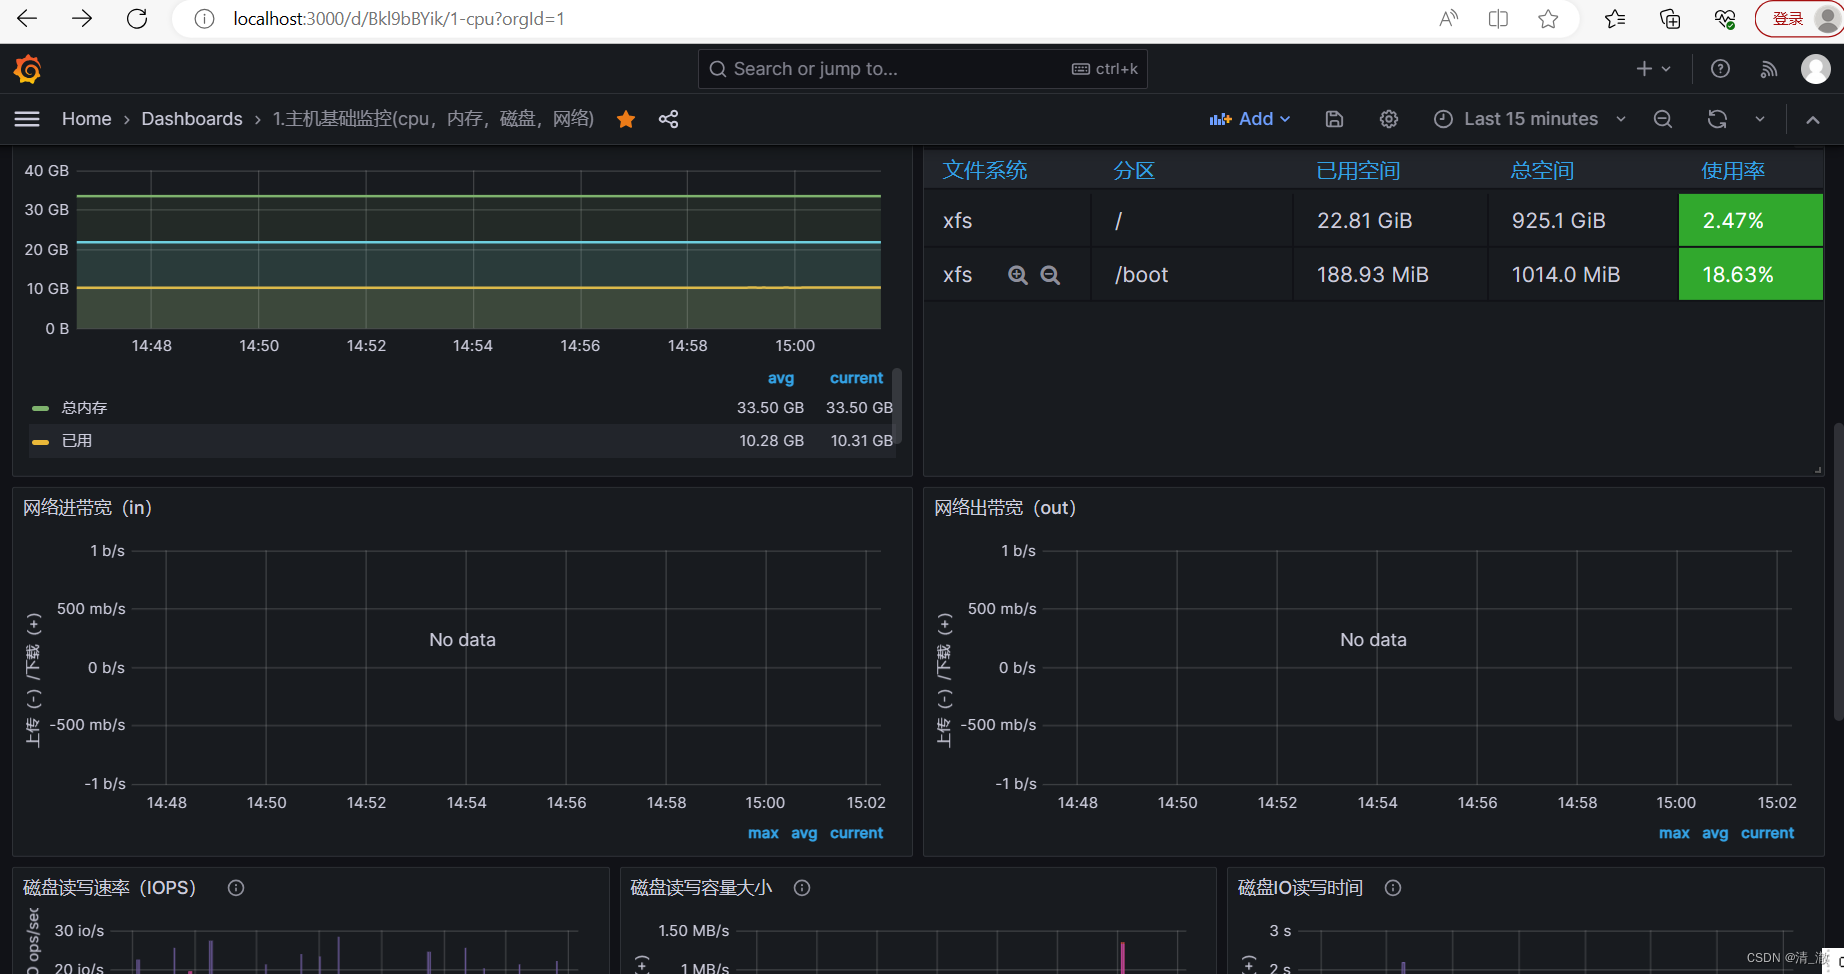
点确定后,进入监控面板:

3.4遇到的坑及解决方法
Grafana中监控不到数据
1.Centos上安装ntpdate:命令 yum install ntpdate -y
2.输入命令:ntpdate ntp1.aliyun.com
3.输入命令:hwclock --sysohc
4.输入命令:timedatectl
5.重新查看一下日期,输入命令:date
6.删除原来的Prometheus,重新安装配置一下
7.输入命令:reboot,重启centos
8.先检查一下日期:输入命令date,保证时间与windows监控机一致
9.关闭防火墙,重新启动grafana,prometheus,node_exporter
10.windows登录grafana,进入监控面板,已经可以监控到数据了,问题完美解决
4、Spring boot应用的监控配置
4.1 springboot工程pom.xml 配置
<dependency>
    <groupId>org.springframework.boot</groupId>
    <artifactId>spring-boot-starter-actuator</artifactId>
</dependency>
<dependency>
    <groupId>io.micrometer</groupId>
    <artifactId>micrometer-registry-prometheus</artifactId>
</dependency>
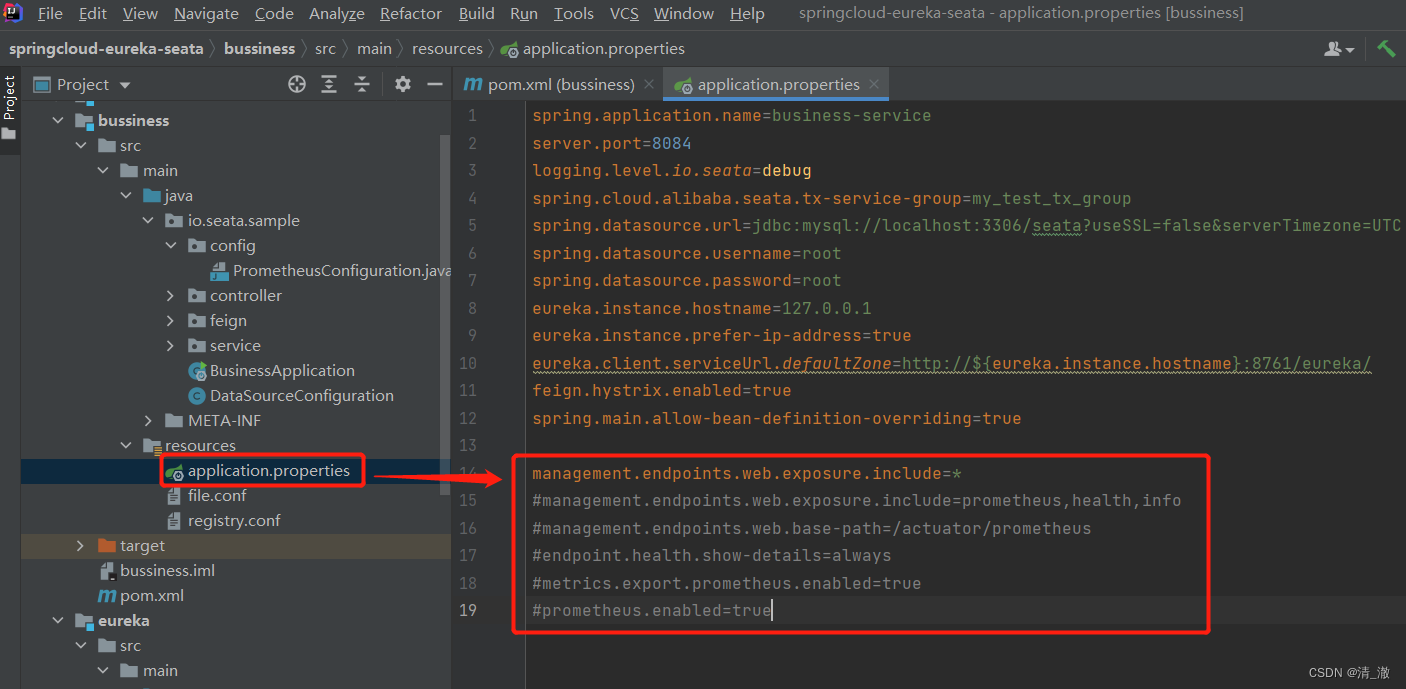
4.2 application.properties或application.yml 配置
management.endpoints.web.exposure.include=*management:
endpoints:
web:
exposure:
include: *如下图:
4.3 定义Prometheus监控任务
 - job_name: 'springboot-69-8084'

    metrics_path: '/actuator/prometheus'

    static_configs:

      - targets: ['localhost:8084'] # 使用你的Spring Boot应用程序的实际主机和端口替换
这里注意 metrics_path 要修改为 '/actuator/prometheus'
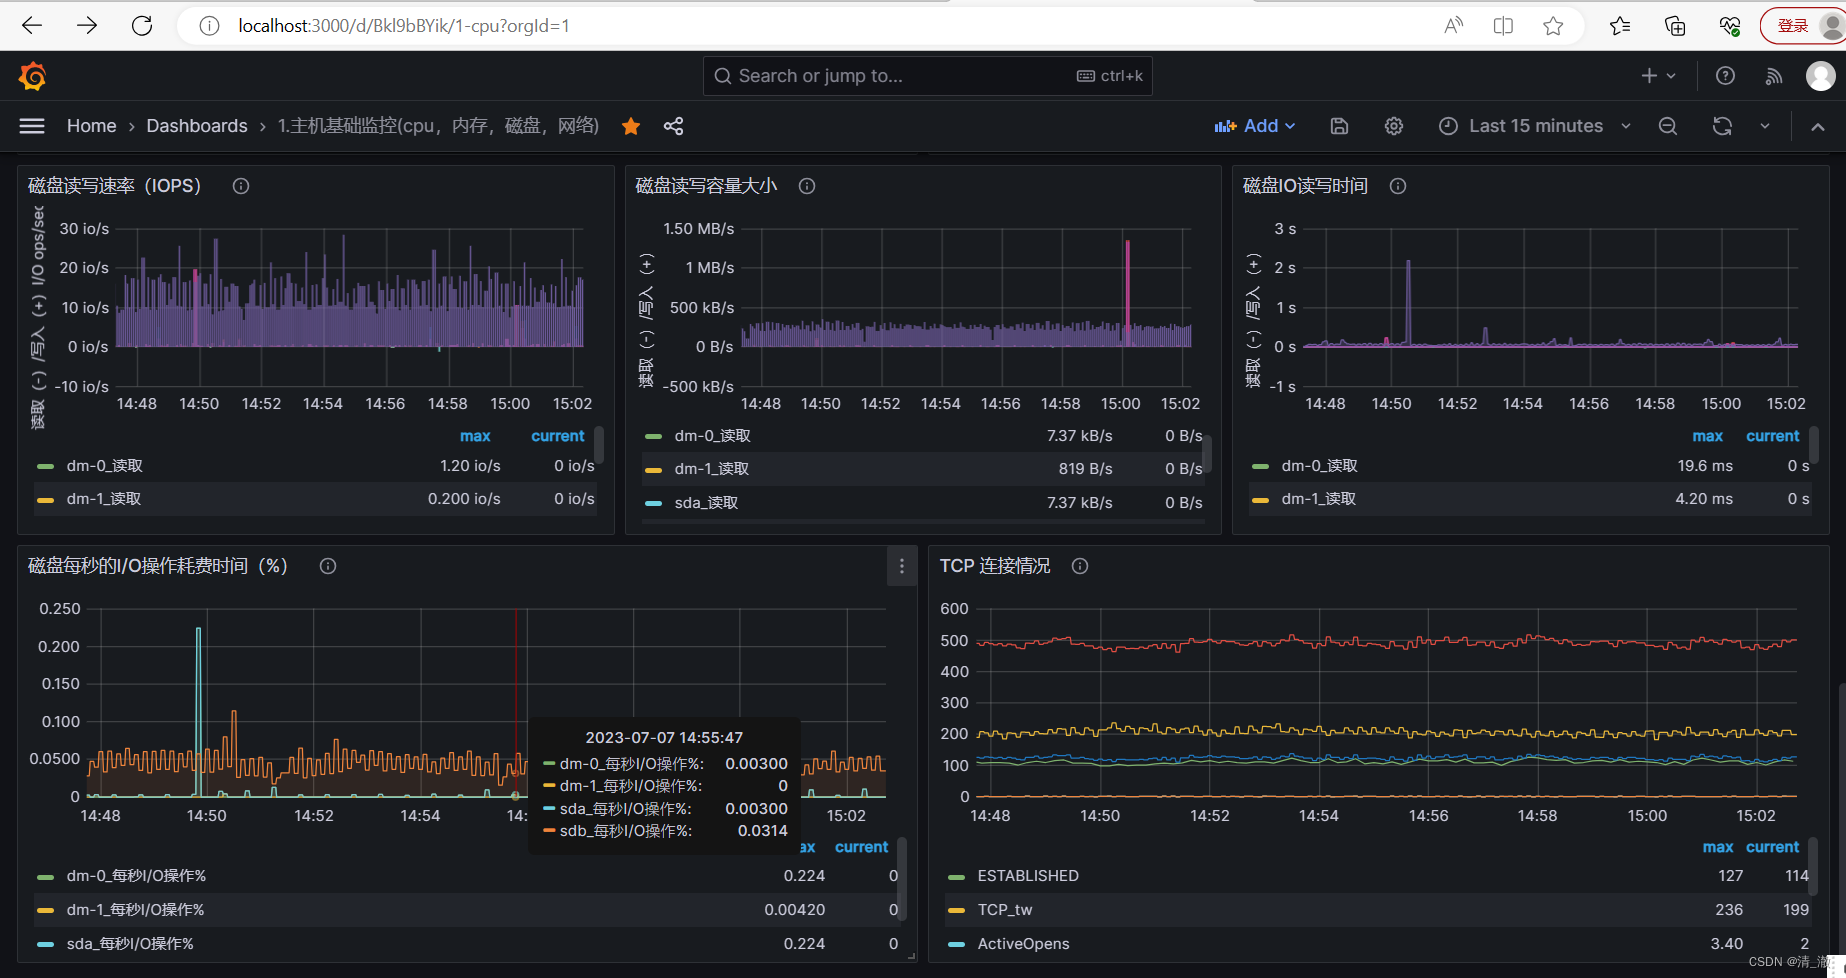
4.4 配置Grafana的dashboard
这里我们还是使用官方的模板:
SpringBoot Dashboard 模板ID: 12900