1、文件架构
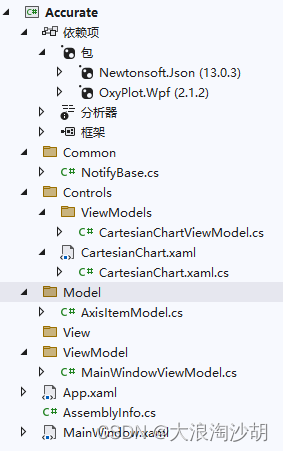
2、加载依赖项
Newtonsoft.Json
OxyPlot.Wpf
3、NotifyBase.cs
namespace Accurate.Common
{
    public class NotifyBase : INotifyPropertyChanged
    {
        public event PropertyChangedEventHandler? PropertyChanged;
        public void DoNotify([CallerMemberName] string prppertyName = null)
        {
            PropertyChanged?.Invoke(this, new PropertyChangedEventArgs(prppertyName));
        }
    }
}
4、CartesianChartViewModel.cs
namespace Accurate.Controls.ViewModels
{
    public class CartesianChartViewModel:NotifyBase
    {
		/// <summary>
		/// 定义plot属性
		/// </summary>
		private PlotModel? plotModel;

		public PlotModel? PlotModel
        {
			get { return plotModel; }
			set { plotModel = value; this.DoNotify(); }
		}
		/// <summary>
		/// 构造函数
		/// </summary>
		public CartesianChartViewModel()
		{
            PlotModel=new PlotModel();
        }
    }
}
5、CartesianChart.xaml
<UserControl x:Class="Accurate.Controls.CartesianChart"
             xmlns="http://schemas.microsoft.com/winfx/2006/xaml/presentation"
             xmlns:x="http://schemas.microsoft.com/winfx/2006/xaml"
             xmlns:mc="http://schemas.openxmlformats.org/markup-compatibility/2006"
             xmlns:d="http://schemas.microsoft.com/expression/blend/2008"
             xmlns:local="clr-namespace:Accurate.Controls"
             xmlns:oxy="http://oxyplot.org/wpf"
             mc:Ignorable="d"
             d:DesignHeight="450" d:DesignWidth="800">
    <Border Name="Layout" BorderBrush="#DDD" BorderThickness="1" CornerRadius="10" Background="LightBlue">
        <Border.Effect>
            <DropShadowEffect Color="#F2F2F2" ShadowDepth="10" BlurRadius="10" Opacity="0.4" Direction="270"/>
        </Border.Effect>
        <oxy:PlotView x:Name="PlotView" Model="{Binding Path= PlotModel}"></oxy:PlotView>
    </Border>
</UserControl>
6、CartesianChart.xaml.cs
namespace Accurate.Controls
{
    /// <summary>
    /// CartesianChart.xaml 的交互逻辑
    /// </summary>
    public partial class CartesianChart : UserControl
    {
        //Plot
        public CartesianChartViewModel? viewModel;
        //曲线数组
        public LineSeries[] lineSeries;
        /// <summary>
        /// 曲线属性设置属性
        /// </summary>
        public string ChartSetStr
        {
            get { return (string)GetValue(ChartSetStrProperty); }
            set { SetValue(ChartSetStrProperty, value); }
        }

        // Using a DependencyProperty as the backing store for MyProperty.  This enables animation, styling, binding, etc...
        public static readonly DependencyProperty ChartSetStrProperty =
            DependencyProperty.Register("ChartSetStr", typeof(string), typeof(CartesianChart),
                new PropertyMetadata(default(string),new PropertyChangedCallback(OnSetPropertyChanged)));
        /// <summary>
        /// 设置改变处理
        /// </summary>
        /// <param name="d"></param>
        /// <param name="e"></param>
        private static void OnSetPropertyChanged(DependencyObject d, DependencyPropertyChangedEventArgs e)
        {
            if(d is CartesianChart)
            {
                CartesianChart chart = (CartesianChart)d;
                chart.CreatePlot();
            }
        }
        /// <summary>
        /// 构造函数
        /// </summary>
        public CartesianChart()
        {
            InitializeComponent();
            this.Loaded += CartesianChart_Loaded;
            Dispatcher.ShutdownStarted += Dispatcher_ShutdownStarted;
        }
        /// <summary>
        /// 退出时释放资源
        /// </summary>
        /// <param name="sender"></param>
        /// <param name="e"></param>
        private void Dispatcher_ShutdownStarted(object? sender, EventArgs e)
        {
            //timer?.Stop();
        }
        /// <summary>
        /// 控件加载
        /// </summary>
        /// <param name="sender"></param>
        /// <param name="e"></param>
        private void CartesianChart_Loaded(object sender, RoutedEventArgs e)
        {
            CreatePlot();
        }
        /// <summary>
        /// 获取轴名称
        /// </summary>
        /// <param name="axisType"></param>
        /// <returns></returns>
        private string GetAxisKey(AxisType axisType)
        {
            string str = "";
            switch (axisType)
            {
                case AxisType.X:
                    str = "x";
                    break;
                case AxisType.Y:
                    str = "y";
                    break;
                case AxisType.X1:
                    str = "x1";
                    break;
                case AxisType.Y1:
                    str = "y1";
                    break;
            }
            return str;
        }
        /// <summary>
        /// 轴设置
        /// </summary>
        /// <param name="axisItemModels"></param>
        private void LinearAxisSet(ObservableCollection<AxisItemModel> axisItemModels)
        {
            if(axisItemModels != null && axisItemModels.Count > 1)
            {
                for(int i = 0; i < axisItemModels.Count; i++)
                {
                    var axis = new LinearAxis();
                    //设置轴类型
                    axis.Title = axisItemModels[i].Name;
                    axis.Key = GetAxisKey(axisItemModels[i].Type);
                    axis.Position = axisItemModels[i].Position;
                    //axis.Minimum = axisItemModels[i].Minimum;
                    //axis.MajorStep = axisItemModels[i].Step;
                    //axis.Maximum = axisItemModels[i].Maximum;
                    viewModel?.PlotModel?.Axes.Add(axis);
                }
            }
        }
        /// <summary>
        /// 曲线设置
        /// </summary>
        /// <param name="curveItemModels"></param>
        private void LineSeriesSet(ObservableCollection<CurveItemModel> curveItemModels)
        {
            if(curveItemModels != null && curveItemModels.Count > 1)
            {
                lineSeries = new LineSeries[curveItemModels.Count];
                for (int i=0;i<curveItemModels.Count;i++)
                {
                    lineSeries[i]=new LineSeries();
                    lineSeries[i].Title = curveItemModels[i].Name;
                    lineSeries[i].YAxisKey = GetAxisKey(curveItemModels[i].Type);
                    lineSeries[i].Color = GetOxyColor(curveItemModels[i].ItemColor);
                    lineSeries[i].MarkerType = curveItemModels[i].MarkType;
                    lineSeries[i].MarkerStroke = GetOxyColor(curveItemModels[i].MarkStroke);
                    lineSeries[i].MarkerSize = curveItemModels[i].MarkSize;
                    viewModel?.PlotModel.Series.Add(lineSeries[i]);
                }
            }
        }
        private List<ChartData> GetChartData()
        {
            var data=new List<ChartData>()
            {
                new ChartData{Date=DateTime.Now.Date.AddDays(-10),Data1=120,Data2=20},
                new ChartData{Date=DateTime.Now.Date.AddDays(-8),Data1=100,Data2=80},
                new ChartData{Date=DateTime.Now.Date.AddDays(-6),Data1=60,Data2=100},
                new ChartData{Date=DateTime.Now.Date.AddDays(-4),Data1=100,Data2=70},
                new ChartData{Date=DateTime.Now.Date.AddDays(-2),Data1=50,Data2=90}
            };
            return data;
        }
        private void LineSeriesDataSourceSet(List<ChartData> list)
        {
            for(int i=0;i<2;i++)
            {
                lineSeries[i].ItemsSource = list;
                lineSeries[i].DataFieldX = "Date";
                lineSeries[i].DataFieldY = "Data" + i;
                viewModel?.PlotModel.Series.Add(lineSeries[i]);
            }
        }
        /// <summary>
        /// 颜色转换
        /// </summary>
        /// <param name="color"></param>
        /// <returns></returns>
        private OxyColor GetOxyColor(string color)
        {
            OxyColor oxyColor= OxyColors.Black;
            switch(color)
            {
                case "Black":
                    oxyColor = OxyColors.Black;
                    break;
                case "Red":
                    oxyColor = OxyColors.Red;
                    break;
                case "Blue":
                    oxyColor = OxyColors.Blue;
                    break;
                case "Green":
                    oxyColor = OxyColors.Green;
                    break;
                case "Yellow":
                    oxyColor = OxyColors.Yellow;
                    break;
                case "Violet":
                    oxyColor = OxyColors.Violet;
                    break;
            }
            return oxyColor;
        }
        /// <summary>
        /// Chart设置
        /// </summary>
        private void CreatePlot()
        {
            if (ChartSetStr == null) return;
            ChartSetModel ChartSet=JsonConvert.DeserializeObject<ChartSetModel>(ChartSetStr);
            //曲线设置
            viewModel = new CartesianChartViewModel();
            PlotView.DataContext = viewModel;
            viewModel.PlotModel.Title = ChartSet.Name;
            viewModel.PlotModel.Legends.Add(new Legend
            {
                LegendPlacement = LegendPlacement.Outside,
                LegendPosition = LegendPosition.BottomCenter,
                LegendOrientation = LegendOrientation.Horizontal,
                LegendBorderThickness = 0,
                LegendTextColor = OxyColors.LightGray
            });
            LinearAxisSet(ChartSet.AxisItemModels);
            LineSeriesSet(ChartSet.CurveItemModels);
            //LineSeriesDataSourceSet(GetChartData());
        }
    }
}
7、AxisItemModel.cs
namespace Accurate.Model
{
    /// <summary>
    /// 曲线设置类
    /// </summary>
    public class ChartSetModel
    {
        public string Name { get; set; } = "曲线示例";
        public ObservableCollection<AxisItemModel> AxisItemModels { get; set; }=new ObservableCollection<AxisItemModel>();
        public ObservableCollection<CurveItemModel> CurveItemModels { get; set; } = new ObservableCollection<CurveItemModel>();
    }
    /// <summary>
    /// 坐标轴设置
    /// </summary>
    public class AxisItemModel
    {
        public string Name { get; set; } = "X";
        public AxisType Type { get; set; } = 0;
        public AxisPosition Position { get; set; } = AxisPosition.Bottom;
        public double Minimum { get; set; } = 0;
        public double Step { get; set; } = 1;
        public double Maximum { get; set; } = 100;
    }
    /// <summary>
    /// 曲线设置
    /// </summary>
    public class CurveItemModel
    {
        public string Name { get; set; } = "时间";
        public AxisType Type { get; set; } = 0;
        public string ItemColor { get; set; } = "Black";
        public MarkerType MarkType { get; set; } = MarkerType.Circle;
        public string MarkStroke { get; set; } = "Black";
        public double MarkSize { get; set; } = 3;
    }
    /// <summary>
    /// 枚举轴类型
    /// </summary>
    public enum AxisType:int
    {
        X,Y,X1,Y1
    }
    /// <summary>
    /// 数据Item(单点数据添加)
    /// </summary>
    public class DataItem
    {
        public double DataX { get; set; }
        public List<double> DataYs { get; set; }=new List<double>();
    }
    public class ChartData
    {
        public DateTime Date { get; set; }
        public double Data1 { get; set; }
        public double Data2 { get; set; }
    }
}
8、MainWindowViewModel。cs
namespace Accurate.ViewModel
{
    public class MainWindowViewModel:NotifyBase
    {
		private string chartSetString;

		public string ChartSetString
		{
			get { return chartSetString; }
			set { chartSetString = value;this.DoNotify(); }
		}
        public ChartSetModel ChartSetData { get; set; } = new ChartSetModel();


        public MainWindowViewModel()
		{
            RefreshChartSet();

        }
		private void RefreshChartSet()
		{
            ChartSetData.Name = "正弦和余弦曲线";
            //设置坐标轴
            ChartSetData.AxisItemModels.Add(
                new AxisItemModel() { Name = "X", Type = AxisType.X, Position = OxyPlot.Axes.AxisPosition.Bottom, Minimum = 0, Step = 1, Maximum = 200 }
            );
            ChartSetData.AxisItemModels.Add(
                new AxisItemModel() { Name = "Y", Type = AxisType.Y, Position = OxyPlot.Axes.AxisPosition.Left, Minimum = -10, Step = 1, Maximum = 10 }
            );
            //设置曲线
            ChartSetData.CurveItemModels.Add(new CurveItemModel
            {
                Name = "正弦曲线",
                Type = AxisType.Y,
                ItemColor = "Red",
                MarkType = MarkerType.Circle,
                MarkStroke = "Blue",
                MarkSize = 3
            });
            ChartSetData.CurveItemModels.Add(new CurveItemModel
            {
                Name = "余弦曲线",
                Type = AxisType.Y,
                ItemColor = "Green",
                MarkType = MarkerType.Square,
                MarkStroke = "Yellow",
                MarkSize = 3
            });
            ChartSetString = JsonConvert.SerializeObject(ChartSetData);
        }

    }
}
9、MainWindow.xaml
<Window x:Class="Accurate.MainWindow"
        xmlns="http://schemas.microsoft.com/winfx/2006/xaml/presentation"
        xmlns:x="http://schemas.microsoft.com/winfx/2006/xaml"
        xmlns:d="http://schemas.microsoft.com/expression/blend/2008"
        xmlns:mc="http://schemas.openxmlformats.org/markup-compatibility/2006"
        xmlns:local="clr-namespace:Accurate"
        xmlns:controls="clr-namespace:Accurate.Controls"
        mc:Ignorable="d"
        Title="MainWindow" Height="600" Width="800">
    <Grid>
        <controls:CartesianChart x:Name="Cartesian" ChartSetStr="{Binding ChartSetString}"  Height="450" Width="800" HorizontalAlignment="Center" VerticalAlignment="Center"/>
    </Grid>
</Window>
10、MainWindow.xaml.cs
namespace Accurate
{
    /// <summary>
    /// Interaction logic for MainWindow.xaml
    /// </summary>
    public partial class MainWindow : Window
    {
        private DispatcherTimer? timer;
        public MainWindow()
        {
            InitializeComponent();
            this.DataContext = new MainWindowViewModel();
            //this.Cartesian.lineSeries
            timer = new DispatcherTimer();
            timer.Interval = TimeSpan.FromMilliseconds(100);
            timer.Tick += TimerTick;
            timer.Start();
        }
        double x = 0;
        /// <summary>
        /// 定时更新数据
        /// </summary>
        /// <param name="sender"></param>
        /// <param name="e"></param>
        private void TimerTick(object? sender, EventArgs e)
        {
            double y = 10 * Math.Sin(x / 10.0);
            this.Cartesian.lineSeries[0]?.Points.Add(new DataPoint(x, y));
            double y1 = 10 * Math.Cos(x / 10.0);
            this.Cartesian.lineSeries[1]?.Points.Add(new DataPoint(x, y1));
            x++;
            if (this.Cartesian.lineSeries[0]?.Points.Count > 200)
            {
                this.Cartesian.lineSeries[0].Points.RemoveAt(0);
            }
            if (this.Cartesian.lineSeries[1]?.Points.Count > 200)
            {
                this.Cartesian.lineSeries[1].Points.RemoveAt(0);
            }
            this.Cartesian.viewModel?.PlotModel.InvalidatePlot(true);
        }
    }
}