葡萄酒数据可视化分析
 必应壁纸供图
数据集:https://download.csdn.net/download/weixin_53742691/87982219
import pandas as pd
import seaborn as sns
import matplotlib.pyplot as plt
wine = pd.read_csv("wine_quality/wine_edited.csv")
wine.head()
| fixed acidity | volatile acidity | citric acid | residual sugar | chlorides | free sulfur dioxide | total sulfur dioxide | density | pH | sulphates | alcohol | quality | color | alcohol_level | acidity_level | |
|---|---|---|---|---|---|---|---|---|---|---|---|---|---|---|---|
| 0 | 7.4 | 0.70 | 0.00 | 1.9 | 0.076 | 11.0 | 34.0 | 0.9978 | 3.51 | 0.56 | 9.4 | 5 | red | low | low |
| 1 | 7.8 | 0.88 | 0.00 | 2.6 | 0.098 | 25.0 | 67.0 | 0.9968 | 3.20 | 0.68 | 9.8 | 5 | red | low | mod_high |
| 2 | 7.8 | 0.76 | 0.04 | 2.3 | 0.092 | 15.0 | 54.0 | 0.9970 | 3.26 | 0.65 | 9.8 | 5 | red | low | medium |
| 3 | 11.2 | 0.28 | 0.56 | 1.9 | 0.075 | 17.0 | 60.0 | 0.9980 | 3.16 | 0.58 | 9.8 | 6 | red | low | mod_high |
| 4 | 7.4 | 0.70 | 0.00 | 1.9 | 0.076 | 11.0 | 34.0 | 0.9978 | 3.51 | 0.56 | 9.4 | 5 | red | low | low |
wine.info()
<class 'pandas.core.frame.DataFrame'>
RangeIndex: 6497 entries, 0 to 6496
Data columns (total 15 columns):
 #   Column                Non-Null Count  Dtype
---  ------                --------------  -----
 0   fixed acidity         6497 non-null   float64
 1   volatile acidity      6497 non-null   float64
 2   citric acid           6497 non-null   float64
 3   residual sugar        6497 non-null   float64
 4   chlorides             6497 non-null   float64
 5   free sulfur dioxide   6497 non-null   float64
 6   total sulfur dioxide  6497 non-null   float64
 7   density               6497 non-null   float64
 8   pH                    6497 non-null   float64
 9   sulphates             6497 non-null   float64
 10  alcohol               6497 non-null   float64
 11  quality               6497 non-null   int64
 12  color                 6497 non-null   object
 13  alcohol_level         6497 non-null   object
 14  acidity_level         6496 non-null   object
dtypes: float64(11), int64(1), object(3)
memory usage: 761.5+ KB
单一变量的可视化
sns.countplot(x='color',data=wine);

sns.countplot(x='acidity_level',data=wine);

sns.countplot(x='quality',data=wine);

sns.color_palette()
base_color = sns.color_palette()[0]
sns.countplot(x='color',data=wine,color=base_color);

sns.countplot(x='quality',data=wine,color=base_color);

sns.countplot(y='acidity_level',data=wine,color=base_color);

wine.acidity_level.value_counts()
high        1717
mod_high    1643
low         1574
medium      1562
Name: acidity_level, dtype: int64
ph_order = wine.acidity_level.value_counts().index
sns.countplot(y='acidity_level',data=wine,color=base_color,order=ph_order);

sns.countplot(x='acidity_level',data=wine,color=base_color,order=ph_order);

sns.countplot(x='acidity_level',data=wine,color=base_color,order=ph_order);

acidity_class = wine['acidity_level'].value_counts()
locs,lables = plt.xticks()

for i in range(len(locs)):
    put_string = acidity_class[i]
    plt.text(locs[i],put_string-100,put_string,color='white',ha='center')

sns.countplot(y='acidity_level',data=wine,color=base_color,order=ph_order);

acidity_class = wine['acidity_level'].value_counts()
locs,lables = plt.yticks()

for i in range(len(locs)):
    put_string = acidity_class[i]
    plt.text(put_string+100,locs[i],put_string,ha='center')

alcohol_data = wine.alcohol_level.value_counts().reset_index()
alcohol_data = alcohol_data.rename(columns={'index':'alcohol_level','alcohol_level':'alcohol_counts'})
alcohol_data
| alcohol_level | alcohol_counts | |
|---|---|---|
| 0 | high | 3320 |
| 1 | low | 3177 |
sns.barplot(x='alcohol_level',y='alcohol_counts',data=alcohol_data,color=base_color);

plt.pie(alcohol_data.alcohol_counts,labels=alcohol_data.alcohol_level,startangle=90)
plt.show()

acidity_class = wine['acidity_level'].value_counts().reset_index()
acidity_class = acidity_class.rename(columns={'index':'acidity_level','acidity_level':'level_counts'})
acidity_class
| acidity_level | level_counts | |
|---|---|---|
| 0 | high | 1717 |
| 1 | mod_high | 1643 |
| 2 | low | 1574 |
| 3 | medium | 1562 |
plt.pie(acidity_class.level_counts,labels=acidity_class.acidity_level,startangle=90)
plt.show()

plt.pie(acidity_class.level_counts,labels=acidity_class.acidity_level,startangle=90,wedgeprops={'width':0.4})
plt.show()

wine.describe()
| fixed acidity | volatile acidity | citric acid | residual sugar | chlorides | free sulfur dioxide | total sulfur dioxide | density | pH | sulphates | alcohol | quality | |
|---|---|---|---|---|---|---|---|---|---|---|---|---|
| count | 6497.000000 | 6497.000000 | 6497.000000 | 6497.000000 | 6497.000000 | 6497.000000 | 6497.000000 | 6497.000000 | 6497.000000 | 6497.000000 | 6497.000000 | 6497.000000 |
| mean | 7.215307 | 0.339666 | 0.318633 | 5.443235 | 0.056034 | 30.525319 | 115.744574 | 0.994697 | 3.218501 | 0.531268 | 10.491801 | 5.818378 |
| std | 1.296434 | 0.164636 | 0.145318 | 4.757804 | 0.035034 | 17.749400 | 56.521855 | 0.002999 | 0.160787 | 0.148806 | 1.192712 | 0.873255 |
| min | 3.800000 | 0.080000 | 0.000000 | 0.600000 | 0.009000 | 1.000000 | 6.000000 | 0.987110 | 2.720000 | 0.220000 | 8.000000 | 3.000000 |
| 25% | 6.400000 | 0.230000 | 0.250000 | 1.800000 | 0.038000 | 17.000000 | 77.000000 | 0.992340 | 3.110000 | 0.430000 | 9.500000 | 5.000000 |
| 50% | 7.000000 | 0.290000 | 0.310000 | 3.000000 | 0.047000 | 29.000000 | 118.000000 | 0.994890 | 3.210000 | 0.510000 | 10.300000 | 6.000000 |
| 75% | 7.700000 | 0.400000 | 0.390000 | 8.100000 | 0.065000 | 41.000000 | 156.000000 | 0.996990 | 3.320000 | 0.600000 | 11.300000 | 6.000000 |
| max | 15.900000 | 1.580000 | 1.660000 | 65.800000 | 0.611000 | 289.000000 | 440.000000 | 1.038980 | 4.010000 | 2.000000 | 14.900000 | 9.000000 |
plt.hist(data=wine,x='pH')
plt.show()

import numpy as np
bin_edges = np.arange(wine.pH.min(),wine.pH.max()+0.05,0.05)
len(bin_edges )
27
plt.hist(data=wine,x='pH',bins=bin_edges)
plt.show()

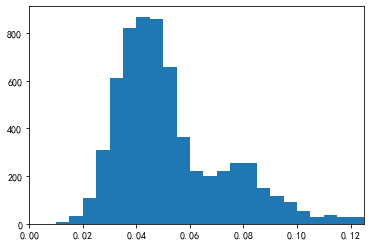
bin_edges = np.arange(0.0,0.125+0.005,0.005)
plt.hist(data=wine,x='chlorides',bins=bin_edges)
plt.xlim((0.0,0.125))
plt.show()




![[安洵杯 2019]game](https://img-blog.csdnimg.cn/1695ff85417445fea7616eefd958eea1.png)
