标题:不同乐器波形图
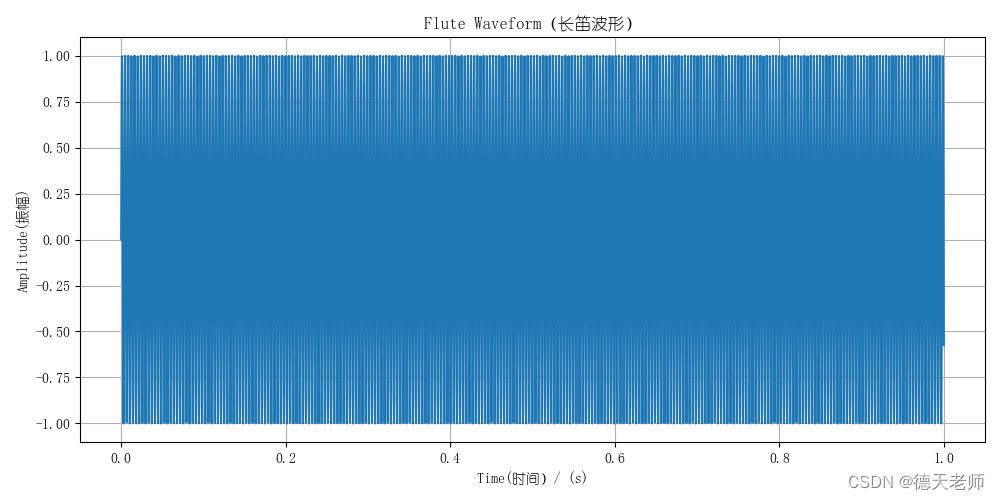
笛子的频率取决于其音高,不同音高的笛子频率也不同。以C调笛子为例,其最基本的频率为261.63 Hz(即中央C的频率)。而其他调号的笛子的基本频率则会有所不同。
笛子的波形图:
import numpy as np
import matplotlib.pyplot as plt
plt.rc("font",family='YouYuan')
plt.rcParams['axes.unicode_minus']=False
# 采样率
fs = 8000

# 表示时间的数组
t = np.arange(fs) / fs

# 笛子的频率
f0 = 261.63

# 笛子的波形
y = np.sin(2 * np.pi * f0 * t)

# 绘制波形图
plt.figure(figsize=(10, 5))
plt.plot(t, y)
plt.xlabel('Time(时间)/ (s)')
plt.ylabel('Amplitude(振幅)')
plt.title('Flute Waveform(长笛波形)')
plt.grid()
plt.show()
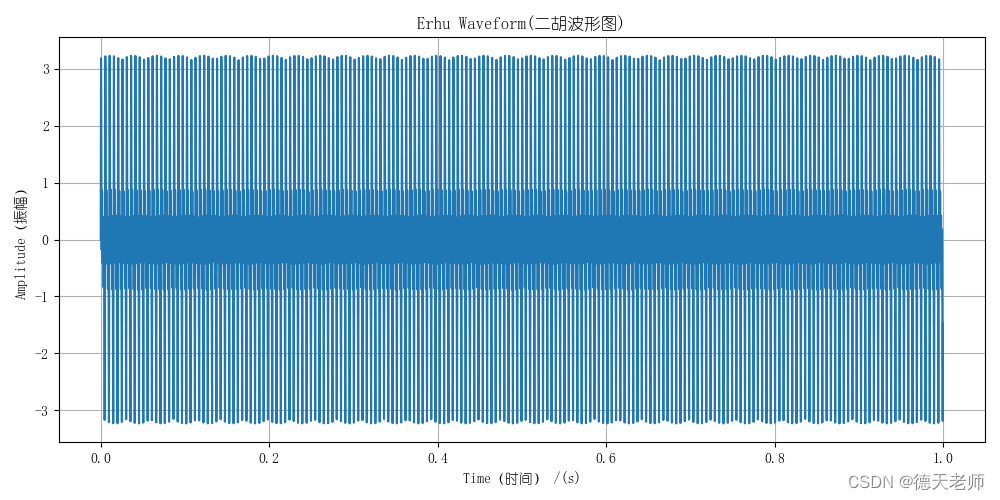
二胡的波形图:
二胡的标准音高为G,频率为392 Hz。但是在演奏中,由于需要进行调弦和进行音高变化,频率会有所不同。
import numpy as np
import matplotlib.pyplot as plt
plt.rc("font",family='YouYuan')
plt.rcParams['axes.unicode_minus']=False

import numpy as np
import matplotlib.pyplot as plt

# 采样率
fs = 8000

# 表示时间的数组
t = np.arange(fs) / fs

# 二胡的频率
f0 = 196

# 二胡的波形
y = np.sin(2 * np.pi * f0 * t) + np.sin(2 * np.pi * 2 * f0 * t) + \
    np.sin(2 * np.pi * 3 * f0 * t) + np.sin(2 * np.pi * 4 * f0 * t)

# 绘制波形图
plt.figure(figsize=(10, 5))
plt.plot(t, y)
plt.xlabel('Time(时间) /(s)')
plt.ylabel('Amplitude(振幅)')
plt.title('Erhu Waveform(二胡波形图)')
plt.grid()
plt.show()
钢琴的波形图:
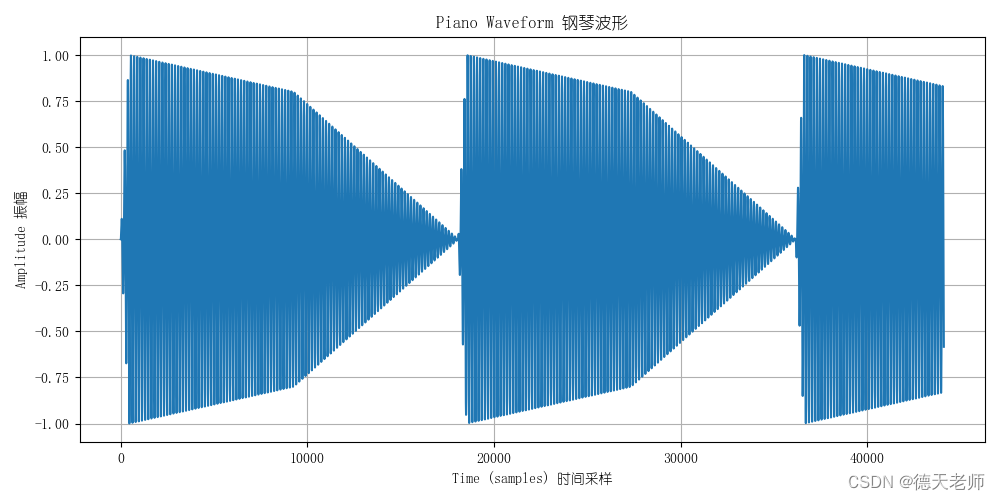
import numpy as np
import matplotlib.pyplot as plt
plt.rc("font",family='YouYuan')
plt.rcParams['axes.unicode_minus']=False

# 采样率
fs = 44100

# 触键时间和松键时间
attack_time = 0.01 # 攻击时间
release_time = 0.2 # 松键时间

# 模拟钢琴音色的 ADSR 包络
adsr = np.concatenate([np.linspace(0, 1, int(fs * attack_time)),
                        np.linspace(1, 0.8, int(fs * release_time)),
                        np.linspace(0.8, 0, int(fs * release_time))])


adsr = np.concatenate([np.linspace(0, 1, int(fs * attack_time)),
                        np.linspace(1, 0.8, int(fs * release_time)),
                        np.linspace(0.8, 0, int(fs * release_time))])


# 钢琴的基音频率
f0 = 261.63 # C4

# 生成钢琴音色
note = np.sin(2 * np.pi * f0 * np.arange(fs) / fs)


# 使用 np.tile() 函数将 adsr 扩充到和 note 一样的长度
adsr = np.tile(adsr, int(np.ceil(len(note) / len(adsr))))

# 将音符乘以 ADSR 包络
note *= adsr[:len(note)]

# 绘制波形图
plt.figure(figsize=(10, 5))
plt.plot(note)
plt.xlabel('Time (samples) 时间采样')
plt.ylabel('Amplitude 振幅')
plt.title('Piano Waveform 钢琴波形')
plt.grid()
plt.show()
号角的波形图:
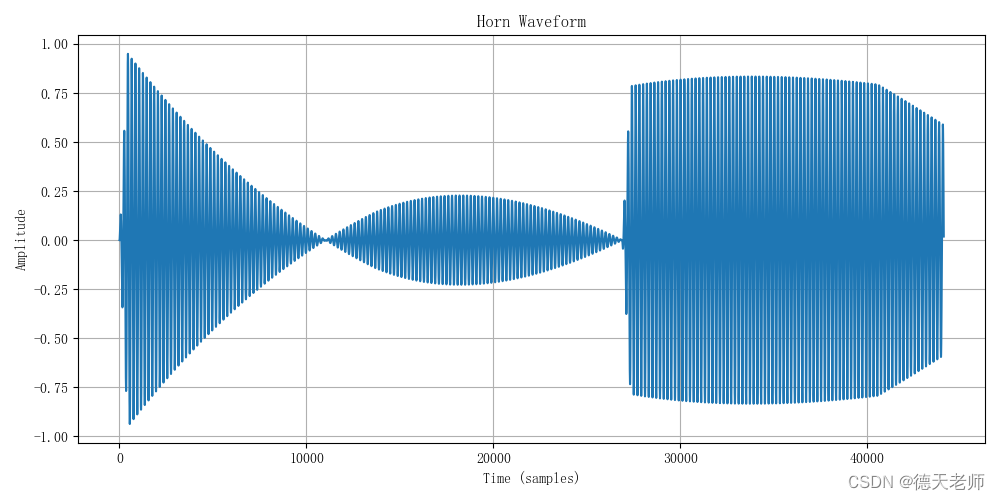
import numpy as np
import matplotlib.pyplot as plt
plt.rc("font",family='YouYuan')
plt.rcParams['axes.unicode_minus']=False

# 采样率
fs = 44100

# 触键时间和松键时间
attack_time = 0.01 # 攻击时间
release_time = 0.2 # 松键时间

# 模拟钢琴音色的 ADSR 包络
adsr = np.concatenate([np.linspace(0, 1, int(fs * attack_time)),
                        np.linspace(1, 0.8, int(fs * release_time)),
                        np.linspace(0.8, 0, int(fs * release_time))])


adsr = np.concatenate([np.linspace(0, 1, int(fs * attack_time)),
                        np.linspace(1, 0.8, int(fs * release_time)),
                        np.linspace(0.8, 0, int(fs * release_time))])


# 钢琴的基音频率
f0 = 261.63 # C4

# 生成钢琴音色
note = np.sin(2 * np.pi * f0 * np.arange(fs) / fs)


# 使用 np.tile() 函数将 adsr 扩充到和 note 一样的长度
adsr = np.tile(adsr, int(np.ceil(len(note) / len(adsr))))

# 将音符乘以 ADSR 包络
note *= adsr[:len(note)]

# 绘制波形图
plt.figure(figsize=(10, 5))
plt.plot(note)
plt.xlabel('Time (samples) 时间采样')
plt.ylabel('Amplitude 振幅')
plt.title('Piano Waveform 钢琴波形')
plt.grid()
plt.show()
import numpy as np
import matplotlib.pyplot as plt
plt.rc("font",family='YouYuan')
plt.rcParams['axes.unicode_minus']=False

# 采样率
fs = 44100

# 数字信号维度
n = np.arange(fs)

# 号角的基音频率
f0 = 220.0

# ADSR 包络
attack_time = 0.01
release_time = 0.3

adsr = np.concatenate([np.linspace(0, 1, int(fs * attack_time)),
                        np.linspace(1, 0.8, int(fs * release_time)),
                        np.linspace(0.8, 0, int(fs * release_time))])

# 号角音色
note = np.sin(2 * np.pi * f0 * n / fs)

# 添加上升和下降的音调特性
note *= np.cos(np.pi * np.power(n / fs, 0.5))

# 使用 np.tile() 函数将 adsr 扩充到和 note 一样的长度
adsr = np.tile(adsr, int(np.ceil(len(note) / len(adsr))))

# 将音符乘以 ADSR 包络
note *= adsr[:len(note)]


# 绘制波形图
plt.figure(figsize=(10, 5))
plt.plot(n, note)
plt.xlabel('Time (samples)')
plt.ylabel('Amplitude')
plt.title('Horn Waveform')
plt.grid()
plt.show()

