博主前期相关的博客见下:
cs109-energy+哈佛大学能源探索项目 Part-1(项目背景)
cs109-energy+哈佛大学能源探索项目 Part-2.1(Data Wrangling)
cs109-energy+哈佛大学能源探索项目 Part-2.2(Data Wrangling)
这次是讲数据的探索性分析。
Exploratory Analysis
探索性分析
%matplotlib inline

import requests
from StringIO import StringIO
import numpy as np
import pandas as pd # pandas
import matplotlib.pyplot as plt # module for plotting
import datetime as dt # module for manipulating dates and times
import numpy.linalg as lin # module for performing linear algebra operations
from __future__ import division
import matplotlib

pd.options.display.mpl_style = 'default'
requests 库用于发送 HTTP 请求和处理响应。
StringIO 模块用于创建文本数据流。
numpy.linalg 模块提供了线性代数函数。
from future import division 语句将 Python 2.x 中除法运算符 / 的行为更改为像 Python 3.x 一样,其中除法始终返回一个浮点数。
最后一行 pd.options.display.mpl_style = ‘default’ 将 pandas 数据帧的默认样式设置为 matplotlib 提供的 default 样式。
Monthly energy consumption
每月的能量消耗
pd.options.display.mpl_style = 'default'
consumption = pd.read_csv('Data/Monthly_Energy_Gund.csv')
for i in range(len(consumption)):
    consumption['CW-kBtu'][i] = float(consumption['CW-kBtu'].values[i].replace(',', ''))
    consumption['EL-kBtu'][i] = float(consumption['EL-kBtu'].values[i].replace(',', ''))
    consumption['ST-kBtu'][i] = float(consumption['ST-kBtu'].values[i].replace(',', ''))

time_index = np.arange(len(consumption))
plt.figure(figsize=(15,7))
b1 = plt.bar(time_index, consumption['EL-kBtu'], width = 0.6, color='g')
b2 = plt.bar(time_index, consumption['ST-kBtu'], bottom=consumption['EL-kBtu'], width = 0.6, color='r')
b3 = plt.bar(time_index, consumption['CW-kBtu'], bottom=consumption['EL-kBtu']+consumption['ST-kBtu'], width = 0.6, color='b')

plt.xticks(time_index+0.5, consumption['Time'], rotation=90)
plt.title('Monthly Energy consumption')
plt.xlabel('Month')
plt.ylabel('Consumption (kBtu)')
plt.legend( (b1, b2, b3), ('Electricity', 'Steam', 'Chilled Water') )
pd.options.display.mpl_style = 'default' 这行代码的作用是将 pandas 显示的默认风格设置为 matplotlib 提供的 ‘default’ 风格。
下面的代码将读取名为’Monthly_Energy_Gund.csv’的数据文件,并使用循环将每个单元格中的逗号删除并转换为浮点数,以便进行后续的可视化操作。
接下来,使用 numpy.arange 创建时间序列索引,然后使用 matplotlib 创建一个堆叠条形图,用不同的颜色表示每个月的电力、蒸汽和冷却水的消耗量。最后,通过添加标签和标题等元素来完善图表。

Electricity energy consumption pattern
电力能源消耗模式
“pattern” 可以理解为“模式”,是指在一定时间范围内,某种现象、行为或趋势的重复出现或表现出来的规律性。在能源领域中,“Electricity energy consumption pattern” 指的是电力能源在一定时间范围内的消耗规律,包括消耗的数量、消耗的时间分布、消耗的趋势等。
First, let’s see what we can find in hourly and daily electricity energy consumption.
hourlyElectricity = pd.read_excel('Data/hourlyElectricity.xlsx')

index = (hourlyElectricity['startTime'] >= np.datetime64('2011-07-03')) & (hourlyElectricity['startTime'] < np.datetime64('2014-10-26'))
hourlyElectricityForVisualization = hourlyElectricity.loc[index,'electricity-kWh']

print "Data length: ", len(hourlyElectricityForVisualization)/24/7, " weeks"
选择特定时间的 hourly 数据分析;
data = hourlyElectricityForVisualization.values
data = data.reshape((len(data)/24/7,24*7))

from mpl_toolkits.axes_grid1 import make_axes_locatable

yTickLabels = pd.DataFrame(data = pd.date_range(start = '2011-07-03', end = '2014-10-25', freq = '4W'), columns=['datetime'])
yTickLabels['date'] = yTickLabels['datetime'].apply(lambda x: x.strftime('%Y-%m-%d'))

s1 = ['Sun ', 'Mon ', 'Tue ', 'Wed ', 'Thu ', 'Fri ', 'Sat ']
s2 = ['12AM ', '6 AM', '12PM', '6 PM']
s1 = np.repeat(s1, 4)
s2 = np.tile(s2, 7)
xTickLabels = np.char.add(s1, s2)

fig = plt.figure(figsize=(20,30))
ax = plt.gca()
im = ax.imshow(data, vmin =0, vmax = 500, interpolation='nearest', origin='upper')
# create an axes on the right side of ax. The width of cax will be 5%
# of ax and the padding between cax and ax will be fixed at 0.05 inch.
divider = make_axes_locatable(ax)
cax = divider.append_axes("right", size="3%", pad=0.2)
ax.set_yticks(range(0,173,4))
ax.set_yticklabels(labels = yTickLabels['date'], fontsize = 14)

ax.set_xticks(range(0,168,6))
ax.set_xticklabels(labels = xTickLabels, fontsize = 14, rotation = 90)

plt.colorbar(im, cax=cax)
绘制逐日的数据

上图中为选择的每天的数据;横轴为一周中的小时的数据;空白的部分为缺失数据的部分
dailyElectricity = pd.read_excel('Data/dailyElectricity.xlsx')

index = (dailyElectricity['startDay'] >= np.datetime64('2011-07-03')) & (dailyElectricity['startDay'] < np.datetime64('2014-10-19'))
dailyElectricityForVisualization = dailyElectricity.loc[index,'electricity-kWh']

print "Data length: ", len(dailyElectricityForVisualization)/7, " weeks"

data = dailyElectricityForVisualization.values
data = data.reshape((len(data)/7/4,7*4))

from mpl_toolkits.axes_grid1 import make_axes_locatable

yTickLabels = pd.DataFrame(data = pd.date_range(start = '2011-07-03', end = '2014-10-25', freq = '4W'), columns=['datetime'])
yTickLabels['date'] = yTickLabels['datetime'].apply(lambda x: x.strftime('%Y-%m-%d'))

s = ['Sun ', 'Mon ', 'Tue ', 'Wed ', 'Thu ', 'Fri ', 'Sat ']
xTickLabels = np.tile(s, 4)

fig = plt.figure(figsize=(14,15))
ax = plt.gca()
im = ax.imshow(data, interpolation='nearest', origin='upper')
# create an axes on the right side of ax. The width of cax will be 5%
# of ax and the padding between cax and ax will be fixed at 0.05 inch.
divider = make_axes_locatable(ax)
cax = divider.append_axes("right", size="3%", pad=0.2)
ax.set_yticks(range(43))
ax.set_yticklabels(labels = yTickLabels['date'], fontsize = 14)

ax.set_xticks(range(28))
ax.set_xticklabels(labels = xTickLabels, fontsize = 14, rotation = 90)

plt.colorbar(im, cax=cax)
plt.show()

plt.figure()
fig = dailyElectricity.plot(figsize = (15, 6))
fig.set_axis_bgcolor('w')
plt.title('All the daily electricity data', fontsize = 16)
plt.ylabel('kWh')
plt.show()
这里绘制的daily的数据
这里是横向累计的(hourly累的层数更多)


dailyElectricity = pd.read_excel('Data/dailyElectricity.xlsx')
weeklyElectricity = dailyElectricity.asfreq('W', how='sume', normalize=False)

plt.figure()
fig = weeklyElectricity['2012-01':'2014-01'].plot(figsize = (15, 6), fontsize = 15, marker = 'o', linestyle='--')
fig.set_axis_bgcolor('w')
plt.title('Weekly electricity data', fontsize = 16)
plt.ylabel('kWh')
ax = plt.gca()
plt.show()
做的是每周的数据
findings
- 电力消耗表现出强烈的周期性模式。您可以清楚地看到白天和晚上、工作日和周末之间的不同。
- 看起来在每学期期末,电力使用量会逐渐增加,达到高峰,这可能代表了学习模式。学生们会越来越努力地准备期末考试。然后,在学期结束后会有一个低谷,包括圣诞假期。在一月份和暑期学期以及春假期间,校园可能相对空旷,电力消耗相对较低。 (部分文字由Steven贡献)
- Selfideas:每学期的增加可能也和温度相关(低温需要加热);当然在前面的分析中也涉及到分析气候部分
Relationship between energy consumption and features
能量消耗与特征之间的关系
我们考虑的主要特征:在这一节中,我们将电力、冷水和蒸汽的消耗量(每小时和每日)与各种特征进行绘图比较。
# Read in data from Preprocessing results

hourlyElectricityWithFeatures = pd.read_excel('Data/hourlyElectricityWithFeatures.xlsx')
hourlyChilledWaterWithFeatures = pd.read_excel('Data/hourlyChilledWaterWithFeatures.xlsx')
hourlySteamWithFeatures = pd.read_excel('Data/hourlySteamWithFeatures.xlsx')

dailyElectricityWithFeatures = pd.read_excel('Data/dailyElectricityWithFeatures.xlsx')
dailyChilledWaterWithFeatures = pd.read_excel('Data/dailyChilledWaterWithFeatures.xlsx')
dailySteamWithFeatures = pd.read_excel('Data/dailySteamWithFeatures.xlsx')

# An example of Dataframe
dailyChilledWaterWithFeatures.head()

A note for features
Nomenclature (Alphabetically)
特征说明(符号(按字母顺序))
- coolingDegrees:
制冷度数:如果T-C-12>0,则为T-C-12,否则为0。假设当室外温度低于12°C时,不需要制冷,这对许多建筑物来说是正确的。这将对每日预测有用,因为小时制冷度数的平均值比小时温度的平均值更好。
- cosHour:
cos ( hourOfDay ⋅ 2 π 24 ) \text{cos}(\text{hourOfDay} \cdot \frac{2\pi}{24}) cos(hourOfDay⋅242π)
- dehumidification
如果 humidityRatio-0.00886> 0,then = humidityRatio - 0.00886,否则= 0。这对冷水预测特别是每日冷水预测很有用。
- heatingDegrees
if 15 - T-C > 0, then = 15 - T-C, else = 0. 假设当室外温度高于15°C时,不需要供暖。这对每日预测有用,因为小时供暖度数的平均值比小时温度的平均值更好。
- occupancy
一个介于0和1之间的数字。0表示没有人员占用,1表示正常占用。这是根据假期、周末和学校学术日历进行估算的。
- pressure-mbar
atmospheric pressure
- RH-%
Relative humidity
- Tdew-C
Dew-point temperature
- Humidity ratio
Humidity ratio 是预测冷水的重要因素,因为冷水也用于干燥排放到房间中的空气。使用湿度比比使用相对湿度和露点温度更有效和有效。
holidays = pd.read_excel('Data/holidays.xlsx')
holidays

节假日的特征,如果全占的话设置为1
Energy Consumption versus Features
能量消耗与特征的关系
Temperature & cooling/heating degrees
fig, ax = plt.subplots(3, 2, sharey='row', figsize = (15, 12))
fig.subplots_adjust(hspace = 0.1, wspace = 0.1)

hourlyElectricityWithFeatures.plot(kind = 'scatter', x = 'T-C', y = 'electricity-kWh', ax = ax[0,0])
hourlyElectricityWithFeatures.plot(kind = 'scatter', x = 'coolingDegrees', y = 'electricity-kWh', ax = ax[0,1])
hourlyChilledWaterWithFeatures.plot(kind = 'scatter', x = 'T-C', y = 'chilledWater-TonDays', ax = ax[1,0])
hourlyChilledWaterWithFeatures.plot(kind = 'scatter', x = 'coolingDegrees', y = 'chilledWater-TonDays', ax = ax[1,1])
hourlySteamWithFeatures.plot(kind = 'scatter', x = 'T-C', y = 'steam-LBS', ax = ax[2,0])
hourlySteamWithFeatures.plot(kind = 'scatter', x = 'heatingDegrees', y = 'steam-LBS', ax = ax[2,1])

for i in range(3):
    ax[i,0].tick_params(which=u'major', reset=False, axis = 'y', labelsize = 13)
    #ax[i,0].set_axis_bgcolor('w')

for i in range(2):
    ax[2,i].tick_params(which=u'major', reset=False, axis = 'x', labelsize = 13)

ax[2,0].set_xlabel(r'Temperature ($^\circ$C)', fontsize = 13)
ax[2,0].set_xlim([-20,40])
ax[0,0].set_title('Hourly energy use versus ourdoor temperature', fontsize = 15)

ax[2,1].set_xlabel(r'Cooling/Heating degrees ($^\circ$C)', fontsize = 13)
#ax[2,1].set_xlim([0,30])
ax[0,1].set_title('Hourly energy use versus cooling/heating degrees', fontsize = 15)

plt.show()

冷水和蒸汽的消耗量与温度存在强烈的相关性。然而,仅使用室外温度或制冷/制热度来预测每小时的冷水和蒸汽消耗是不足够的。(第二行;第三行)
fig, ax = plt.subplots(3, 2, sharey='row', figsize = (15, 12))
fig.subplots_adjust(hspace = 0.1, wspace = 0.1)

dailyElectricityWithFeatures.plot(kind = 'scatter', x = 'T-C', y = 'electricity-kWh', ax = ax[0,0])
dailyElectricityWithFeatures.plot(kind = 'scatter', x = 'coolingDegrees', y = 'electricity-kWh', ax = ax[0,1])
dailyChilledWaterWithFeatures.plot(kind = 'scatter', x = 'T-C', y = 'chilledWater-TonDays', ax = ax[1,0])
dailyChilledWaterWithFeatures.plot(kind = 'scatter', x = 'coolingDegrees', y = 'chilledWater-TonDays', ax = ax[1,1])
dailySteamWithFeatures.plot(kind = 'scatter', x = 'T-C', y = 'steam-LBS', ax = ax[2,0])
dailySteamWithFeatures.plot(kind = 'scatter', x = 'heatingDegrees', y = 'steam-LBS', ax = ax[2,1])

for i in range(3):
    ax[i,0].tick_params(which=u'major', reset=False, axis = 'y', labelsize = 13)
    #ax[i,0].set_axis_bgcolor('w')

for i in range(2):
    ax[2,i].tick_params(which=u'major', reset=False, axis = 'x', labelsize = 13)

ax[2,0].set_xlabel(r'Temperature ($^\circ$C)', fontsize = 13)
ax[2,0].set_xlim([-20,40])
ax[0,0].set_title('Daily energy use versus ourdoor temperature', fontsize = 15)

ax[2,1].set_xlabel(r'Cooling/Heating degrees ($^\circ$C)', fontsize = 13)
#ax[2,1].set_xlim([0,30])
ax[0,1].set_title('Daily energy use versus cooling/heating degrees', fontsize = 15)

plt.show()

每日的冷水和蒸汽消耗量与室外温度存在强烈的线性关系。如果使用制冷/制热度代替温度差,可能可以避免逐步线性回归。
湿度radio & dehumidification
fig, ax = plt.subplots(3, 2, sharex = 'col', sharey='row', figsize = (15, 12))
fig.subplots_adjust(hspace = 0.1, wspace = 0.1)

hourlyElectricityWithFeatures.plot(kind = 'scatter', x = 'humidityRatio-kg/kg', y = 'electricity-kWh', ax = ax[0,0])
hourlyElectricityWithFeatures.plot(kind = 'scatter', x = 'dehumidification', y = 'electricity-kWh', ax = ax[0,1])
hourlyChilledWaterWithFeatures.plot(kind = 'scatter', x = 'humidityRatio-kg/kg', y = 'chilledWater-TonDays', ax = ax[1,0])
hourlyChilledWaterWithFeatures.plot(kind = 'scatter', x = 'dehumidification', y = 'chilledWater-TonDays', ax = ax[1,1])
hourlySteamWithFeatures.plot(kind = 'scatter', x = 'humidityRatio-kg/kg', y = 'steam-LBS', ax = ax[2,0])
hourlySteamWithFeatures.plot(kind = 'scatter', x = 'dehumidification', y = 'steam-LBS', ax = ax[2,1])

for i in range(3):
    ax[i,0].tick_params(which=u'major', reset=False, axis = 'y', labelsize = 13)
    #ax[i,0].set_axis_bgcolor('w')

for i in range(2):
    ax[2,i].tick_params(which=u'major', reset=False, axis = 'x', labelsize = 13)

ax[2,0].set_xlabel(r'Humidity ratio (kg/kg)', fontsize = 13)
ax[2,0].set_xlim([0,0.02])
ax[0,0].set_title('Hourly energy use versus humidity ratio', fontsize = 15)

ax[2,1].set_xlabel(r'Dehumidification', fontsize = 13)
ax[2,1].set_xlim([0,0.01])
ax[0,1].set_title('Hourly energy use versus dehumidification', fontsize = 15)

plt.show()

湿度radio绝对有助于预测冷水消耗量,并且比相对dehumidification更好。
fig, ax = plt.subplots(3, 2, sharex = 'col', sharey='row', figsize = (15, 12))
fig.subplots_adjust(hspace = 0.1, wspace = 0.1)

dailyElectricityWithFeatures.plot(kind = 'scatter', x = 'humidityRatio-kg/kg', y = 'electricity-kWh', ax = ax[0,0])
dailyElectricityWithFeatures.plot(kind = 'scatter', x = 'dehumidification', y = 'electricity-kWh', ax = ax[0,1])
dailyChilledWaterWithFeatures.plot(kind = 'scatter', x = 'humidityRatio-kg/kg', y = 'chilledWater-TonDays', ax = ax[1,0])
dailyChilledWaterWithFeatures.plot(kind = 'scatter', x = 'dehumidification', y = 'chilledWater-TonDays', ax = ax[1,1])
dailySteamWithFeatures.plot(kind = 'scatter', x = 'humidityRatio-kg/kg', y = 'steam-LBS', ax = ax[2,0])
dailySteamWithFeatures.plot(kind = 'scatter', x = 'dehumidification', y = 'steam-LBS', ax = ax[2,1])

for i in range(3):
    ax[i,0].tick_params(which=u'major', reset=False, axis = 'y', labelsize = 13)
    #ax[i,0].set_axis_bgcolor('w')

for i in range(2):
    ax[2,i].tick_params(which=u'major', reset=False, axis = 'x', labelsize = 13)

ax[2,0].set_xlabel(r'Humidity ratio (kg/kg)', fontsize = 13)
ax[2,0].set_xlim([0,0.02])
ax[0,0].set_title('Daily energy use versus humidity ratio', fontsize = 15)

ax[2,1].set_xlabel(r'Dehumidification', fontsize = 13)
ax[2,1].set_xlim([0,0.01])
ax[0,1].set_title('Daily energy use versus dehumidification', fontsize = 15)

plt.show()

Dehumidification is designed for chilled water prediction, not steam.
分别对比hourly 和daily
cosHour
fig, ax = plt.subplots(3, 2, sharex = 'col', figsize = (15, 12))
fig.subplots_adjust(hspace = 0.1, wspace = 0.15)

hourlyElectricityWithFeatures.plot(kind = 'scatter', x = 'occupancy', y = 'electricity-kWh', ax = ax[0,0])
dailyElectricityWithFeatures.plot(kind = 'scatter', x = 'occupancy', y = 'electricity-kWh', ax = ax[0,1])
hourlyChilledWaterWithFeatures.plot(kind = 'scatter', x = 'occupancy', y = 'chilledWater-TonDays', ax = ax[1,0])
dailyChilledWaterWithFeatures.plot(kind = 'scatter', x = 'occupancy', y = 'chilledWater-TonDays', ax = ax[1,1])
hourlySteamWithFeatures.plot(kind = 'scatter', x = 'occupancy', y = 'steam-LBS', ax = ax[2,0])
dailySteamWithFeatures.plot(kind = 'scatter', x = 'occupancy', y = 'steam-LBS', ax = ax[2,1])

for i in range(3):
    ax[i,0].tick_params(which=u'major', reset=False, axis = 'y', labelsize = 13)
    #ax[i,0].set_axis_bgcolor('w')

for i in range(2):
    ax[2,i].tick_params(which=u'major', reset=False, axis = 'x', labelsize = 13)

ax[2,0].set_xlabel(r'Occupancy', fontsize = 13)
#ax[2,0].set_xlim([0,0.02])
ax[0,0].set_title('Hourly energy use versus occupancy', fontsize = 15)

ax[2,1].set_xlabel(r'Occupancy', fontsize = 13)

#ax[2,1].set_xlim([0,0.01])
ax[0,1].set_title('Daily energy use versus occupancy', fontsize = 15)

plt.show()
Occupancy is derived from academic calendar, holidays and weekends. Basiaclly, we just assign a lower value to holidays, weekends and summer. cosHour, occupancy might help, might not, since they are just estimation of occupancy.
fig, ax = plt.subplots(3, 1, sharex = 'col', figsize = (8, 12))
fig.subplots_adjust(hspace = 0.1, wspace = 0.15)

hourlyElectricityWithFeatures.plot(kind = 'scatter', x = 'cosHour', y = 'electricity-kWh', ax = ax[0])
hourlyChilledWaterWithFeatures.plot(kind = 'scatter', x = 'cosHour', y = 'chilledWater-TonDays', ax = ax[1])
hourlySteamWithFeatures.plot(kind = 'scatter', x = 'cosHour', y = 'steam-LBS', ax = ax[2])

for i in range(3):
    ax[i].tick_params(which=u'major', reset=False, axis = 'y', labelsize = 13)
    #ax[i,0].set_axis_bgcolor('w')

ax[2].tick_params(which=u'major', reset=False, axis = 'x', labelsize = 13)

ax[2].set_xlabel(r'cosHour', fontsize = 13)
#ax[2,0].set_xlim([0,0.02])
ax[0].set_title('Hourly energy use versus cosHourOfDay', fontsize = 15)

plt.show()

solar radiation & wind speed
fig, ax = plt.subplots(3, 2, sharex = 'col', sharey = 'row', figsize = (15, 12))
fig.subplots_adjust(hspace = 0.1, wspace = 0.15)

hourlyElectricityWithFeatures.plot(kind = 'scatter', x = 'solarRadiation-W/m2', y = 'electricity-kWh', ax = ax[0,0])
hourlyElectricityWithFeatures.plot(kind = 'scatter', x = 'windSpeed-m/s', y = 'electricity-kWh', ax = ax[0,1])
hourlyChilledWaterWithFeatures.plot(kind = 'scatter', x = 'solarRadiation-W/m2', y = 'chilledWater-TonDays', ax = ax[1,0])
hourlyChilledWaterWithFeatures.plot(kind = 'scatter', x = 'windSpeed-m/s', y = 'chilledWater-TonDays', ax = ax[1,1])
hourlySteamWithFeatures.plot(kind = 'scatter', x = 'solarRadiation-W/m2', y = 'steam-LBS', ax = ax[2,0])
hourlySteamWithFeatures.plot(kind = 'scatter', x = 'windSpeed-m/s', y = 'steam-LBS', ax = ax[2,1])

for i in range(3):
    ax[i,0].tick_params(which=u'major', reset=False, axis = 'y', labelsize = 13)
    #ax[i,0].set_axis_bgcolor('w')

for i in range(2):
    ax[2,i].tick_params(which=u'major', reset=False, axis = 'x', labelsize = 13)

ax[2,0].set_xlabel(r'Solar radiation (W/m2)', fontsize = 13)
#ax[2,0].set_xlim([0,0.02])
ax[0,0].set_title('Hourly energy use versus solar radiation', fontsize = 15)

ax[2,1].set_xlabel(r'Wind speed (m/s)', fontsize = 13)

#ax[2,1].set_xlim([0,0.01])
ax[0,1].set_title('Hourly energy use versus wind speed', fontsize = 15)

plt.show()

hourly energy vs solar radiation & wind speed
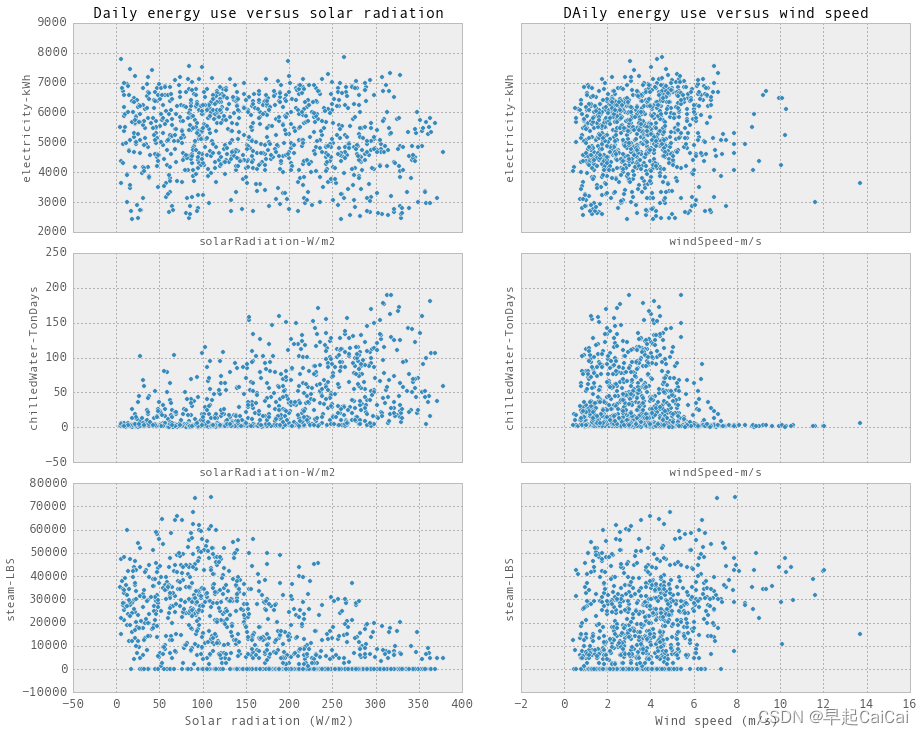
在这里主要是三个纵坐标:每小时电力、冷水和蒸汽消耗量
fig, ax = plt.subplots(3, 2, sharex = 'col', sharey = 'row', figsize = (15, 12))
fig.subplots_adjust(hspace = 0.1, wspace = 0.15)

dailyElectricityWithFeatures.plot(kind = 'scatter', x = 'solarRadiation-W/m2', y = 'electricity-kWh', ax = ax[0,0])
dailyElectricityWithFeatures.plot(kind = 'scatter', x = 'windSpeed-m/s', y = 'electricity-kWh', ax = ax[0,1])
dailyChilledWaterWithFeatures.plot(kind = 'scatter', x = 'solarRadiation-W/m2', y = 'chilledWater-TonDays', ax = ax[1,0])
dailyChilledWaterWithFeatures.plot(kind = 'scatter', x = 'windSpeed-m/s', y = 'chilledWater-TonDays', ax = ax[1,1])
dailySteamWithFeatures.plot(kind = 'scatter', x = 'solarRadiation-W/m2', y = 'steam-LBS', ax = ax[2,0])
dailySteamWithFeatures.plot(kind = 'scatter', x = 'windSpeed-m/s', y = 'steam-LBS', ax = ax[2,1])

for i in range(3):
    ax[i,0].tick_params(which=u'major', reset=False, axis = 'y', labelsize = 13)
    #ax[i,0].set_axis_bgcolor('w')

for i in range(2):
    ax[2,i].tick_params(which=u'major', reset=False, axis = 'x', labelsize = 13)

ax[2,0].set_xlabel(r'Solar radiation (W/m2)', fontsize = 13)
#ax[2,0].set_xlim([0,0.02])
ax[0,0].set_title('Daily energy use versus solar radiation', fontsize = 15)

ax[2,1].set_xlabel(r'Wind speed (m/s)', fontsize = 13)

#ax[2,1].set_xlim([0,0.01])
ax[0,1].set_title('DAily energy use versus wind speed', fontsize = 15)

plt.show()
对比小时的每天的
Solar radiation and wind speed are not that important and it is correlated with temperature.
Finds
-
电力与天气数据(温度)无关。使用天气信息来预测电力将不起作用。我认为它主要取决于时间/占用率。但我们仍然可以进行一些模式探索,以找出白天/晚上、工作日/周末、学校日/假期的用电模式。事实上,我们应该从月度数据中就已经注意到了这一点。
-
冷水和蒸汽消耗量与温度和湿度强相关。每日的冷水和蒸汽消耗量与制冷度和制热度存在良好的线性关系。因此,简单的线性回归可能已经足够准确。
-
虽然冷水和蒸汽消耗量与天气强相关,但根据上述图表,使用天气信息来预测每小时的冷水和蒸汽是不足够的。这是因为操作时间表会影响每小时的能源消耗。在每小时的冷水和蒸汽预测中必须包括占用率和操作时间表。
-
湿度比绝对有助于预测冷水消耗量,并且比相对湿度和露点温度更好。
-
制冷度和制热度将有助于预测每日的冷水和蒸汽。如果使用制冷/制热度代替温度差,可能可以避免逐步线性回归。
-
占用率是从学术日历、假期和周末中派生出来的。基本上,我们只是将假期、周末和夏季的值设为较低值。cosHour 和占用率可能有帮助,也可能没有,因为它们只是占用率的估计值。
Reference
cs109-energy+哈佛大学能源探索项目 Part-1(项目背景)
cs109-energy+哈佛大学能源探索项目 Part-2.1(Data Wrangling)
cs109-energy+哈佛大学能源探索项目 Part-2.2(Data Wrangling)
一个完整的机器学习项目实战代码+数据分析过程:哈佛大学能耗预测项目
Part 1-3 Project Overview, Data Wrangling and Exploratory Analysis-DEC10
Prediction of Buildings Energy Consumption
