M_Map工具箱简介及地理图形绘制
- 1 M_Map简介
- 1.1 具体代码说明
- 2 地理图形绘制案例
- 2.1 M_Map给定案例
- 2.1.1 M_Map Logo
- 2.1.2 Lambert Conformal Conic projection of North American Topography
- 2.1.3 Stereographic projection of North Polar regions
- 2.1.4 Colourmaps
- 2.2 案例
- 参考
1 M_Map简介
官网-M_Map: A mapping package for Matlab

M_Map 是一组为 Matlab 编写的映射工具(它也适用于Octave)。M_Map包括:
- 使用球形和椭圆体地球模型以 20 种不同的投影方式(并确定逆向映射)投影数据的例程
- 一个网格生成例程,用于在纬度/经度或平面 X/Y 方面制作具有限制的漂亮轴
- 海岸线数据库(1/4 度分辨率)
- 全球高程数据库(1 度分辨率)
- 连接到免费提供的高分辨率海岸线和测深数据库
- 其他有用的东西
1.1 具体代码说明
m_proj('oblique mercator');
m_proj('oblique mercator','longitudes',[-132 -125], ...
           'latitudes',[56 40],'direction','vertical','aspect',.5);
- 设置投影类型,默认投影参数(oblique mercator),也可以自己设置参数,详细参见用户手册(Users Guide)
| 投影类型 | 投影名称 | 说明 |
|---|---|---|
| Azimuthal projections(方位投影) | Stereographic 立体影像 | 立体投影是等角的,但不是等面积的。该投影通常用于极地地区。 |
| Azimuthal projections(方位投影) | Orthographic 正字投影 | 这个投影既不是等面积的,也不是共形的,而是类似于地球的透视视图。 |
| Azimuthal projections(方位投影) | Azimuthal Equal-area 方位等积 | 有时称为 Lambert 方位角等积投影,这种映射是等面积的但不是共形的。 |
| Azimuthal projections(方位投影) | Azimuthal Equidistant 方位等距 | 该投影既不是等积投影也不是等角投影,但距中心点的所有距离和方向都是真实的。 |
| Azimuthal projections(方位投影) | Gnomonic | 该投影既不是等积投影也不是等角投影,但地图上的所有直线(不仅是通过中心的直线)都是大圆路线。然而,地图的边缘有很大程度的扭曲,所以最大半径应该保持相当小——最多 20 或 30 度。 |
| Azimuthal projections(方位投影) | Satellite | 这是地球的透视图,由卫星在指定高度看到。 |
| Conic Projections(圆锥投影) | Albers Equal-Area Conic | 此投影是等面积的,但不是共形的 |
| Conic Projections(圆锥投影) | Lambert Conformal Conic | 此投影是等角投影,但不是等积投影。 |
| Cylindrical and Pseudo-cylindrical Projections(圆柱和伪圆柱投影) | Mercator 墨卡托 | 这是一个共形贴图,基于环绕赤道的切线圆柱体。此投影上的直线是等向线(即轨道后跟恒定方位的路线)。 |
| Cylindrical and Pseudo-cylindrical Projections(圆柱和伪圆柱投影) | Equidistant Cylindrical 等距圆柱 | 该投影既不是等积投影也不是等角投影。它由等距的纬度和经度线组成,经常用于快速绘制数据。 |
| … | … | … |
- 关于经度的设置,负号西经,正号为东经
2 地理图形绘制案例
2.1 M_Map给定案例
2.1.1 M_Map Logo
成图如下:

相关MATLAB代码:
%% Example1:M_Map Logo
figure(1);

m_proj('ortho','lat',48','long',-123');
m_coast('patch','r');
m_grid('linest','-','xticklabels',[],'yticklabels',[]);

patch(.55*[-1 1 1 -1],.25*[-1 -1 1 1]-.55,'w');
text(0,-.55,'M\_Map','fontsize',25,'color','b',...
    'verticalalignment','middle','horizontalalignment','center');
set(gca,'Layer','top','FontSize',14,'Fontname', 'Times New Roman');
2.1.2 Lambert Conformal Conic projection of North American Topography
成图如下:

相关MATLAB代码:
%% Example2:Lambert Conformal Conic projection of North American Topography
figure(2);

m_proj('lambert','long',[-160 -40],'lat',[30 80]);
m_coast('patch',[1 .85 .7]);
m_elev('contourf',[500:500:6000]);
m_grid('box','fancy','tickdir','in');
colormap(flipud(copper));
set(gca,'Layer','top','FontSize',14,'Fontname', 'Times New Roman');
2.1.3 Stereographic projection of North Polar regions
成图如下:

相关MATLAB代码:
%% Example3:Stereographic projection of North Polar regions
% Note that coastline is drawn OVER the grid because of the order in which
% the two routines are called

figure(3);

m_proj('stereographic','lat',90,'long',30,'radius',25);
m_elev('contour',[-3500:1000:-500],'edgecolor','b');
m_grid('xtick',12,'tickdir','out','ytick',[70 80],'linest','-');
m_coast('patch',[.7 .7 .7],'edgecolor','r');
set(gca,'Layer','top','FontSize',14,'Fontname', 'Times New Roman');
2.1.4 Colourmaps
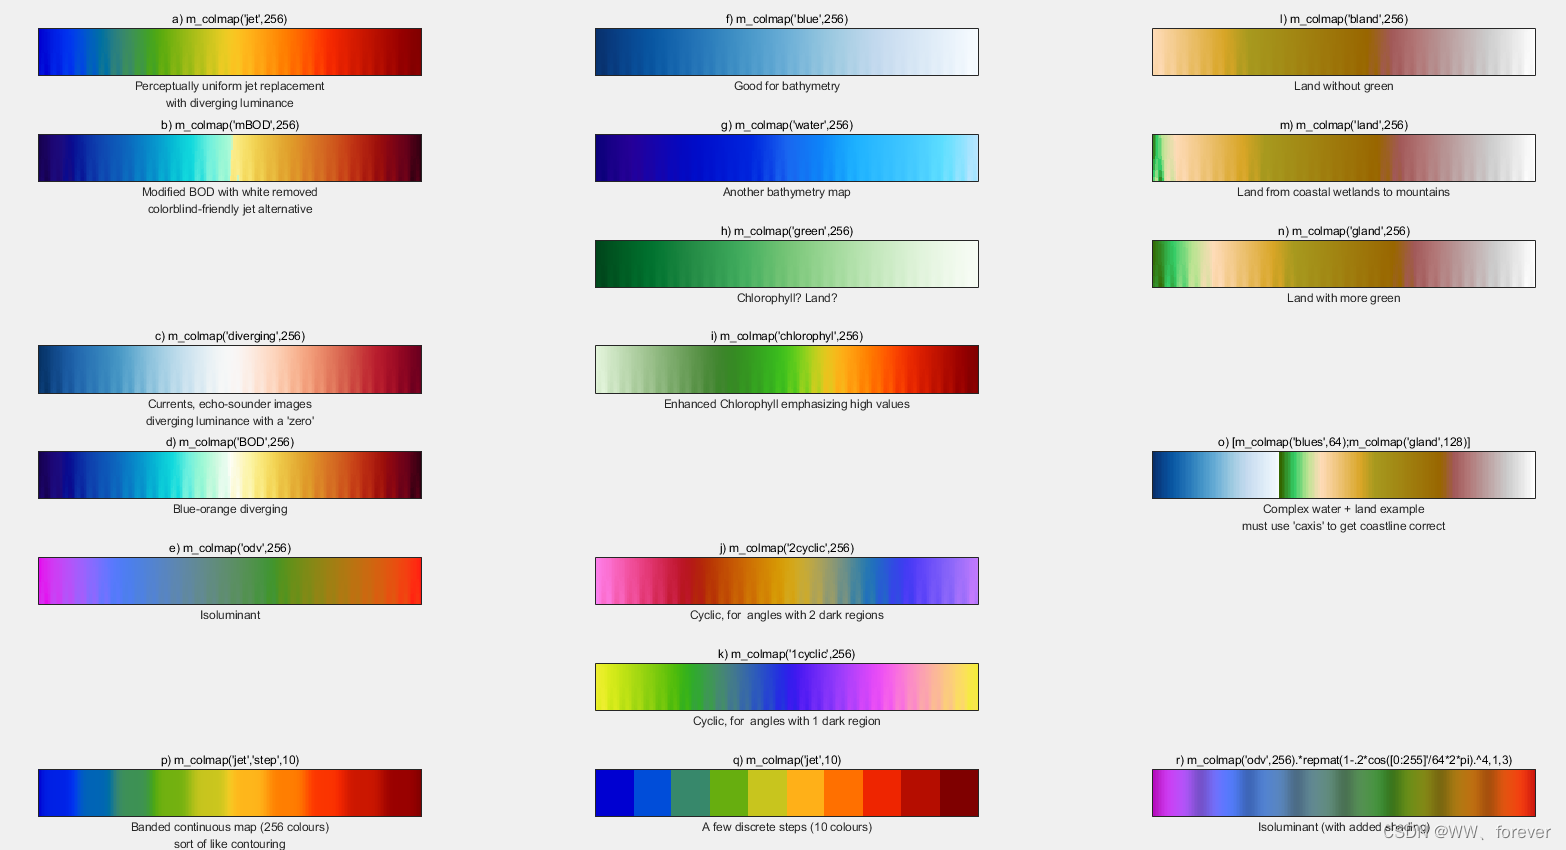
相关MATLAB代码:
 % This command generates the figure
 % In each subplot title is the M_COLMAP call that
 % generated the colourmap displayed.
 %
 % Uses of these colourmaps can be seen
 % in other maps in this gallery.

 m_colmap demo

