一、说明
根据定义,图是节点(顶点)以及已识别的节点对(称为边、链接等)的集合。在 NetworkX 中,节点可以是任何可哈希对象,例如文本字符串、图像、XML 对象、另一个图形、自定义节点对象等。
如果不知道networkx基础的制图,请先看看下文:
【python视图1】networkx操作Graph图
【python视图2】基于networkx的10个绘图技巧
二、神奇制图
2.1 绘制彩虹图
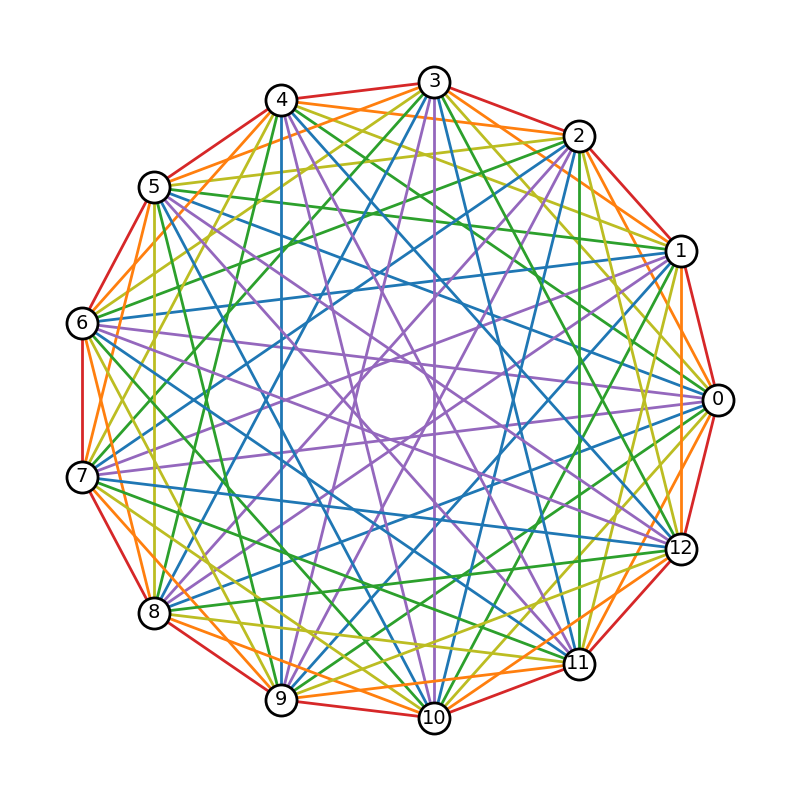
生成一个完整的图形,其中包含 13 个节点,呈圆形布局,边按节点距离着色。节点距离由沿圆上任意两个节点之间的弧线遍历的最小节点数给出。
这样的图是 Ringel 猜想的主题,它指出:任何具有 2n + 1 个节点的完整图都可以被任何具有 n + 1 个节点的树平铺(即树的副本可以放置在完整图上,使得图中的每条边完整的图被恰好覆盖一次)。边缘着色有助于确定如何放置树副本。
- 效果图:
- 代码:
import matplotlib.pyplot as plt
import networkx as nx

# A rainbow color mapping using matplotlib's tableau colors
node_dist_to_color = {
    1: "tab:red",
    2: "tab:orange",
    3: "tab:olive",
    4: "tab:green",
    5: "tab:blue",
    6: "tab:purple",
}

# Create a complete graph with an odd number of nodes
nnodes = 13
G = nx.complete_graph(nnodes)

# A graph with (2n + 1) nodes requires n colors for the edges
n = (nnodes - 1) // 2
ndist_iter = list(range(1, n + 1))

# Take advantage of circular symmetry in determining node distances
ndist_iter += ndist_iter[::-1]


def cycle(nlist, n):
    return nlist[-n:] + nlist[:-n]


# Rotate nodes around the circle and assign colors for each edge based on
# node distance
nodes = list(G.nodes())
for i, nd in enumerate(ndist_iter):
    for u, v in zip(nodes, cycle(nodes, i + 1)):
        G[u][v]["color"] = node_dist_to_color[nd]

pos = nx.circular_layout(G)
# Create a figure with 1:1 aspect ratio to preserve the circle.
fig, ax = plt.subplots(figsize=(8, 8))
node_opts = {"node_size": 500, "node_color": "w", "edgecolors": "k", "linewidths": 2.0}
nx.draw_networkx_nodes(G, pos, **node_opts)
nx.draw_networkx_labels(G, pos, font_size=14)
# Extract color from edge data
edge_colors = [edgedata["color"] for _, _, edgedata in G.edges(data=True)]
nx.draw_networkx_edges(G, pos, width=2.0, edge_color=edge_colors)

ax.set_axis_off()
fig.tight_layout()
plt.show()
2.2 随机地理图
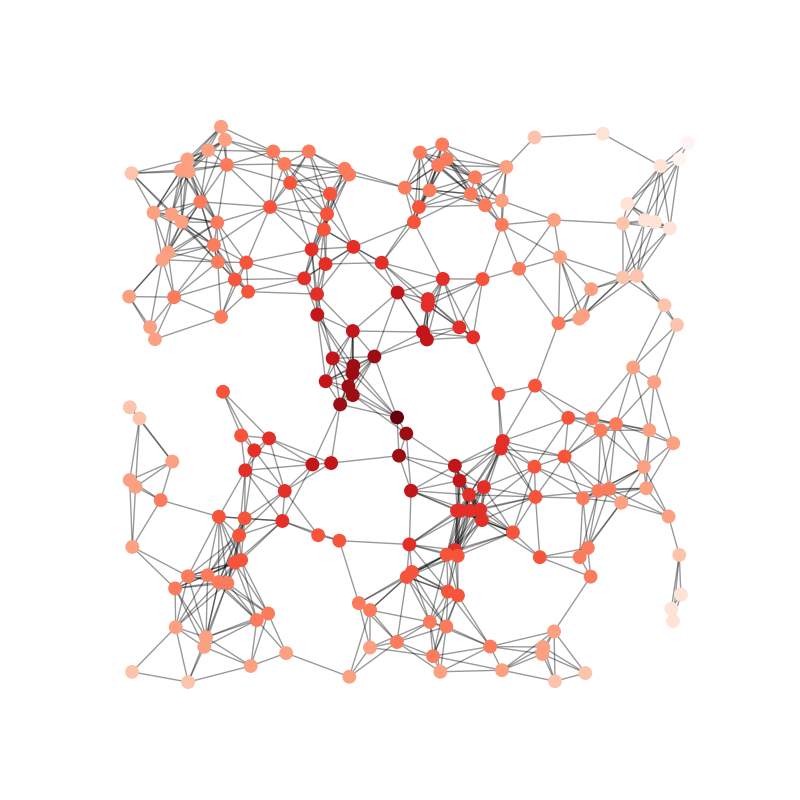
代码:
import matplotlib.pyplot as plt
import networkx as nx

# Use seed when creating the graph for reproducibility
G = nx.random_geometric_graph(200, 0.125, seed=896803)
# position is stored as node attribute data for random_geometric_graph
pos = nx.get_node_attributes(G, "pos")

# find node near center (0.5,0.5)
dmin = 1
ncenter = 0
for n in pos:
    x, y = pos[n]
    d = (x - 0.5) ** 2 + (y - 0.5) ** 2
    if d < dmin:
        ncenter = n
        dmin = d

# color by path length from node near center
p = dict(nx.single_source_shortest_path_length(G, ncenter))

plt.figure(figsize=(8, 8))
nx.draw_networkx_edges(G, pos, alpha=0.4)
nx.draw_networkx_nodes(
    G,
    pos,
    nodelist=list(p.keys()),
    node_size=80,
    node_color=list(p.values()),
    cmap=plt.cm.Reds_r,
)

plt.xlim(-0.05, 1.05)
plt.ylim(-0.05, 1.05)
plt.axis("off")
plt.show()
2.3 旅行商问题
这是旅行商问题的绘图解决方案示例
该函数用于生成解决方案 christofides,其中给定一组节点,它计算旅行者必须遵循的节点路线,以最小化总成本。
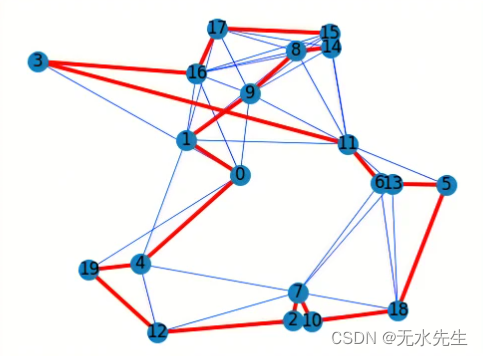
代码示例
import matplotlib.pyplot as plt
import networkx as nx
import networkx.algorithms.approximation as nx_app
import math

G = nx.random_geometric_graph(20, radius=0.4, seed=3)
pos = nx.get_node_attributes(G, "pos")

# Depot should be at (0,0)
pos[0] = (0.5, 0.5)

H = G.copy()


# Calculating the distances between the nodes as edge's weight.
for i in range(len(pos)):
    for j in range(i + 1, len(pos)):
        dist = math.hypot(pos[i][0] - pos[j][0], pos[i][1] - pos[j][1])
        dist = dist
        G.add_edge(i, j, weight=dist)

cycle = nx_app.christofides(G, weight="weight")
edge_list = list(nx.utils.pairwise(cycle))

# Draw closest edges on each node only
nx.draw_networkx_edges(H, pos, edge_color="blue", width=0.5)

# Draw the route
nx.draw_networkx(
    G,
    pos,
    with_labels=True,
    edgelist=edge_list,
    edge_color="red",
    node_size=200,
    width=3,
)

print("The route of the traveller is:", cycle)
plt.show()
2.4 权重的灵活绘制
- 图形示例:
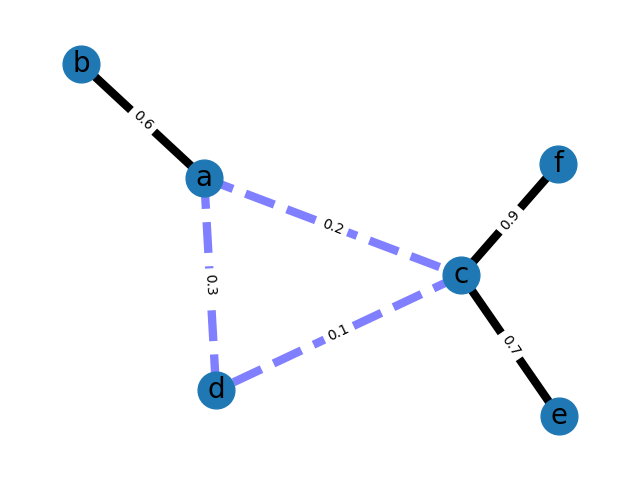
- 代码示例:
import matplotlib.pyplot as plt
import networkx as nx

G = nx.Graph()

G.add_edge("a", "b", weight=0.6)
G.add_edge("a", "c", weight=0.2)
G.add_edge("c", "d", weight=0.1)
G.add_edge("c", "e", weight=0.7)
G.add_edge("c", "f", weight=0.9)
G.add_edge("a", "d", weight=0.3)

elarge = [(u, v) for (u, v, d) in G.edges(data=True) if d["weight"] > 0.5]
esmall = [(u, v) for (u, v, d) in G.edges(data=True) if d["weight"] <= 0.5]

pos = nx.spring_layout(G, seed=7)  # positions for all nodes - seed for reproducibility

# nodes
nx.draw_networkx_nodes(G, pos, node_size=700)

# edges
nx.draw_networkx_edges(G, pos, edgelist=elarge, width=6)
nx.draw_networkx_edges(
    G, pos, edgelist=esmall, width=6, alpha=0.5, edge_color="b", style="dashed"
)

# node labels
nx.draw_networkx_labels(G, pos, font_size=20, font_family="sans-serif")
# edge weight labels
edge_labels = nx.get_edge_attributes(G, "weight")
nx.draw_networkx_edge_labels(G, pos, edge_labels)

ax = plt.gca()
ax.margins(0.08)
plt.axis("off")
plt.tight_layout()
plt.show()
2.5 barabasi_albert模型1
import networkx as nx  # 导入networkx包
import matplotlib.pyplot as plt

G = nx.random_graphs.barabasi_albert_graph(100, 2)  # 生成一个BA无标度网络G
nx.draw(G)  # 绘制网络G
plt.savefig("ba.png")  # 输出方式1: 将图像存为一个png格式的图片文件
plt.show()  # 输出方式2: 在窗口中显示这幅图像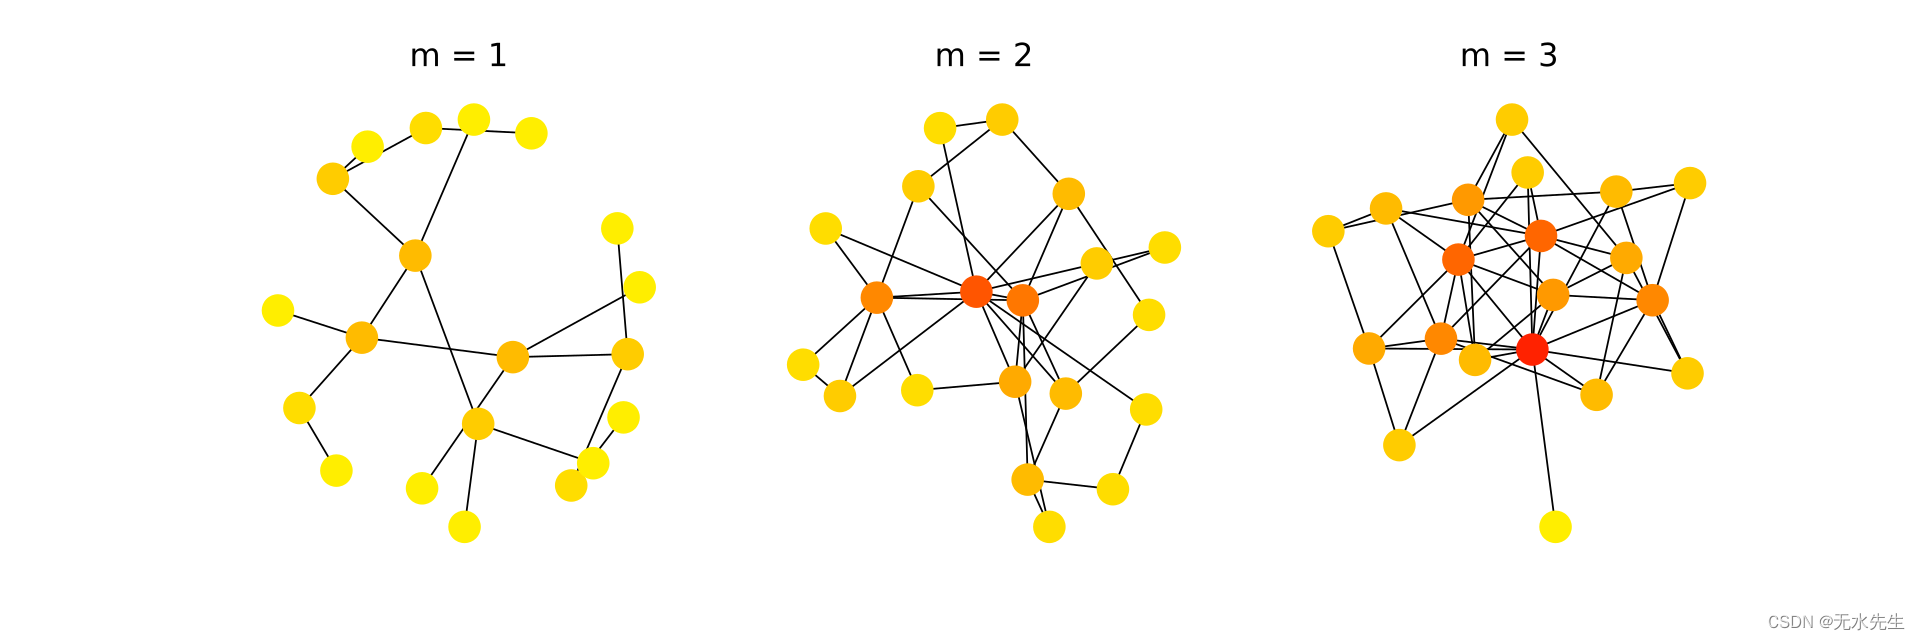
2.6 barabasi_albert模型2
import networkx as nx  # 导入networkx包
import matplotlib.pyplot as plt

G=nx.Graph()
for u, v in nx.barabasi_albert_graph(10,2,seed=1).edges():
    G.add_edge(u,v,weight=random.uniform(0,0.4))

pos=nx.spring_layout(G,iterations=20)
edgewidth=[]
for (u,v,d) in G.edges(data=True):
    nodeTmp = list( G.get_edge_data(u,v).values())
    edgewidth.append(round(nodeTmp[0]*20,2))
nx.draw_networkx_edges(G,pos,width=edgewidth)
nx.draw_networkx_nodes(G,pos)
plt.show()
图例显示
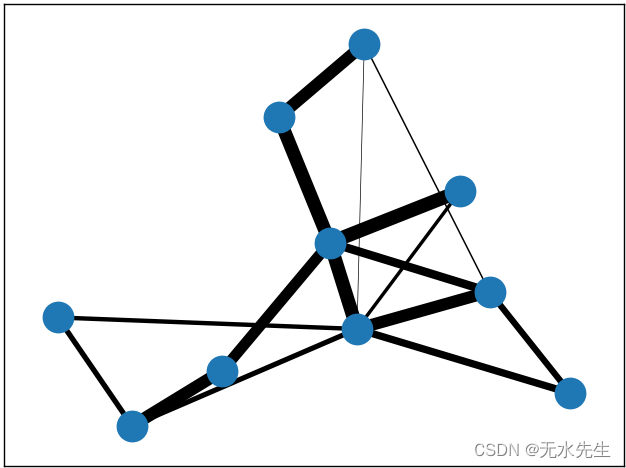
#!-*- coding:utf8-*-

import networkx as nx
import matplotlib.pyplot as plt
import random

G=nx.Graph()
for u, v in nx.barabasi_albert_graph(10,2,seed=1).edges():
    G.add_edge(u,v,weight=random.uniform(0,0.4))
pos=nx.spring_layout(G,iterations=20)

#以下语句绘制以带宽为线的宽度的图
nx.draw_networkx_edges(G,pos,width=[float(d['weight']*10) for (u,v,d) in G.edges(data=True)])
nx.draw_networkx_nodes(G,pos)
plt.show()
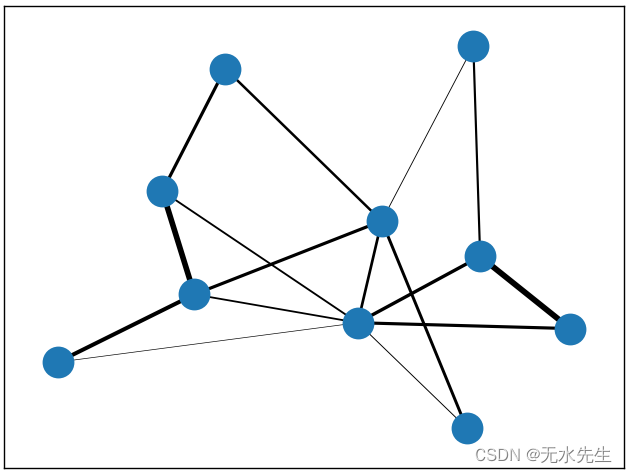
2.7 igraph操作
- 结果图:
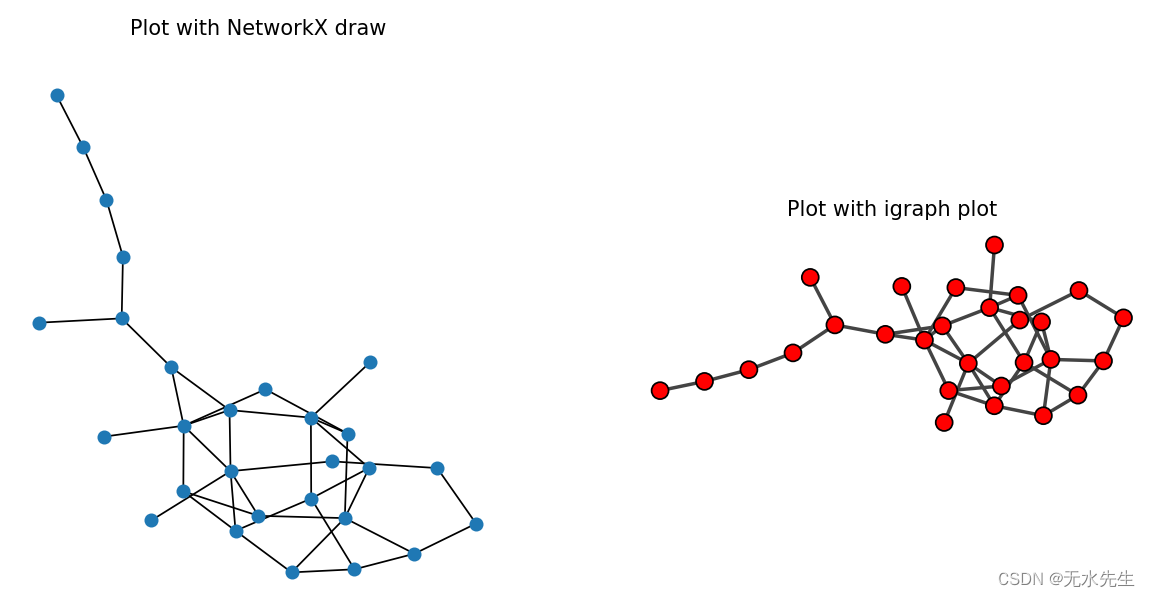
代码示例:
import matplotlib.pyplot as plt
import networkx as nx
import igraph as ig
G = nx.dense_gnm_random_graph(30, 40, seed=42)

# largest connected component
components = nx.connected_components(G)
largest_component = max(components, key=len)
H = G.subgraph(largest_component)

# convert to igraph
h = ig.Graph.from_networkx(H)


# Plot the same network with NetworkX and igraph
fig, (ax0, ax1) = plt.subplots(nrows=1, ncols=2, figsize=(12, 6))

# NetworkX draw
ax0.set_title("Plot with NetworkX draw")
nx.draw_kamada_kawai(H, node_size=50, ax=ax0)

# igraph draw
ax1.set_title("Plot with igraph plot")
layout = h.layout_kamada_kawai()
ig.plot(h, layout=layout, target=ax1)
plt.axis("off")
plt.show()
Graph | NetworkX 入门教程 - 知乎 (zhihu.com)





![[附源码]计算机毕业设计基于SSM和UNIAPP的选课APP](https://img-blog.csdnimg.cn/46e7ec135d0d432f842f0bfa4d94af5b.jpeg)


