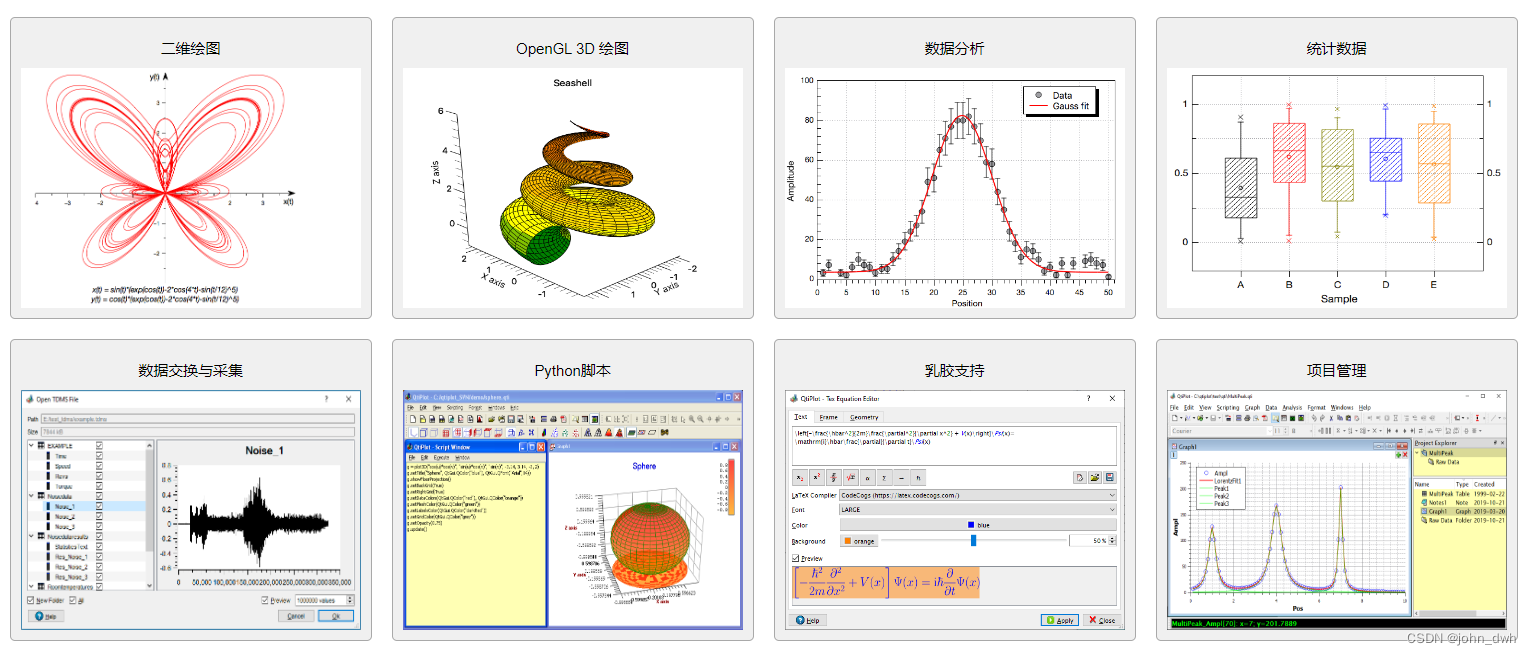
QtiPlot 是一个用于数据分析和可视化的跨平台科学应用程序。由于其多语言支持,QtiPlot 被积极用于世界各地学术机构的教学。许多研究科学家信任 QtiPlot 来分析他们的数据并发布他们的工作结果。来自各个科学领域和行业的数千名注册用户已经选择了 QtiPlot 来帮助他们进行日常工作。
QtiPlot 是一款专门为学术和科学界服务而设计的应用程序,允许用户创建信息的二维和三维图形表示。

该程序旨在成为您可以在任何情况下使用的灵活工具。对于图表,它使用您输入到表格中的数据。如果您输入的信息在任何时候发生变化,应用程序会立即更新曲线、刻度、轴和图例。
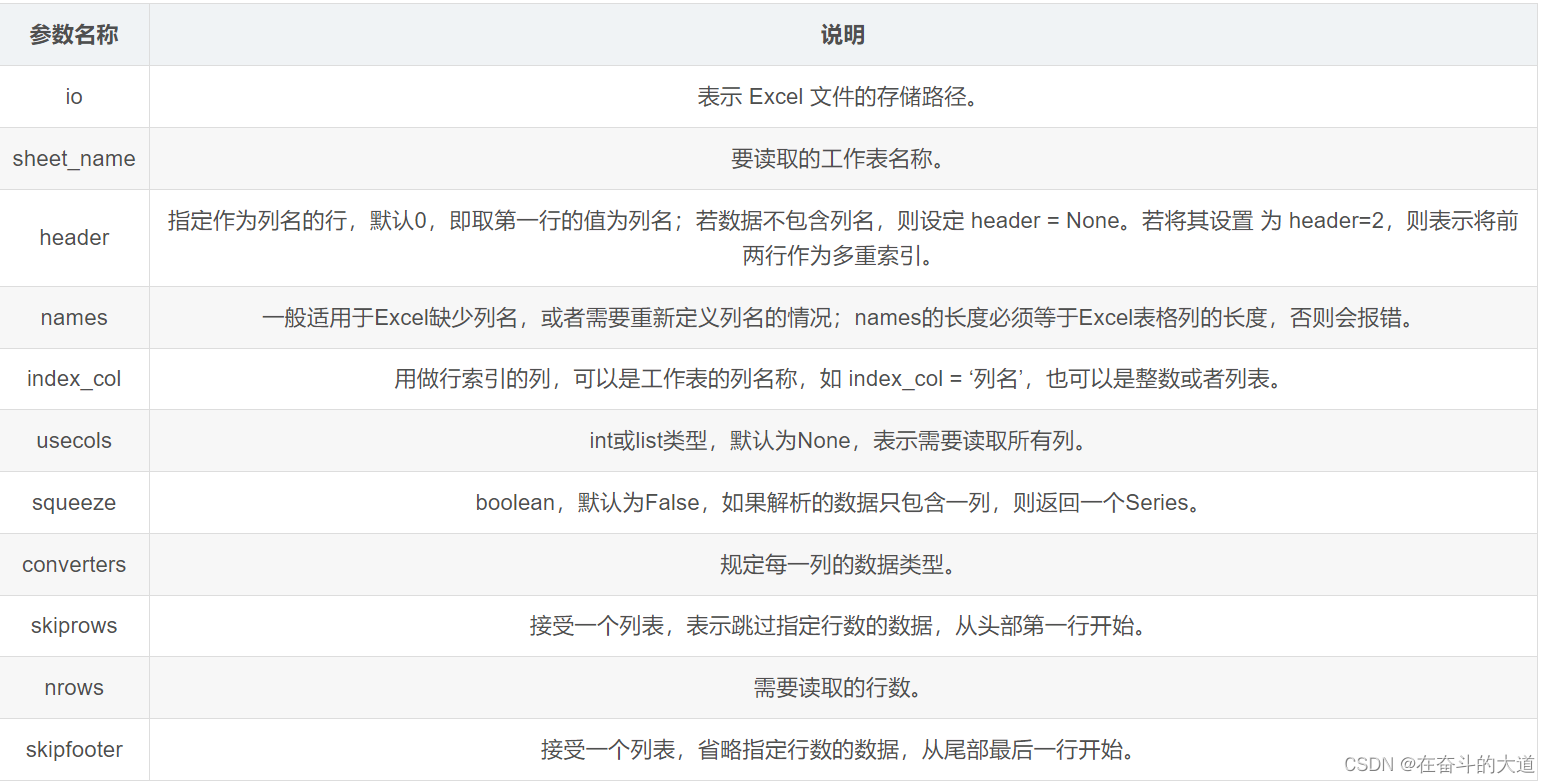
QtiPlot 可以处理大量数据,这意味着您可以包含您喜欢的列并使用从 Excel 或 ODF 电子表格下载的数据。它允许您创建集成了插值、曲线拟合和插值等功能的二维绘图。
程序界面在访问功能和工具方面非常简单;但是,如果您不习惯使用此工具,则必须花几个小时来学习如何导航以及该工具执行的功能。QtiPlot 还旨在使其软件的使用尽可能简单和舒适。它允许您四处拖动工具栏并将它们放置在主屏幕中您喜欢的任何位置。
该程序提供了制作数据的 2D 图形、函数和从数组创建的数据的 3D 表示所需的工具。它还允许您在同一个项目中创建多层图形。这一点,以及以不同格式(如 JPEG、PNG、BMP 和 PDF)导出图形的能力,使得 QtiPlot 在将图形附加到您的项目或打印图形时非常有用。
QtiPlot 还可以提供卷积、相关和插值等功能,以彻底分析数据并使用数学公式、脚本甚至数学。
有了这些信息以及更多关于 QtiPlot 的知识,您将得出结论,它是一个完整的数据分析和可视化解决方案。
QtiPlot Great Features:
- Cross-platform: works natively on Windows, Mac OS X, and Linux/Unix systems
- Fully Python scriptable
- OpenGL-based 3D plotting
- Publication quality plots and easy export to various image formats (EMF, EPS, PS, PDF, SVG, BMP, JPG, PNG, TIFF, etc ...)
- Easy integration with LaTeX typesetting system
- Powerful and versatile spreadsheets with column-logic calculations and easy import/export of multiple files
- Advanced statistical analysis: Student's t-Test, ANOVA, chi-square test for variance, normality test (Shapiro-Wilk)
- Linear and nonlinear curve fitting with weighting and estimation of statistical errors of the fit-parameters
- Multi-peak fitting with Gaussian, Lorentzian, and Psedo-Voigt peak profiles
- Image analysis tools
- Project files based on folders, a powerful project explorer with built-in drag and drop and searching facilities.
- Interoperability with OriginLab®: full import of Origin projects and export of QtiPlot projects as Origin C files
- Easy data exchange with Microsoft Excel and main free office suits (LibreOffice and Apache OpenOffice)
- Import of Matlab files, LabVIEW TDMS files, dBase, MySQL, SQLite, and Microsoft Access databases


