【机器学习知识点】系列文章主要介绍机器学习的相关技巧及知识点,欢迎点赞,关注共同学习交流。
本文主要介绍了机器学习中梯度下降的数学微分求解方法及其可视化。
目录
- 1. 二维空间的梯度下降求解及可视化
- 1.1 二维空间梯度求解
- 1.2二维空间梯度可视化
- 2. 三维空间的梯度求解及可视化
- 2.1 三维空间梯度下降求解---示例1
- 2.2 三维空间梯度可视化--示例1
- 2.3 三维空间梯度下降求解---示例2
- 2.4 三维空间梯度可视化--示例2
import numpy as np
import matplotlib as mpl
import matplotlib.pyplot as plt
import math
from mpl_toolkits.mplot3d import Axes3D
# 解决中文显示问题
mpl.rcParams['font.sans-serif'] = [u'SimHei']
mpl.rcParams['axes.unicode_minus'] = False
1. 二维空间的梯度下降求解及可视化
1.1 二维空间梯度求解
# 定义示例函数
def f1(x):
    return 0.5 * (x - 0.25) ** 2
# 导函数
def h1(x):
    return 0.5 * 2 * (x - 0.25)

# 使用梯度下降法求解
GD_X = []
GD_Y = []
x = 4
alpha = 0.5
f_change = f1(x)   # 变化量
f_current = f_change
GD_X.append(x)
GD_Y.append(f_current)
iter_num = 0
while f_change > 1e-10 and iter_num < 100:
    iter_num += 1
    x = x - alpha * h1(x)
    tmp = f1(x)
    f_change = np.abs(f_current - tmp)
    f_current  = tmp
    GD_X.append(x)
    GD_Y.append(f_current)
print(u"最终结果为:(%.5f, %.5f)" % (x, f_current))
print(u"迭代过程中X的取值,迭代次数:%d" % iter_num)
print(GD_X)
最终结果为:(0.25001, 0.00000)
迭代过程中X的取值,迭代次数:19
[4, 2.125, 1.1875, 0.71875, 0.484375, 0.3671875, 0.30859375, 0.279296875, 0.2646484375, 0.25732421875, 0.253662109375, 0.2518310546875, 0.25091552734375, 0.250457763671875, 0.2502288818359375, 0.25011444091796875, 0.2500572204589844, 0.2500286102294922, 0.2500143051147461, 0.25000715255737305]
1.2二维空间梯度可视化
# 构建数据
X = np.arange(-4, 4.5, 0.05)
Y = np.array(list(map(lambda t: f1(t), X)))

# 画图
plt.figure(facecolor='w')
plt.plot(X, Y, 'r-', linewidth=2)
plt.plot(GD_X, GD_Y, 'bo--', linewidth=2)
plt.title(u'函数$y=0.5 * (θ - 0.25)^2$; \n学习率:%.3f; 最终解:(%.3f, %.3f);迭代次数:%d' % (alpha, x, f_current, iter_num))
plt.show()

2. 三维空间的梯度求解及可视化
2.1 三维空间梯度下降求解—示例1
# 三维原始图像
def f2(x, y):
    return 0.6 * (x + y) ** 2 - x * y
# 导函数
def hx2(x, y):
    return 0.6 * 2 * (x + y) - y
def hy2(x, y):
    return 0.6 * 2 * (x + y) - x

# 使用梯度下降法求解
GD_X1 = []
GD_X2 = []
GD_Y = []
x1 = 4
x2 = 4
alpha = 0.5
f_change = f2(x1, x2)
f_current = f_change
GD_X1.append(x1)
GD_X2.append(x2)
GD_Y.append(f_current)
iter_num = 0
while f_change > 1e-10 and iter_num < 100:
    iter_num += 1
    prex1 = x1
    prex2 = x2
    x1 = x1 - alpha * hx2(prex1, prex2)
    x2 = x2 - alpha * hy2(prex1, prex2)

    tmp = f2(x1, x2)
    f_change = np.abs(f_current - tmp)
    f_current  = tmp
    GD_X1.append(x1)
    GD_X2.append(x2)
    GD_Y.append(f_current)
print(u"最终结果为:(%.5f, %.5f, %.5f)" % (x1, x2, f_current))
print(u"迭代过程中X的取值,迭代次数:%d" % iter_num)
print(GD_X1)
最终结果为:(0.00000, 0.00000, 0.00000)
迭代过程中X的取值,迭代次数:12
[4, 1.2000000000000002, 0.3600000000000001, 0.10800000000000004, 0.03240000000000001, 0.009720000000000006, 0.002916000000000002, 0.0008748000000000007, 0.0002624400000000003, 7.873200000000009e-05, 2.3619600000000034e-05, 7.0858800000000115e-06, 2.125764000000004e-06]
2.2 三维空间梯度可视化–示例1
# 构建数据
X1 = np.arange(-4, 4.5, 0.2)
X2 = np.arange(-4, 4.5, 0.2)
X1, X2 = np.meshgrid(X1, X2)
Y = np.array(list(map(lambda t: f2(t[0], t[1]), zip(X1.flatten(), X2.flatten()))))
Y.shape = X1.shape

# 画图
fig = plt.figure(facecolor='w')
ax = Axes3D(fig)
ax.plot_surface(X1, X2, Y, rstride=1, cstride=1, cmap=plt.cm.jet)
ax.plot(GD_X1, GD_X2, GD_Y, 'bo--')

ax.set_title(u'函数$y=0.6 * (θ1 + θ2)^2 - θ1 * θ2$;\n学习率:%.3f; 最终解:(%.3f, %.3f, %.3f);迭代次数:%d' % (alpha, x1, x2, f_current, iter_num))
plt.show()

2.3 三维空间梯度下降求解—示例2
# 三维原始图像
def f2(x, y):
    return 0.15 * (x + 0.5) ** 2 + 0.25 * (y  - 0.25) ** 2 + 0.35 * (1.5 * x - 0.2 * y + 0.35 ) ** 2
## 偏函数
def hx2(x, y):
    return 0.15 * 2 * (x + 0.5) + 0.25 * 2 * (1.5 * x - 0.2 * y + 0.35 ) * 1.5
def hy2(x, y):
    return 0.25 * 2 * (y  - 0.25) - 0.25 * 2 * (1.5 * x - 0.2 * y + 0.35 ) * 0.2

# 使用梯度下降法求解
GD_X1 = []
GD_X2 = []
GD_Y = []
x1 = 4
x2 = 4
alpha = 0.5
f_change = f2(x1, x2)
f_current = f_change
GD_X1.append(x1)
GD_X2.append(x2)
GD_Y.append(f_current)
iter_num = 0
while f_change > 1e-10 and iter_num < 100:
    iter_num += 1
    prex1 = x1
    prex2 = x2
    x1 = x1 - alpha * hx2(prex1, prex2)
    x2 = x2 - alpha * hy2(prex1, prex2)

    tmp = f2(x1, x2)
    f_change = np.abs(f_current - tmp)
    f_current  = tmp
    GD_X1.append(x1)
    GD_X2.append(x2)
    GD_Y.append(f_current)
print(u"最终结果为:(%.5f, %.5f, %.5f)" % (x1, x2, f_current))
print(u"迭代过程中X的取值,迭代次数:%d" % iter_num)
print(GD_X1)
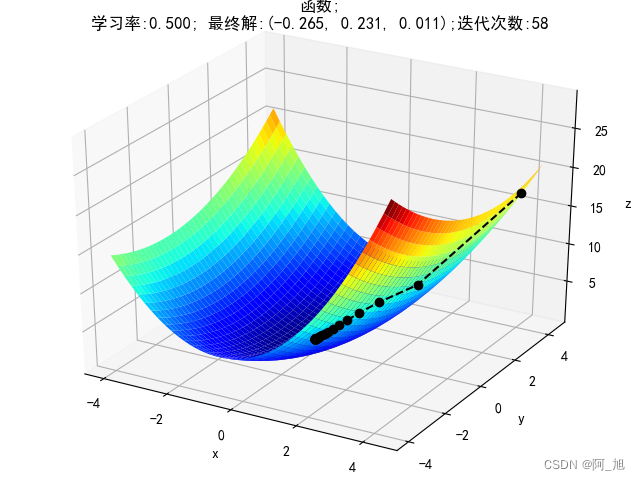
最终结果为:(-0.26514, 0.23121, 0.01145)
迭代过程中X的取值,迭代次数:58
[4, 1.2437500000000004, 0.4018281250000001, 0.10764167968750005, -0.020251824511718725, -0.09072903259106443, -0.13665442183532897, -0.1692451675603763, -0.19321986254564413, -0.2111035034347064, -0.22451318574939427, -0.23458748520858907, -0.24216134745348197, -0.2478568516346237, -0.2521402459632734, -0.25536175233244196, -0.25778465207644113, -0.2596069270566862, -0.2609774714894122, -0.2620082671887549, -0.26278353575420116, -0.26336662064597083, -0.2638051628706461, -0.2641349935482922, -0.26438306151128765, -0.26456963516415805, -0.26470995851564694, -0.264815496691451, -0.2648948726929125, -0.2649545719397508, -0.26499947216157443, -0.2650332419329969, -0.2650586404146882, -0.2650777427907201, -0.2650921098215726, -0.26510291536613795, -0.2651110422919135, -0.26511715460972984, -0.2651217517267848, -0.2651252092507311, -0.26512780967871585, -0.2651297654788229, -0.2651312364497865, -0.2651323427773544, -0.2651331748540696, -0.265133800664797, -0.26513427134142975, -0.265134625340623, -0.2651348915858965, -0.26513509183083206, -0.26513524243645115, -0.26513535570799246, -0.2651354409003123, -0.26513550497405297, -0.2651355531643622, -0.26513558940863147, -0.2651356166682003, -0.265135637170313, -0.26513565259009564]
2.4 三维空间梯度可视化–示例2
# 构建数据
X1 = np.arange(-4, 4.5, 0.2)
X2 = np.arange(-4, 4.5, 0.2)
X1, X2 = np.meshgrid(X1, X2)
Y = np.array(list(map(lambda t: f2(t[0], t[1]), zip(X1.flatten(), X2.flatten()))))
Y.shape = X1.shape


# 画图
fig = plt.figure(facecolor='w')
ax = Axes3D(fig)
ax.plot_surface(X1, X2, Y, rstride=1, cstride=1, cmap=plt.cm.jet)
ax.plot(GD_X1, GD_X2, GD_Y, 'ko--')
ax.set_xlabel('x')
ax.set_ylabel('y')
ax.set_zlabel('z')

ax.set_title(u'函数;\n学习率:%.3f; 最终解:(%.3f, %.3f, %.3f);迭代次数:%d' % (alpha, x1, x2, f_current, iter_num))
plt.show()
如果内容对你有帮助,感谢点赞+关注哦!
更多干货内容持续更新中…


