文章目录
- CPU信息展示
- 图表展示-视图函数设计
- 图表展示-前端界面设计
- 折线图和饼图展示
- 饼图
- 测试
- 折线图
- celery和Django配合实现定时任务
- Windows安装redis
- 根据数据库中的数据绘制CPU折线图
CPU信息展示
图表展示-视图函数设计
host/views.py
def cpu(request):
    logical_core_num = psutil.cpu_count()
    physical_core_num = psutil.cpu_count(logical=False)
    try:
        load_avg = os.getloadavg()
    except Exception as e:
        load_avg = ['', '', '']
    cpu_time_percent = psutil.cpu_times_percent()
    else_percent = 0.0  #空闲CPU占有率
    for i in range(3, 5):
        else_percent += cpu_time_percent[i]
    try:
        cpu_freq = psutil.cpu_freq()
    except AttributeError:
        cpu_freq = None
    return render(request, 'host/cpu.html', locals())
Windows中怎么获取平均负载?没找到资料。。。。。。。
自定义过滤器:
在 host/templatetags/timefilter.py 文件附加过滤器:
@register.filter(name='cpu_val_fmt')
def cpu_val_fmt(value):
    return round(value/1000,2)
图表展示-前端界面设计
templates/host/cpu.html 文件:
{% extends 'host/base.html' %}
{% load timefilter %}
{% block title %} cpu信息 {% endblock %}
{% block content %}
     <div class="page-header">
        <a {% if not chart %}id="display"{% endif %} href="/cpu/">CPU 信息</a>
    </div>
    <div id="cpu_info">
        <table class="table table-bordered">
            <tr>
                <td>物理 CPU 核心数</td>
                <td>{{ physical_core_num }}</td>
            </tr>
            <tr>
                <td>逻辑 CPU 核心数</td>
                <td>{{ logical_core_num }}</td>
            </tr>
            <tr>
                <td>最近 1 分钟平均负载</td>
                <td>{{ load_avg.0 }}</td>
            </tr>
            <tr>
                <td>最近 5 分钟平均负载</td>
                <td>{{ load_avg.1 }}</td>
            </tr>
            <tr>
                <td>最近 15 分钟平均负载</td>
                <td>{{ load_avg.2 }}</td>
            </tr>
            <tr>
                <td>用户</td>
                <td>{{ cpu_time_percent.user }} %</td>
            </tr>
            <tr>
                <td>系统</td>
                <td>{{ cpu_time_percent.system }} %</td>
            </tr>
            <tr>
                <td>空闲</td>
                <td>{{ cpu_time_percent.idle }} %</td>
            </tr>
            {% if cpu_time_percent.nice %}
                <tr>
                    <td>nice</td>
                    <td>{{ cpu_time_percent.nice }} %</td>
                </tr>
            {% endif %}
            {% if cpu_time_percent.iowait %}
                <tr>
                    <td>iowait</td>
                    <td>{{ cpu_time_percent.iowait }} %</td>
                </tr>
            {% endif %}
            {% if else_percent %}
                <tr>
                    <td>其他</td>
                    <td>{{ else_percent }} %</td>
                </tr>
            {% endif %}
            {% if cpu_freq %}
                <tr>
                    <td>正在运行频率</td>
                    <td>{{ cpu_freq.current | cpu_val_fmt}} GHz</td>
                </tr>
                <tr>
                    <td>最低运行频率</td>
                    <td>{{ cpu_freq.min | cpu_val_fmt }} GHz</td>
                </tr>
                <tr>
                    <td>最高运行频率</td>
                    <td>{{ cpu_freq.max | cpu_val_fmt }} GHz</td>
                </tr>
            {% endif %}
        </table>
    </div>
{% endblock %}
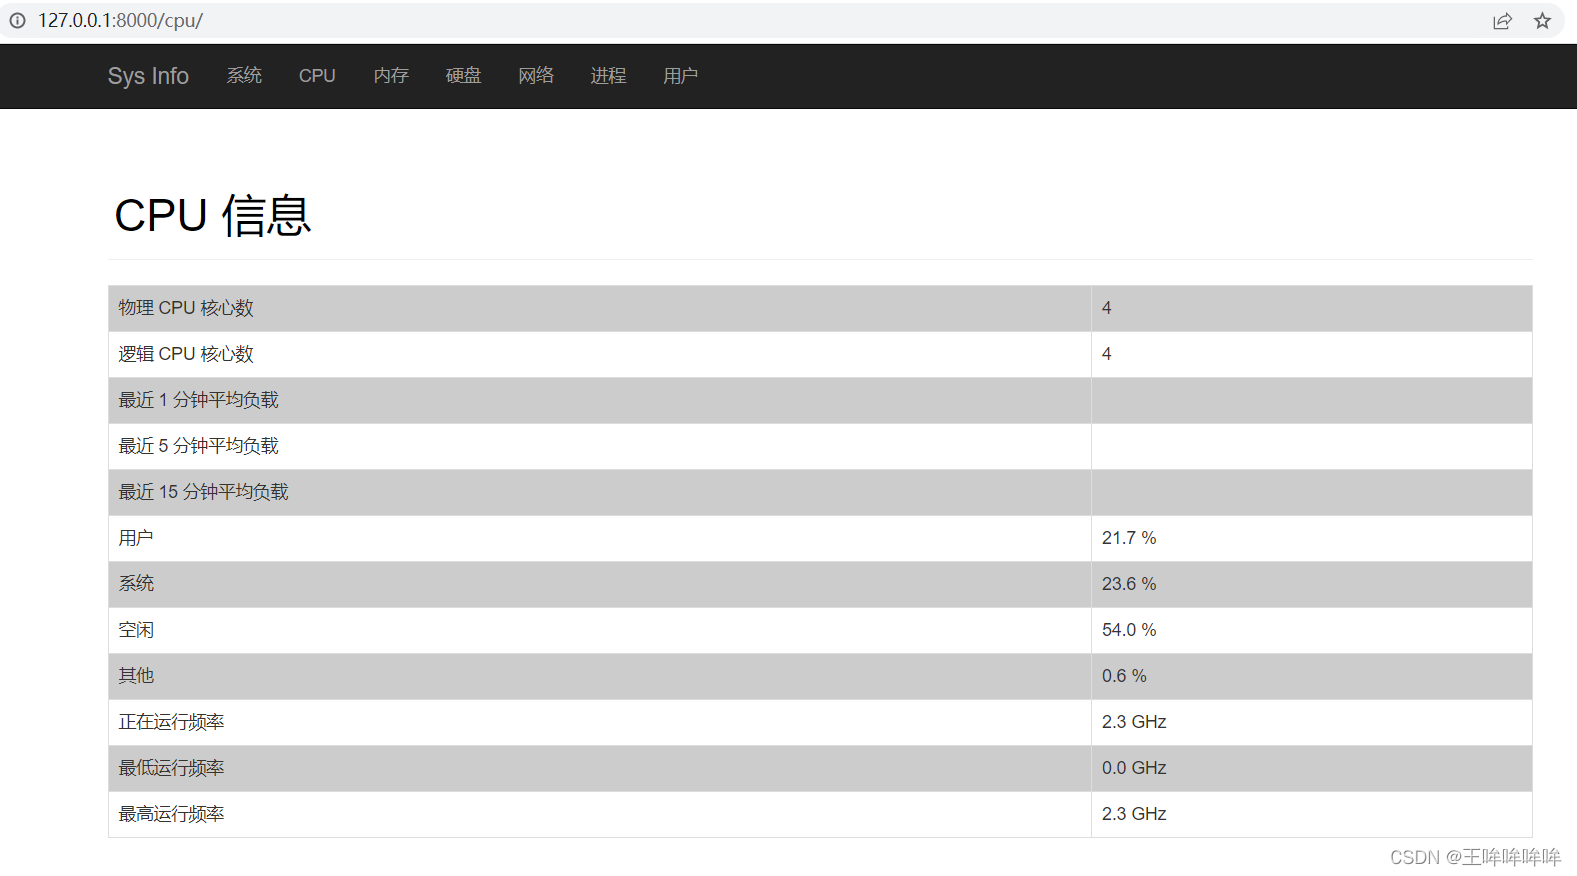
测试:
折线图和饼图展示
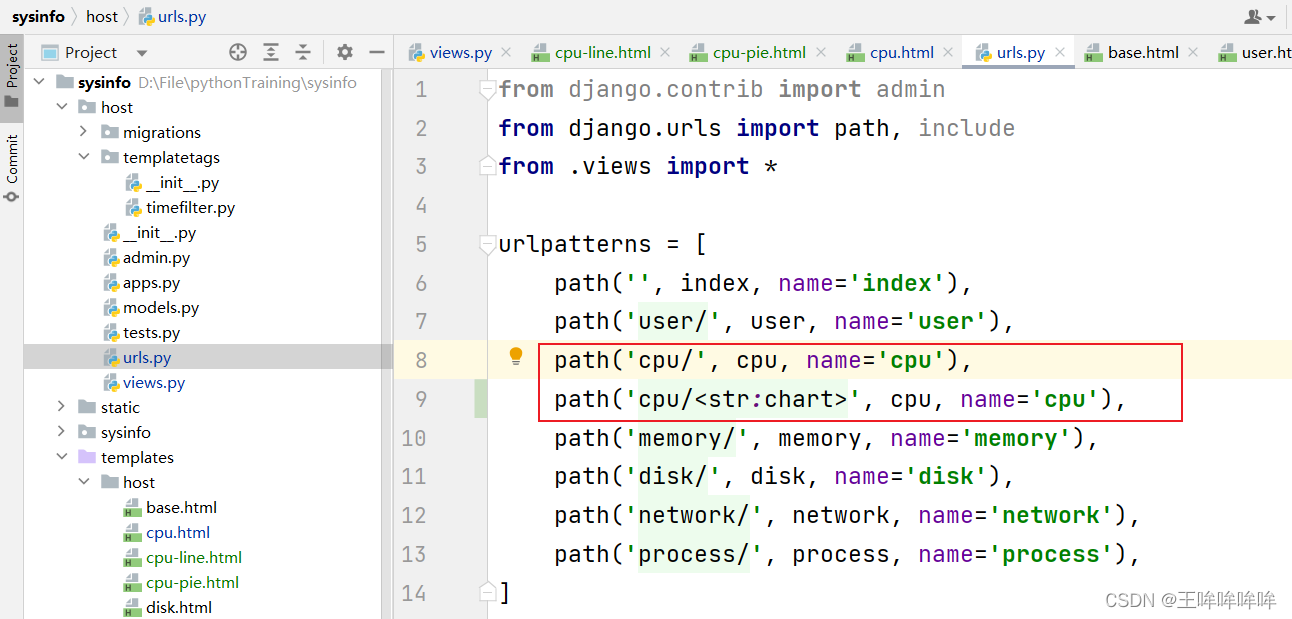
host/urls.py 文件更改路由:
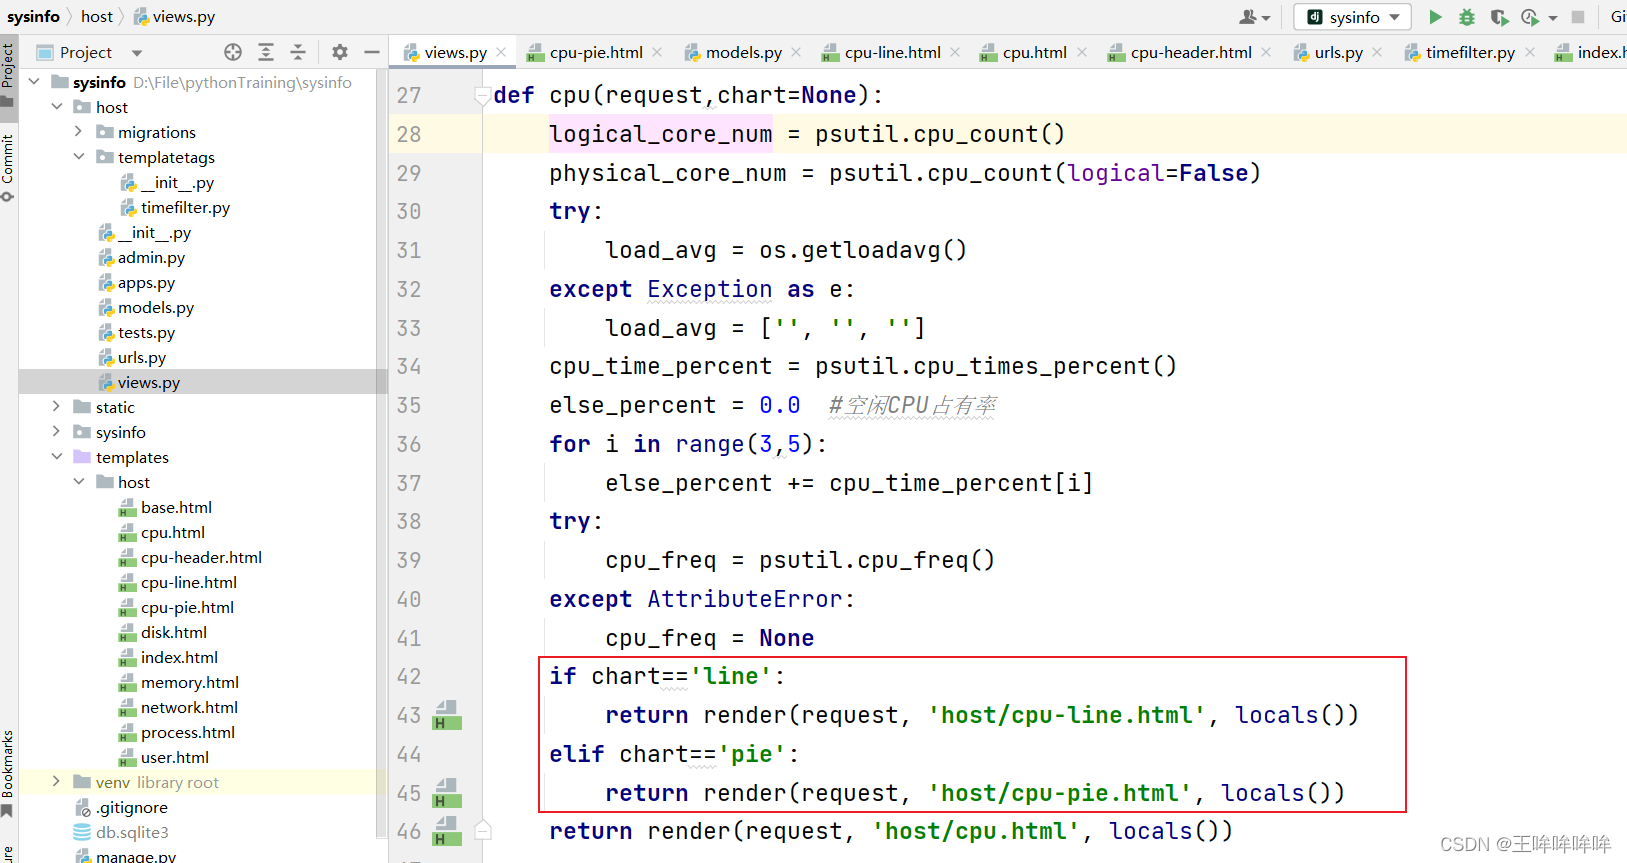
相应的,在视图函数 host/views.py 中也需要设置根据不同的路径,访问不同的HTML页面
选择使用 echarts 绘制折线图和饼图
参考echart官网,快速上手: https://echarts.apache.org/handbook/zh/get-started/
使用在线echart: https://cdn.baomitu.com/echarts
在 templates/host/base.html 中添加在线echart

新建 templates/host/cpu-header.html 文件:用于设置CPU饼图和折线图页面共同的部分。
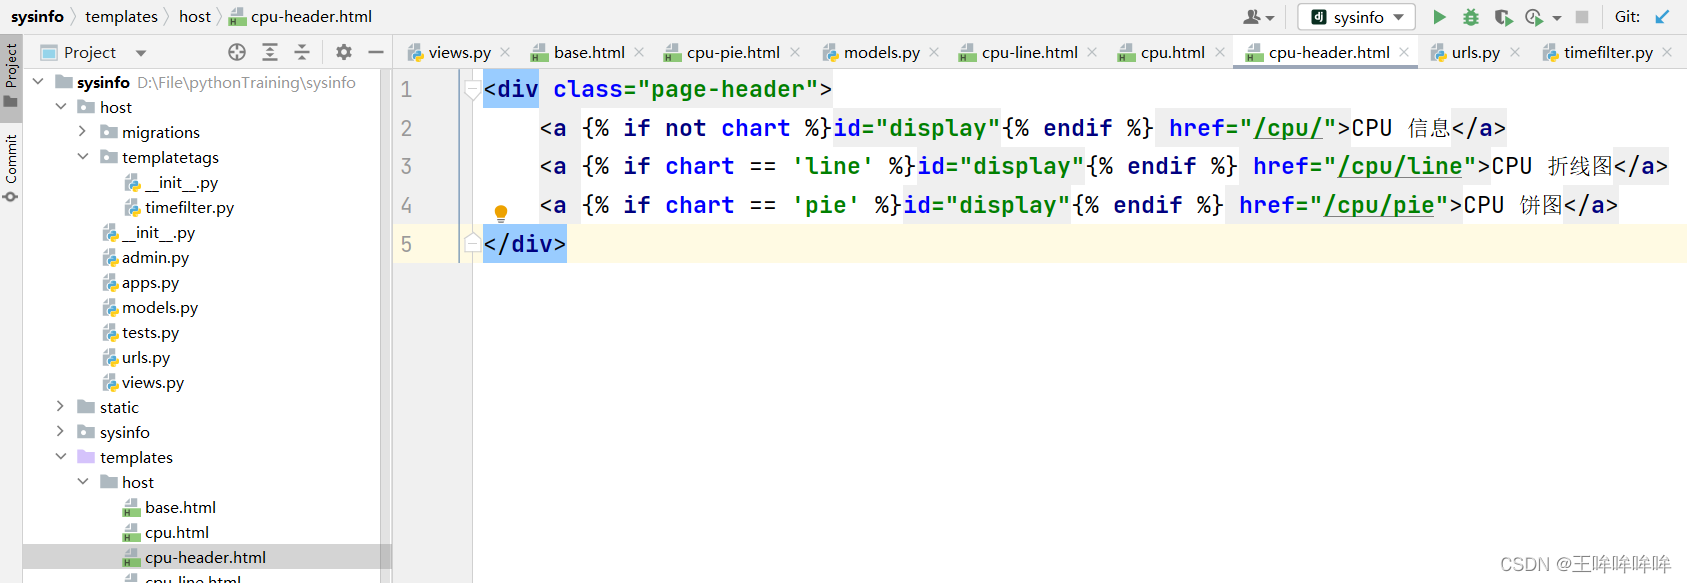
在下面的CPU饼图和折线图页面中 {% include ‘host/cpu-header.html’ %} 即可。
饼图
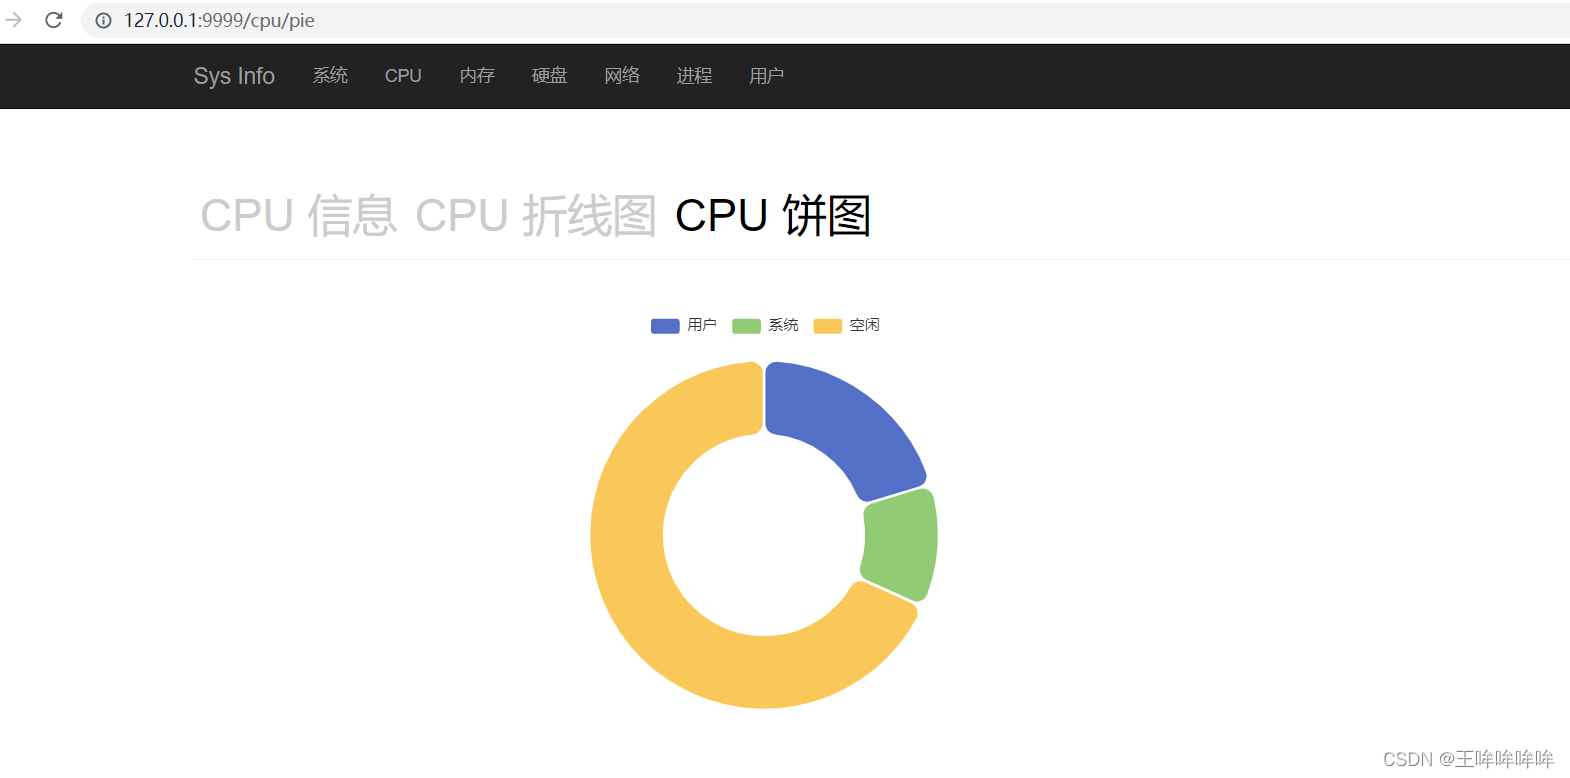
选择合适的饼图,使用其代码,再修改为自己的数据:https://echarts.apache.org/examples/zh/editor.html?c=pie-borderRadius
饼图中的数据是一次性,无需使用数据库存储其数据。当访问的适合返回对应的信息即可。
{% extends 'host/base.html' %}
{% load timefilter %}
{% block title %} cpu信息 {% endblock %}
{% block content %}
    {% include 'host/cpu-header.html' %}
    <div>
        <div id="main" style="width: 80%;height:400px;"></div>
    </div>
    <script type="text/javascript">
        // 基于准备好的dom,初始化echarts实例
        var myChart = echarts.init(document.getElementById('main'));
        // 指定图表的配置项和数据
        option = {
            tooltip: {
                trigger: 'item'
            },
            legend: {
                top: '5%',
                left: 'center'
            },
            series: [
                {
                    name: 'CPU占用百分比分类',
                    type: 'pie',
                    radius: ['40%', '70%'],
                    avoidLabelOverlap: false,
                    itemStyle: {
                        borderRadius: 10,
                        borderColor: '#fff',
                        borderWidth: 2
                    },
                    label: {
                        show: false,
                        position: 'center'
                    },
                    emphasis: {
                        label: {
                            show: true,
                            fontSize: 40,
                            fontWeight: 'bold'
                        }
                    },
                    labelLine: {
                        show: false
                    },
                    data: [
                        {value: {{cpu_time_percent.user}}, name: '用户'},
                        {value: {{cpu_time_percent.system}}, name: '系统'},
                        {value: {{cpu_time_percent.idle}}, name: '空闲'},
                    ]
                }
            ]
        };
        // 使用刚指定的配置项和数据显示图表。
        myChart.setOption(option);
    </script>
{% endblock %}
测试
折线图
有些数据是需要存储到数据库中。比如负载信息、CPU占有率等。进而根据数据库中的数据来绘制折线图。
下面选择使用用户CPU占有率这个属性来绘制折线图。
创建数据模型:
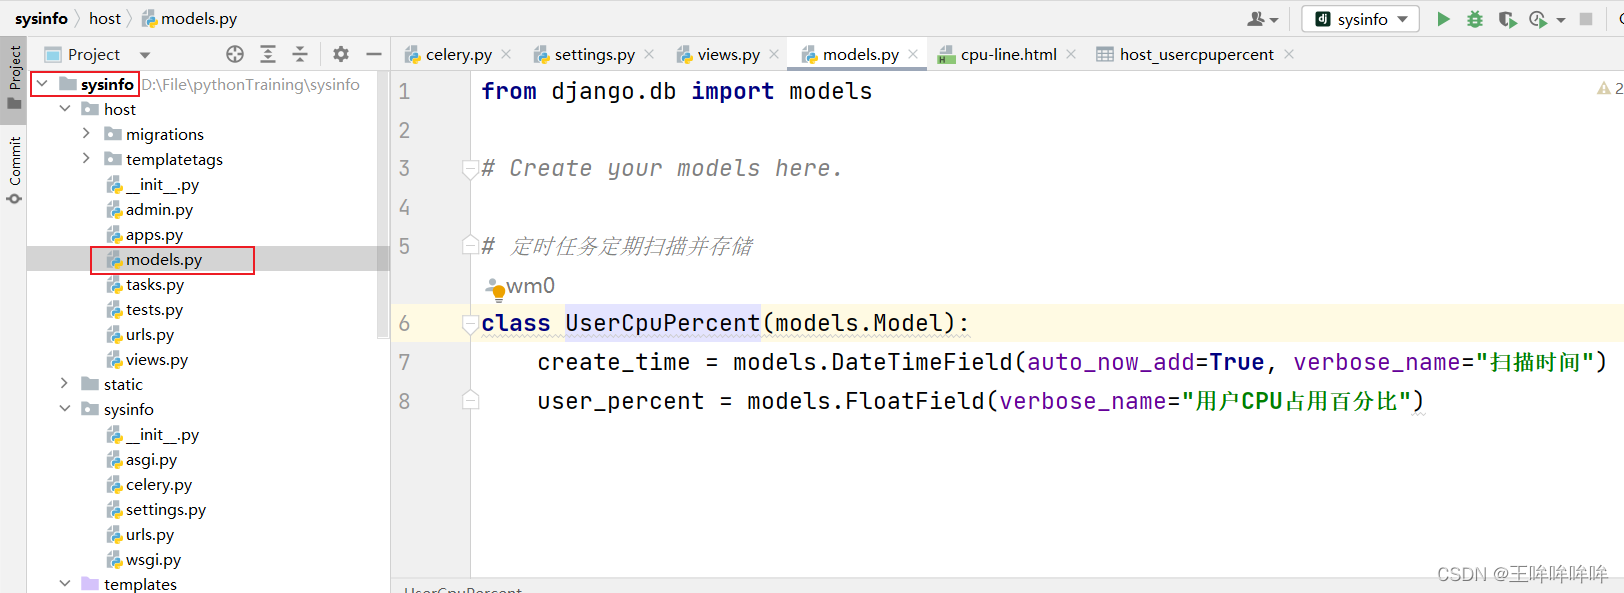
生成迁移文件,并写入数据库:

已经添加了数据库,但是此时数据库中还没有数据。
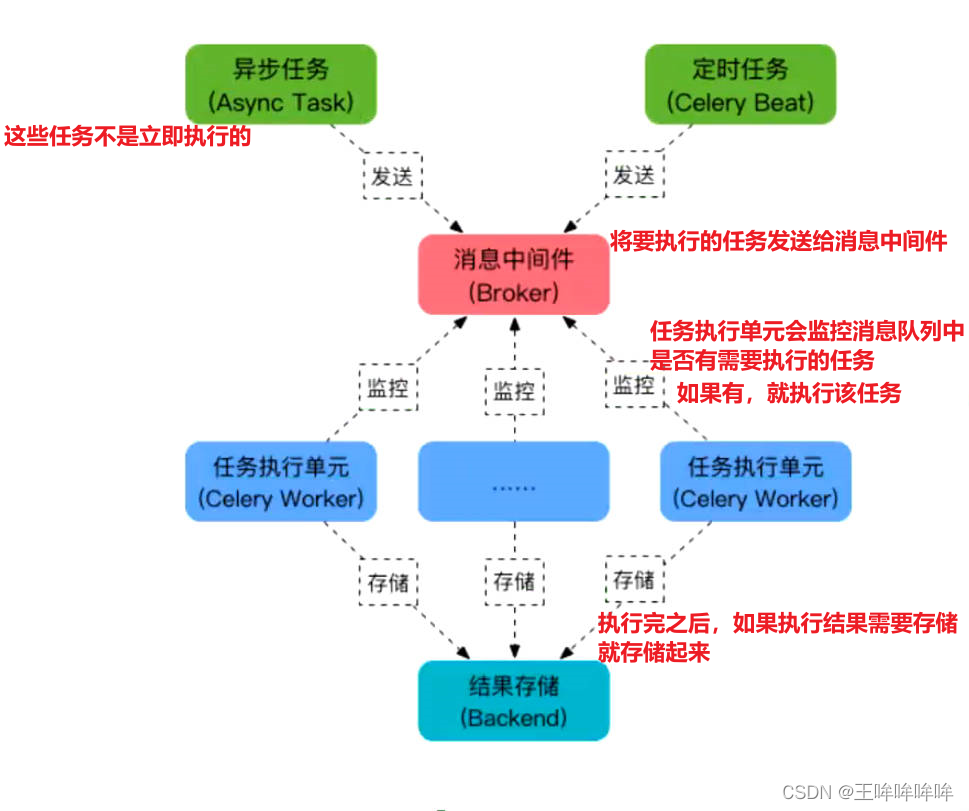
下面使用 celery 定时任务,定期扫描并存储。celery工作原理:
celery和Django配合实现定时任务
参考文章:https://www.cnblogs.com/yance-dev/p/10110754.html
- 1、安装所需模块:
pip install celery
pip install django-celery-beat
pip install django-celery-results
pip install redis
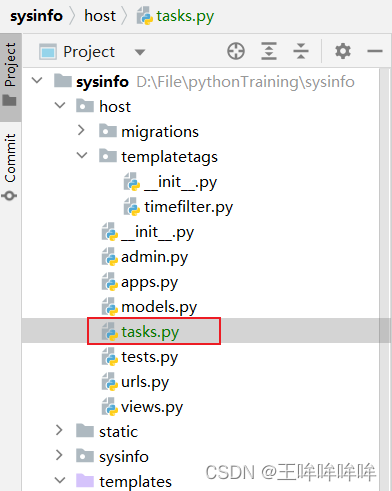
- 2、新建 host/tasks.py 文件,书写定时任务
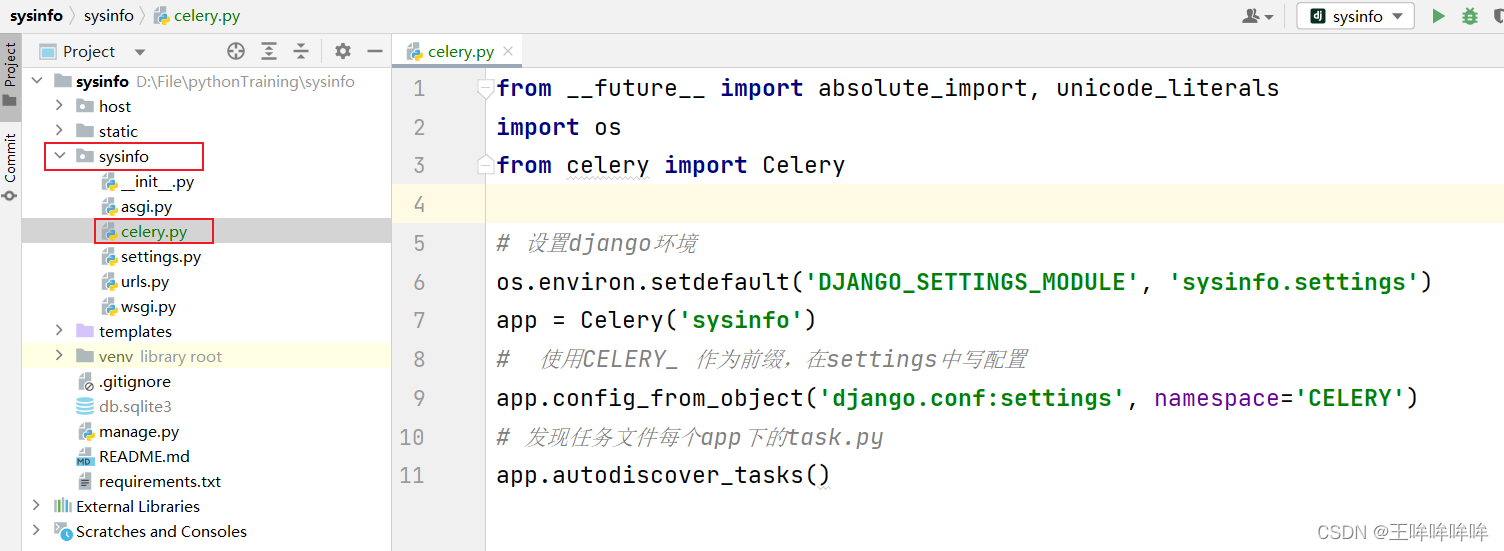
- 3、新建 sysinfo/celery.py 文件:
- 4、在sysinfo/ _ _ init _ _.py写:

- 5、在 sysinfo/settings.py 写入:

Windows安装redis
还需要在Windows中安装redis:
参考文章:https://redis.com.cn/redis-installation.html
安装过程中,注意要将redis添加到环境变量中.
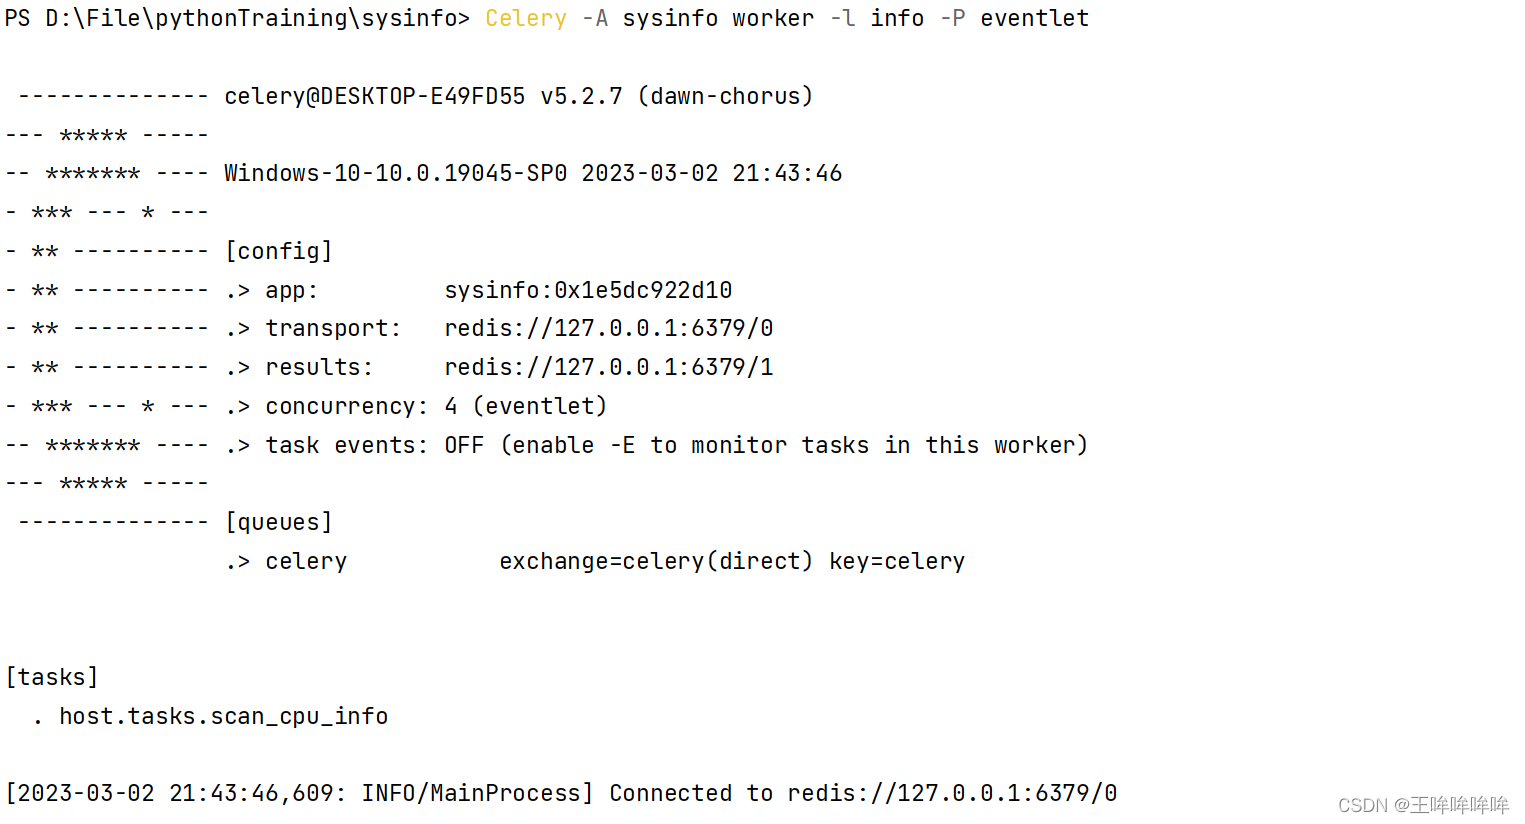
- 6、启动redis,测试celery是否配置成功:
pip install eventlet
Celery -A sysinfo worker -l info -P eventlet

此时已经连接到 redis 数据库。
- 7、 定义定时任务: tasks.py 文件

- 8、使用定时任务:
8.1 beat插件安装
pip install django-celery-beat
8.2 注册APP
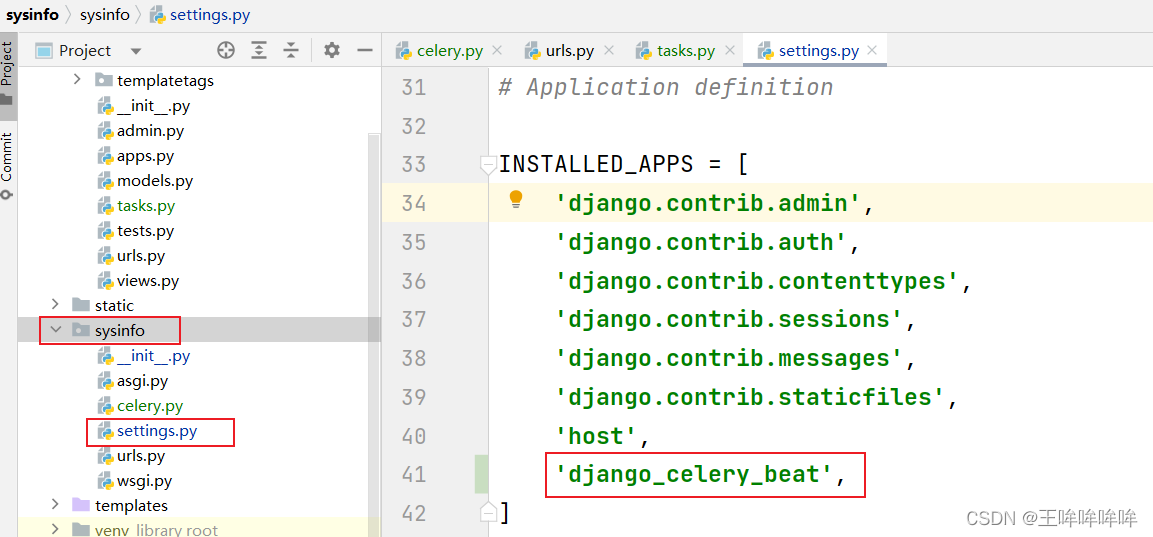
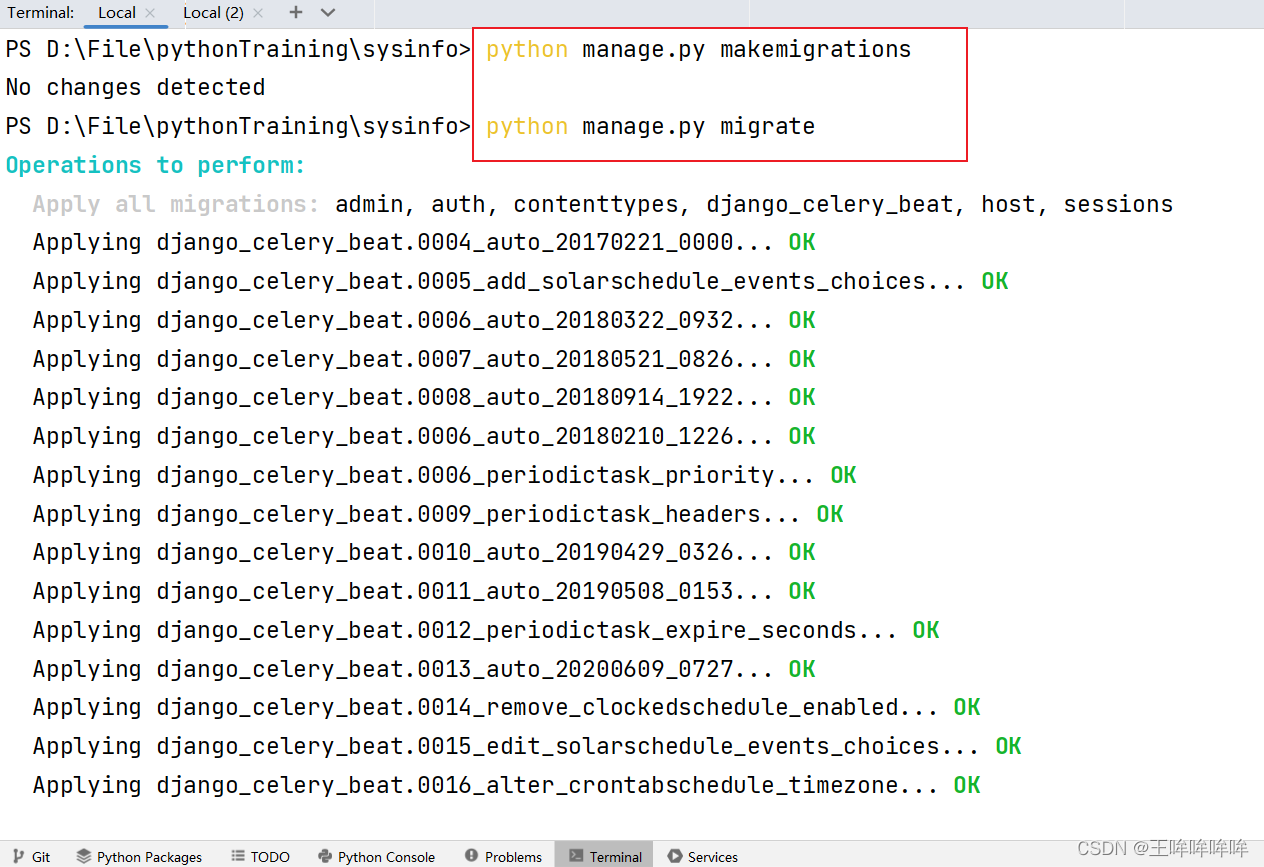
8.3 数据库变更:
生成了django_celery_beat的一些信息
添加定时任务,选择任务类型
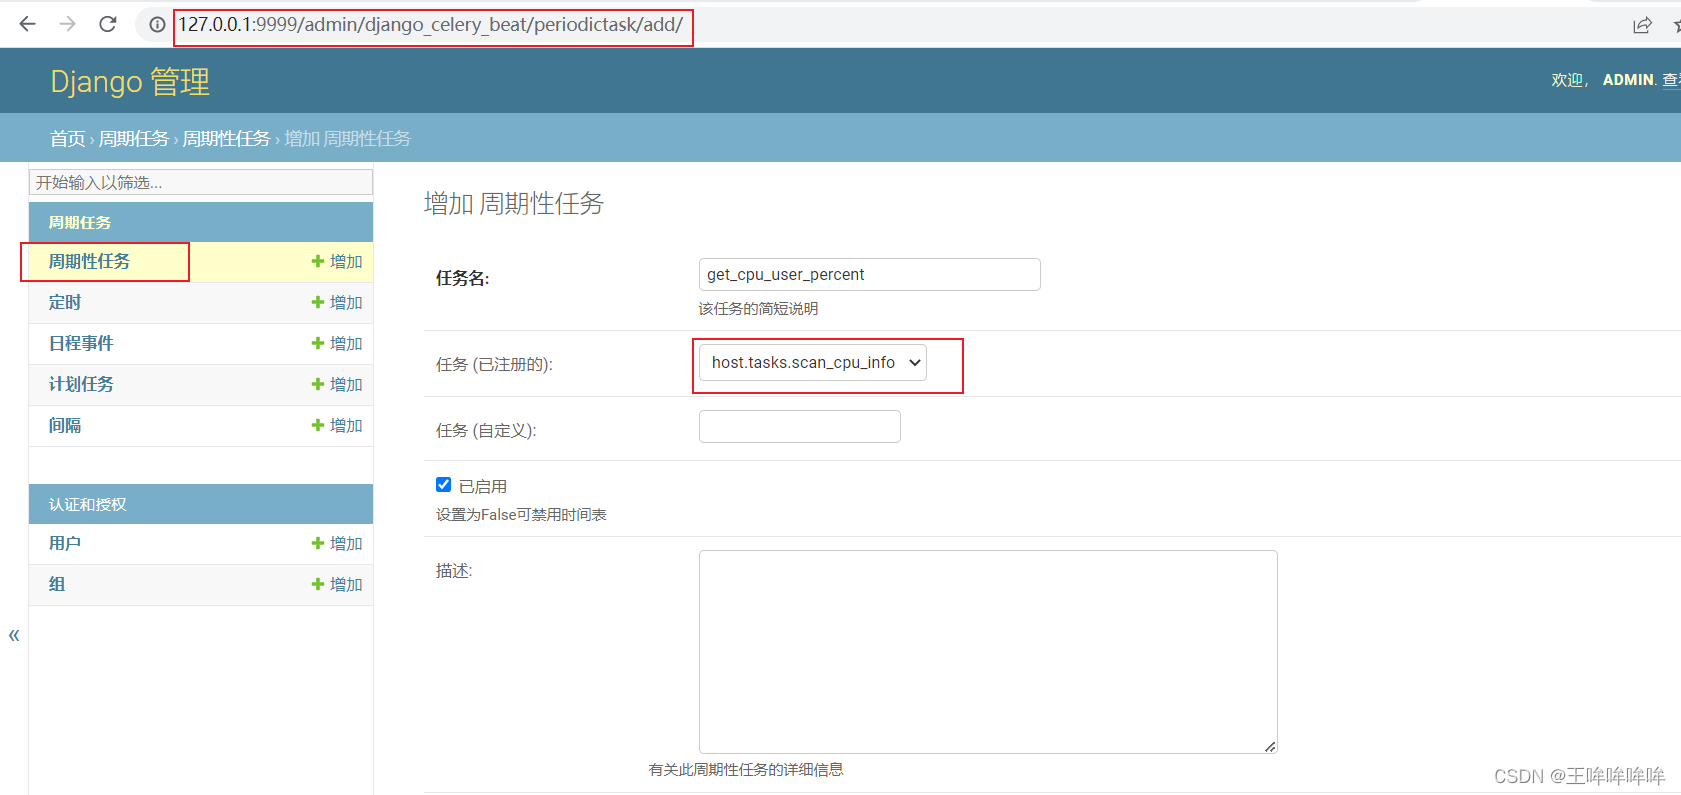
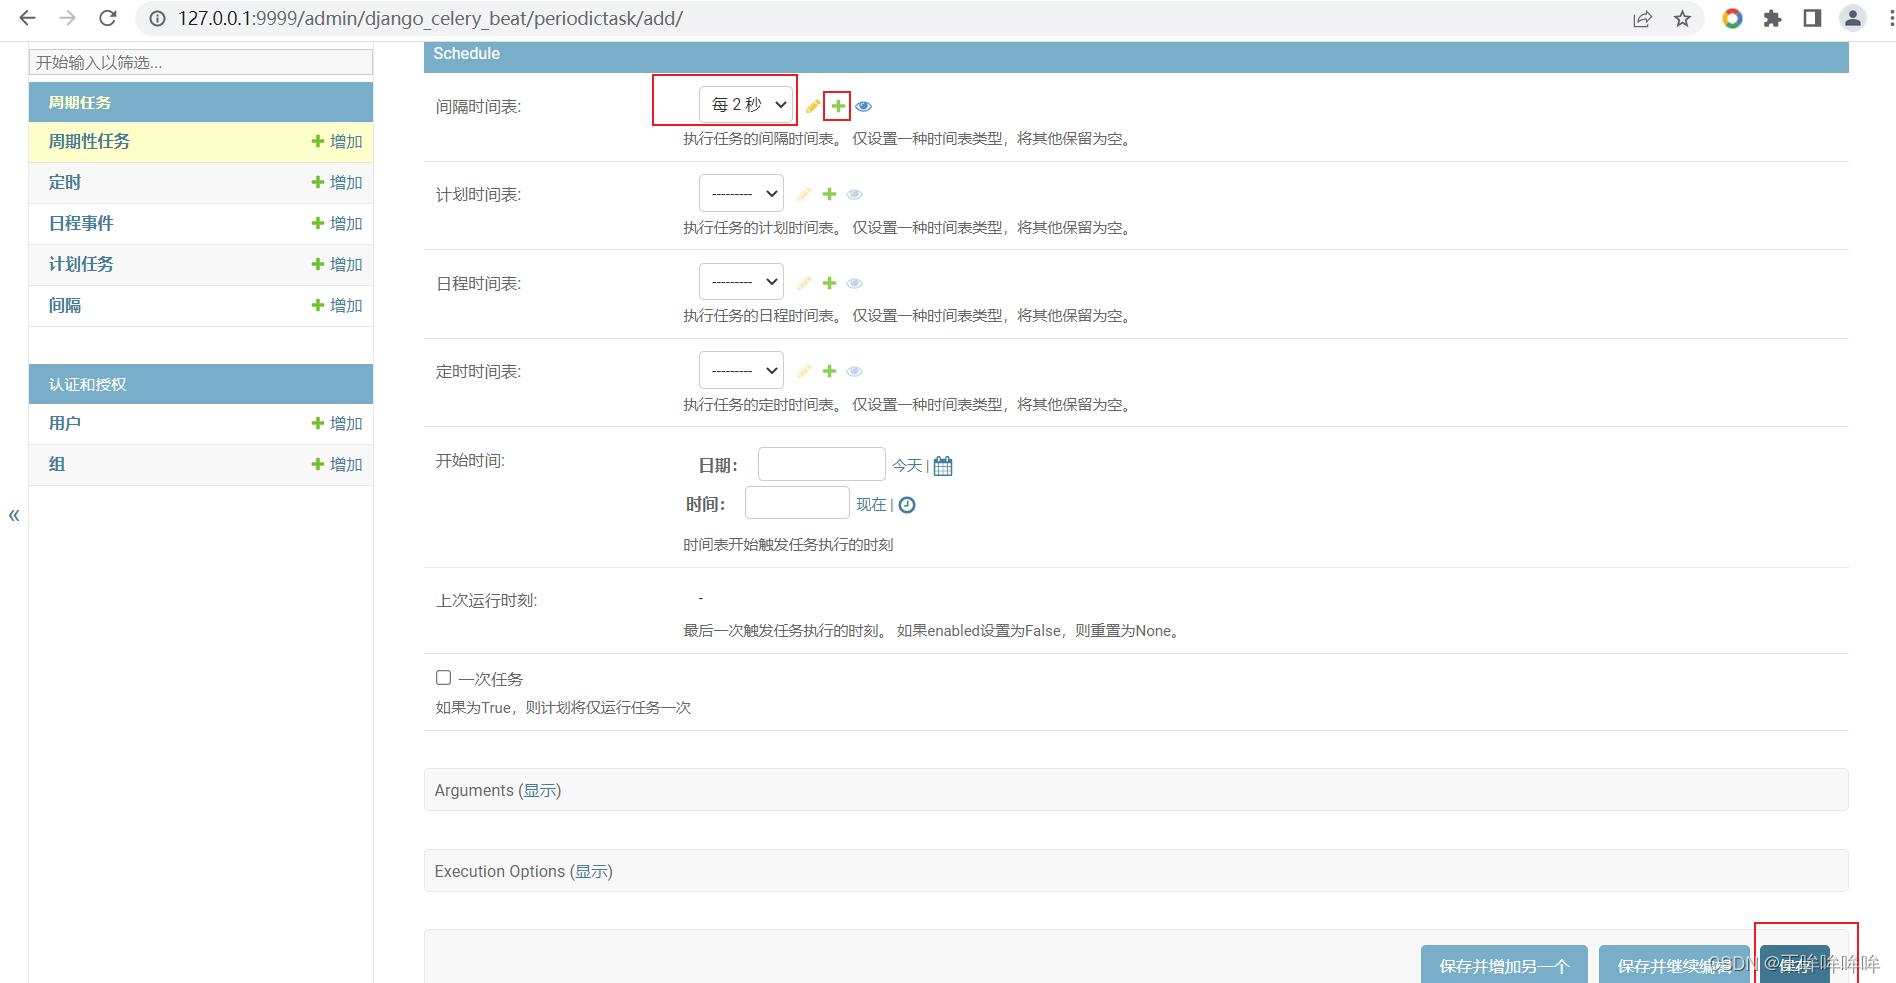
设定任务的间隔时间为2秒,并保存
8.4、 启动 worker 和 beat :
#启动beta 调度器使用数据库
celery -A sysinfo beat -l info --scheduler django_celery_beat.schedulers:DatabaseScheduler

Celery -A sysinfo worker -l info -P eventlet
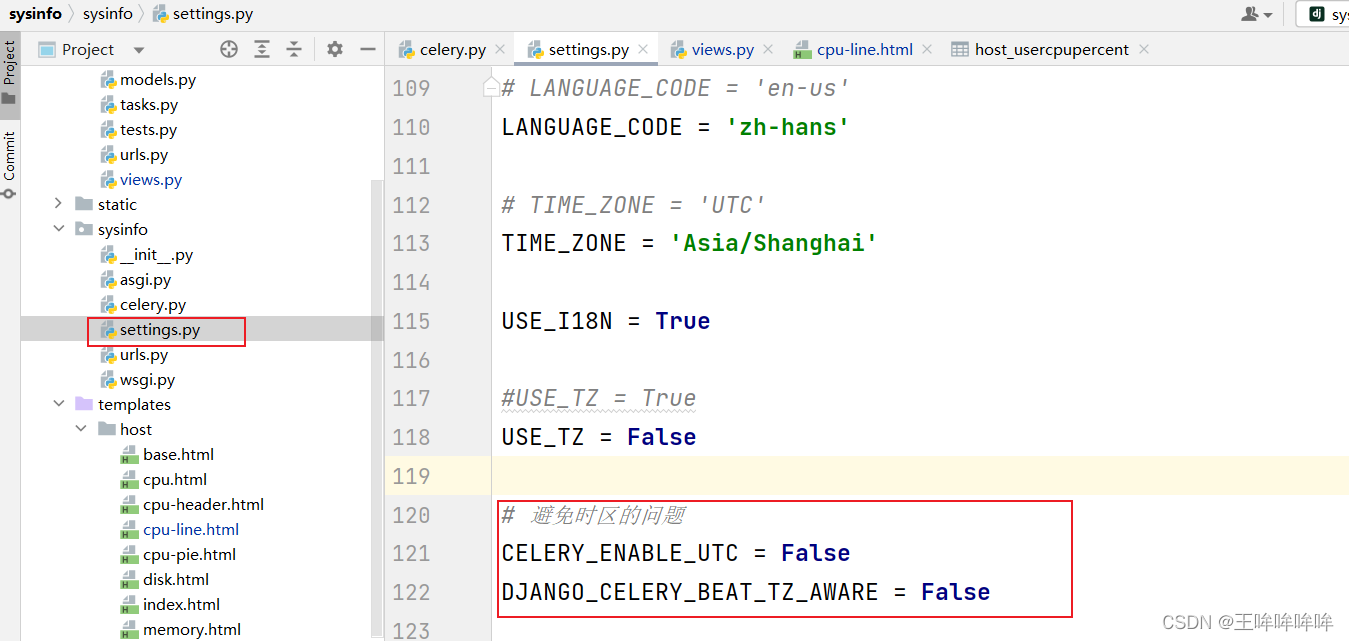
出现了错误

根据文章:https://blog.csdn.net/Jason_WangYing/article/details/122147921
修改 settings.py:
再次启动worker
再次启动beat:

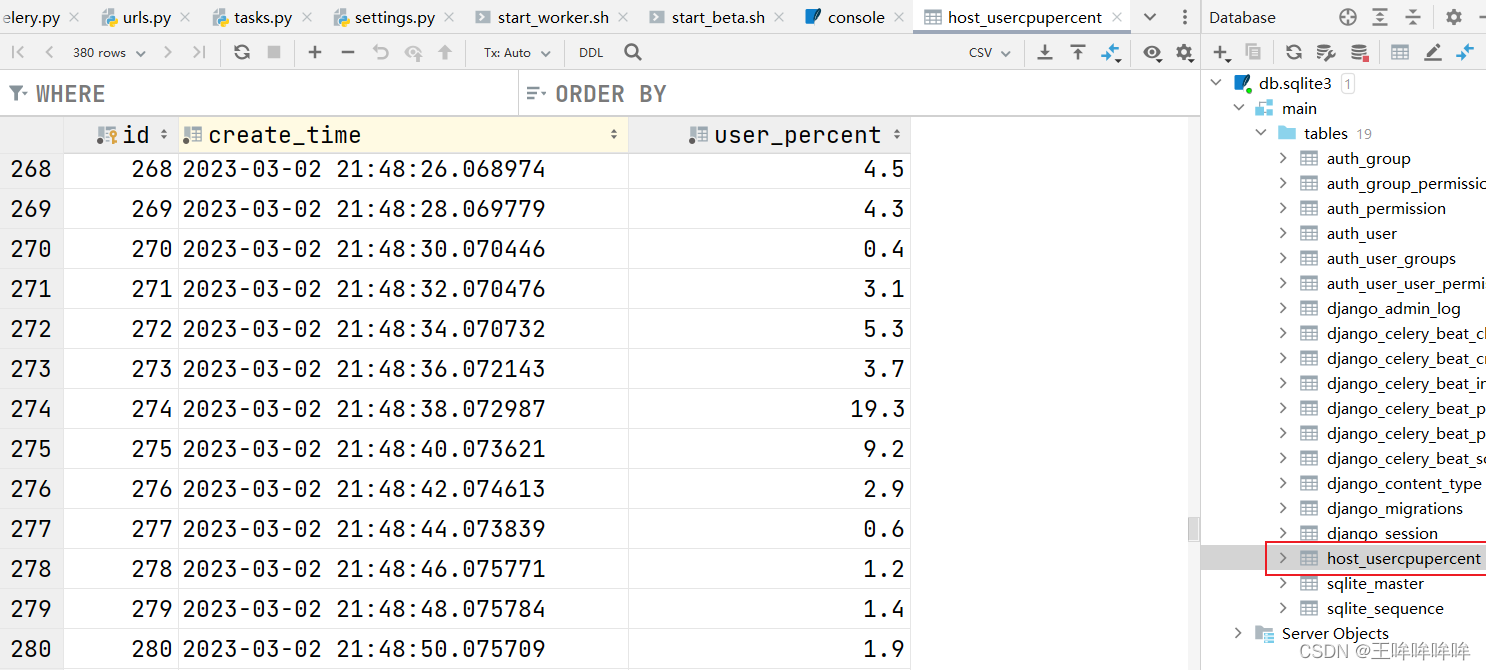
数据已经存储到数据库中:
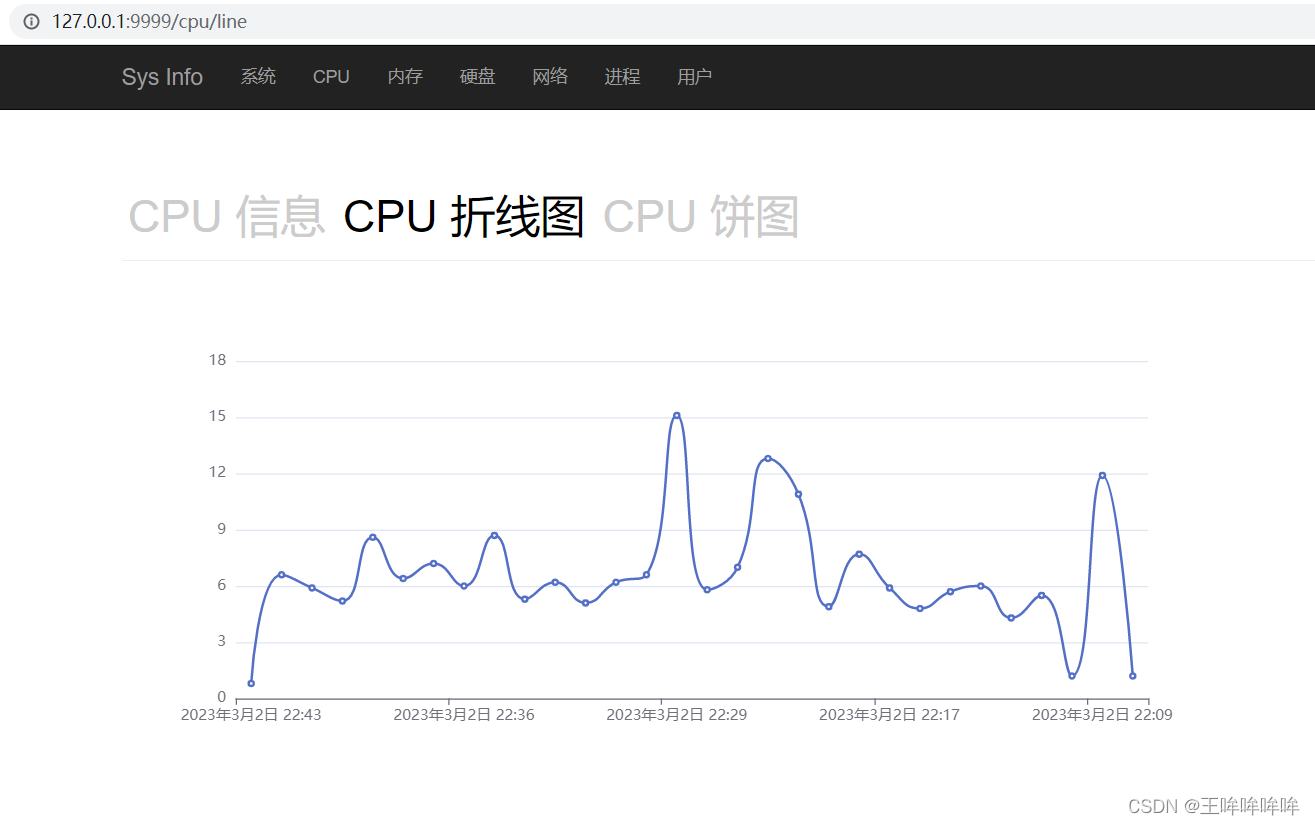
根据数据库中的数据绘制CPU折线图
修改视图函数: host/views.py
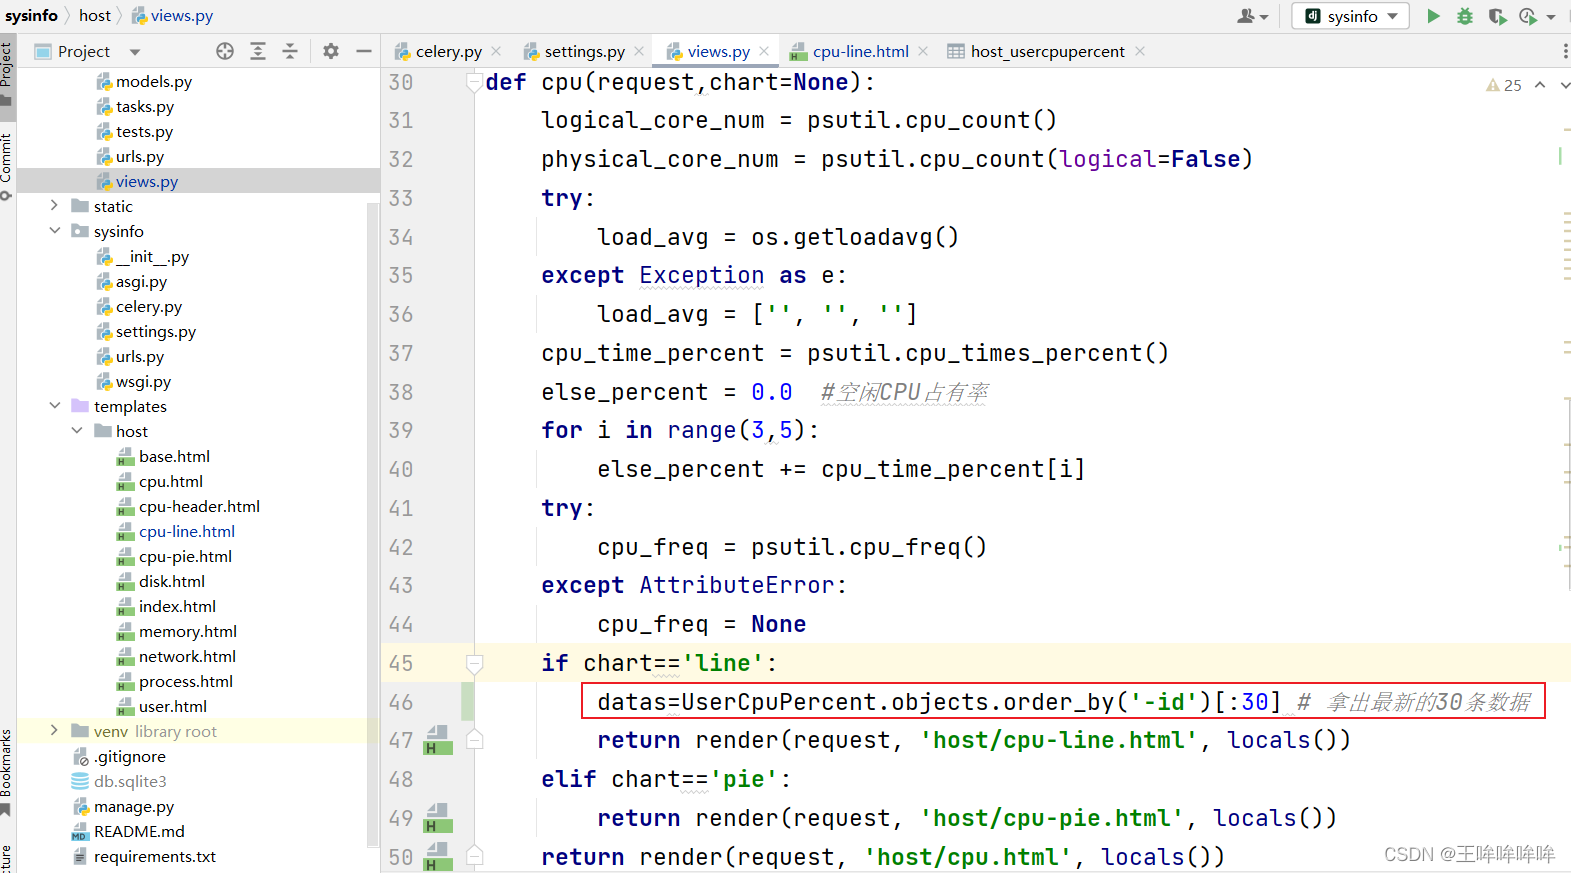
修改 templates/host/cpu-line.html 前端界面,获取数据:
{% extends 'host/base.html' %}
{% load timefilter %}
{% block title %} cpu信息 {% endblock %}
{% block content %}
    {% include 'host/cpu-header.html' %}
    <div>
        <div id="main" style="width: 80%;height:400px;"></div>
    </div>
    <script type="text/javascript">
        // 基于准备好的dom,初始化echarts实例
        var myChart = echarts.init(document.getElementById('main'));
        {# 首先,生命两个javascript数组 #}
        var series_data=[];
        var xAxis_data=[];
        {# 使用循环,依次将数据库需要展示的数据添加到声明的两个数组中 #}
        {% for data in datas %}
            series_data.push({{ data.user_percent }})
            xAxis_data.push("{{ data.create_time }}")
        {% endfor %}
        // 指定图表的配置项和数据
        option = {
            xAxis: {
                type: 'category',
                data: xAxis_data
            },
            yAxis: {
                type: 'value'
            },
            series: [
                {
                    data: series_data,
                    type: 'line',
                    smooth: true
                }
            ]
        };
        // 使用刚指定的配置项和数据显示图表。
        myChart.setOption(option);
    </script>
{% endblock %}
为了使得数据更好地展示,可以修改定时任务的时间间隔。例如1分钟或者3分钟、5分钟。
