实例8:机器人的空间描述和变换仿真
实验目的
- 通过刚体与刚体的平动、转动基础知识的学习,熟悉位姿的描述
- 通过Python编程实践,可视化学习坐标系的变换,熟悉空间变换
实验要求
建立一个原点位于零点的三维正交坐标系,x、y、z轴分别用红、绿、蓝三色表示。
实验知识
1.实例介绍
在这个实例中,我们将学习机器人运动学的基础-空间的描述与变换。
空间的描述与变换将定性定量地解释四足机器狗上零件的基本运动,四足机器狗mini pupper上有12个舵机,每个舵机都有自己的空间位置和运动,为了表达舵机等零件的本身的位置和姿态,我们需要定义坐标系并给出表示的规则,这些位置和姿态的描述将作为表达线速度、角速度、力和力矩的基础。
为了描述空间中物体的位置和姿态,一般可以在物体上设置一个坐标系,称为物体坐标系,在参考坐标系中描述通过位置和姿态来描述这个物体坐标系。任一的坐标系也可以作为另一个坐标系的参考坐标系,这就涉及到了坐标系和坐标系之间的位置和姿态的变换,称之为位姿变换。因此,要了解mini pupper的运动,需要研究同一物体在不同坐标系中的位置和姿态的描述方法,以及量化计算位置和姿态的数学方法。
图片1: 相对于坐标系的矢量p21
2.什么是刚体?
为了简化机器人模型,我们将四足机器狗mini pupper上的各关节零件视作刚体(rigid body),刚体是在运动中和受到力的作用后,形状和大小不变,而且内部各点的相对位置不变的物体。
2.怎样描述刚体的位姿?
位置描述
为了描述mini pupper上的零件在空间中的位置,在数学中,我们通常用三个正交的带有箭头的单位矢量来描述一个三维坐标系,在这里称为世界坐标系,世界坐标系
A
A
A中的点
A
P
^{A}P
AP可以用一个
3
×
1
3\times1
3×1的位置矢量来表达,这个矢量可被认为是空间中的一个位置。
A
P
=
[
p
x
p
y
p
z
]
^AP= \left[ \begin{matrix} p_x\\ p_y\\ p_z \end{matrix} \right]
AP=
pxpypz
A
P
^AP
AP:P点相对于坐标系
A
A
A的位置矢量
p
x
p_x
px: P向量相对于坐标系
A
A
A的
x
x
x轴方向的分量
姿态描述
mini pupper上的零件刚体除了需要表示位置,通常还需要描述它的姿态,为了描述这个姿态,我们将在物体上固定一个坐标系并且给出这个坐标系相对参考坐标系的描述。
也就是说,我们用一个固定在物体上的坐标系来描述这个物体的姿态,而这个坐标系的描述可以利用相对参考系的三个主轴单位矢量来描述。
用
X
B
^
\hat{X_B}
XB^ 、
Y
B
^
\hat{Y_B}
YB^ 、
Z
B
^
\hat{Z_B}
ZB^ 来表示坐标系
B
B
B主轴方向的单位矢量,如果用坐标系
A
A
A来作为参考系,则写作
A
X
B
^
\hat{^AX_B}
AXB^ 、
A
Y
B
^
\hat{^AY_B}
AYB^ 、
A
Z
B
^
\hat{^AZ_B}
AZB^ ,按前述顺序组成
3
×
1
3 \times1
3×1的矩阵,这个矩阵被称为旋转矩阵。
旋转矩阵
B
A
R
^A_BR
BAR是坐标系
B
B
B相对于参考坐标系
A
A
A的表达:
B
A
R
=
(
A
X
B
^
A
Y
B
^
A
Z
B
^
)
=
[
X
^
B
⋅
X
^
A
Y
^
B
⋅
X
^
A
Z
^
B
⋅
X
^
A
X
^
B
⋅
Y
^
A
Y
^
B
⋅
Y
^
A
Z
^
B
⋅
Y
^
A
X
^
B
⋅
Z
^
A
Y
^
B
⋅
Z
^
A
Z
^
B
⋅
Z
^
A
]
(旋转矩阵)
^A_BR =(\hat{^AX_B}\quad\hat{^AY_B}\quad\hat{^AZ_B} ) = \left[ \begin{matrix} \hat X_B\cdot \hat X_A& \hat Y_B\cdot \hat X_A & \hat Z_B\cdot \hat X_A \\ \hat X_B\cdot \hat Y_A& \hat Y_B\cdot \hat Y_A&\hat Z_B\cdot \hat Y_A \\ \hat X_B\cdot \hat Z_A & \hat Y_B\cdot \hat Z_A & \hat Z_B\cdot \hat Z_A \end{matrix} \right] \tag{旋转矩阵}
BAR=(AXB^AYB^AZB^)=
X^B⋅X^AX^B⋅Y^AX^B⋅Z^AY^B⋅X^AY^B⋅Y^AY^B⋅Z^AZ^B⋅X^AZ^B⋅Y^AZ^B⋅Z^A
(旋转矩阵)
B
A
R
^A_BR
BAR:坐标系
B
B
B相对于参考坐标系
A
A
A的旋转矩阵
X
^
B
\hat X_B
X^B:坐标系
B
B
B的
x
x
x方向的单位矢量
X
^
A
\hat X_A
X^A:坐标系
A
A
A的
x
x
x方向的单位矢量
位姿描述
在四足机器狗mini pupper的运动学中,位置和姿态经常成对出现,称之为位姿。
结合位置描述与姿态描述,得出一个位姿
{
B
}
\left\{ B \right\}
{B}可以等价地用一个位置矢量
A
P
B
O
R
G
^AP_{B ORG}
APBORG和一个旋转矩阵
B
A
R
^A_BR
BAR来描述:
{
B
}
=
{
B
A
R
,
A
P
B
O
R
G
}
\left\{ B \right\}=\left\{ ^A_BR ,^AP_{B ORG}\right\}
{B}={BAR,APBORG}
A
P
B
O
R
G
^AP_{B ORG}
APBORG:确定位姿
{
B
}
\left\{ B \right\}
{B}的原点的位置矢量,ORG为Origin,即原点之意
4.如何描述刚体的平移与旋转?
平移
在了解完位置、姿态、位姿的概念后,我们将学习如何从一个坐标系变换到另一个坐标系,这使得mini pupper的刚体零件可以在不同的参考坐标系中被表达为一个相同的量。
图片2:位姿变换图
下面,就让我们来尝试将一个坐标平移来体会四足机器狗mini pupper上的刚体零件的运动。
坐标平移是简单的运动,在
{
A
}
\left\{ A \right\}
{A}和
{
B
}
\left\{ B \right\}
{B}的姿态相同时,
{
B
}
\left\{ B \right\}
{B}不同与
{
A
}
\left\{ A \right\}
{A}的只有平移,所以可以用一个位置矢量
A
P
B
O
R
G
^AP_{B ORG}
APBORG来描述
{
B
}
\left\{ B \right\}
{B}相对于
{
A
}
\left\{ A \right\}
{A}的位置。
图片3:坐标平移图
以下为矢量相加的办法求点
P
P
P相对于
{
A
}
\left\{ A \right\}
{A}的表示
A
P
^AP
AP:
A
P
=
B
P
+
A
P
B
O
R
G
^AP= {\kern 2pt}^BP+ {\kern 2pt}^AP_{BORG}
AP=BP+APBORG
旋转
通常认为,
{
B
}
\left\{ B \right\}
{B}相对于
{
A
}
\left\{ A \right\}
{A}的旋转矩阵表示为
B
A
R
^A_BR
BAR
旋转矩阵各列的模为1,各单位矢量均相互正交,可得:
B
A
R
=
B
A
R
−
1
=
A
B
R
T
^A_BR = ^A_BR^{-1}=^B_AR^T
BAR=BAR−1=ABRT
对于
A
P
=
B
P
+
A
P
B
O
R
G
^AP= {\kern 2pt}^BP+ {\kern 2pt}^AP_{BORG}
AP=BP+APBORG
可以用更简洁的形式:一个
4
×
4
4 \times 4
4×4矩阵形式的算子,并用一个
4
×
1
4\times 1
4×1的位置矢量。
( A P 1 ) = [ A B R A P B O R G 0 0 0 1 ] ( B P 1 ) \left( \begin{matrix} ^AP \\ 1 \end{matrix} \right)= \left[ \begin{matrix} A_BR &^AP_{BORG}\\ 0{\kern 3pt}0{\kern 3pt}0&1 \end{matrix} \right] \left( \begin{matrix} ^BP \\ 1 \end{matrix} \right) (AP1)=[ABR000APBORG1](BP1)
这个
4
×
4
4\times 4
4×4矩阵被称为齐次变换矩阵,它以普通矩阵的形式表示了一般变换中的旋转以及平移。
简写为:
A
P
=
B
A
T
B
P
^AP= {\kern 2pt}^A_BT {\kern 2pt}^BP
AP=BATBP
5. matplotlib
matplotlib是Python语言及其数值计算库NumPy的绘图库。它的设计与MATLAB非常类似,能够在Python中方便地绘制图像。
参考链接:matplotlib官方文档
6. numpy
NumPy(Numerical Python) 是 Python 语言的一个扩展程序库,支持大量的维度数组与矩阵运算,此外也针对数组运算提供大量的数学函数库,因此可以用来计算坐标系的变换。
参考链接:numpy官方文档
7. 绘制向量的函数
ax.quiver(起点x, 起点y, 起点z,x方向数值, y方向数值, z方向数值,arrow_length_ratio=箭头箭身比, color="颜色")
8. 用户的输入部分
move_pre= input("请输入坐标系原点相对参考坐标系原点平移的x、y、z分量:")
move = [int(n) for n in move_pre.split()]
print(move)
rotate_pre= input("请输入坐标系绕参考坐标系x轴、y轴、z轴依次旋转的角度:") # 旋转采用Fixed Angles模式
rotate = [int(n) for n in rotate_pre.split()]
print(rotate)
9. 安装matplotlib环境
sudo apt install pip # 安装pip
pip config set global.index-url https://pypi.tuna.tsinghua.edu.cn/simple # 换源
sudo pip install matplotlib # 安装matplotlib

实验步骤
1. 编写Python程序 frame_transformation.py
import matplotlib.pyplot as plt  # 引入matplotlib库
import numpy as np  # 引入numpy库

def rotate_X(x, y, z, alpha):
    alpha = alpha * (np.pi / 180)
    x_r = x
    y_r = np.cos(alpha)*y - np.sin(alpha)*z
    z_r = np.sin(alpha)*y + np.cos(alpha)*z
    print(f"Test_X-axis:{(x, y, z)} rotate {alpha*(180/np.pi)} degrees,result: {(x_r, y_r, z_r)}")
    return x_r, y_r, z_r

def rotate_Y(x, y, z, beta):
    beta = beta * (np.pi / 180)
    x_r = np.cos(beta)*x + np.sin(beta)*z
    y_r = y
    z_r = -np.sin(beta)*x + np.cos(beta)*z
    print(f"Test_Y-axis:{(x, y, z)} rotate {alpha*(180/np.pi)} degrees,result: {(x_r, y_r, z_r)}")
    return x_r, y_r, z_r

def rotate_Z(x, y, z,  gamma):
    gamma = gamma * (np.pi / 180)
    x_r = np.cos(gamma)*x - np.sin(gamma)*y
    y_r = np.sin(gamma)*x + np.cos(gamma)*y
    z_r = z
    print(f"Test_Z-axis:{(x, y, z)} rotate {alpha*(180/np.pi)} degrees,result: {(x_r, y_r, z_r)}")
    return x_r, y_r, z_r

def draw_before(px,py,pz):
    x_vector = ax.quiver(origin[0], origin[1], origin[2],
                         ac2 * x_axis_unit_vector[0], ac2 * x_axis_unit_vector[1], ac2 * x_axis_unit_vector[2],
                         arrow_length_ratio=0.1, color="black")  # 绘制A坐标系的x单位向量
    y_vector = ax.quiver(origin[0], origin[1], origin[2],
                         ac2 * y_axis_unit_vector[0], ac2 * y_axis_unit_vector[1], ac2 * y_axis_unit_vector[2],
                         arrow_length_ratio=0.1, color="black")  # 绘制A坐标系的y单位向量
    z_vector = ax.quiver(origin[0], origin[1], origin[2],
                         ac2 * z_axis_unit_vector[0], ac2 * z_axis_unit_vector[1], ac2 * z_axis_unit_vector[2],
                         arrow_length_ratio=0.1, color="black")  # 绘制A坐标系的z单位向量
    p_vector = ax.quiver(origin[0], origin[1], origin[2],
                         px, py, pz,
                         arrow_length_ratio=0.1, color="red")  # 绘制A坐标系的p向量
    print(px,py,pz)

# plot_init
fig = plt.figure() # 建立图像
ax = fig.add_subplot(projection="3d")  # 为图像添加三维坐标系
#ax.grid(False)  # 取消网格线,如需要网格线,请注释该行
# Setting the axes properties
ax.set(xlim3d=(0, 5), xlabel='X')
ax.set(ylim3d=(0, 5), ylabel='Y')
ax.set(zlim3d=(0, 5), zlabel='Z')

# variable_init
origin = [0, 0, 0]
x_axis_unit_vector = [1, 0, 0]
y_axis_unit_vector = [0, 1, 0]
z_axis_unit_vector = [0, 0, 1]
#ac = 6  # 坐标轴底色向量增益系数
ac2 = 4  # A坐标系增益系数

#绘制坐标轴底色向量
# ax.quiver(origin[0], origin[1], origin[2],
#           ac*x_axis_unit_vector[0], ac*x_axis_unit_vector[1], ac*x_axis_unit_vector[2],
#           arrow_length_ratio=0.1, color="black")  # 绘制x方向底色向量
# ax.quiver(origin[0], origin[1], origin[2],
#           ac*y_axis_unit_vector[0], ac*y_axis_unit_vector[1], ac*y_axis_unit_vector[2],
#           arrow_length_ratio=0.1, color="black")  # 绘制y方向底色向量
# ax.quiver(origin[0], origin[1], origin[2],
#           ac*z_axis_unit_vector[0], ac*z_axis_unit_vector[1], ac*z_axis_unit_vector[2],
#           arrow_length_ratio=0.1, color="black")  # 绘制z方向底色向量

# main
#move_pre= input("请输入坐标系原点相对参考坐标系原点平移的x、y、z分量:")
#move = [int(n) for n in move_pre.split()]
#print(move)


vector_in_A_pre= input("请输入该向量在参考坐标系A中的xyz分量:")
vector_in_A = [int(n) for n in vector_in_A_pre.split()]
print(vector_in_A)
rotate_pre= input("请输入向量绕参考坐标系x轴、y轴、z轴依次旋转的角度(角度制):") # 旋转采用Fixed Angles模式
rotate = [int(n) for n in rotate_pre.split()]
print(rotate)
alpha = rotate[0]
beta = rotate[1]
gamma = rotate[2]
draw_before(vector_in_A[0], vector_in_A[1], vector_in_A[2]) # 绘制原坐标系及原指定向量
first_vector = rotate_X(vector_in_A[0], vector_in_A[1], vector_in_A[2],alpha)
p1_vector = ax.quiver(origin[0], origin[1], origin[2],
                     first_vector[0], first_vector[1], first_vector[2],
                     arrow_length_ratio=0.1, color="orange")  # 绘制绕x旋转后的p向量
second_vector = rotate_Y(first_vector[0], first_vector[1], first_vector[2],beta)
p2_vector = ax.quiver(origin[0], origin[1], origin[2],
                     second_vector[0], second_vector[1], second_vector[2],
                     arrow_length_ratio=0.1, color="green")  # 绘制绕y旋转后的p向量
third_vector = rotate_Y(second_vector[0], second_vector[1], second_vector[2],gamma)
p3_vector = ax.quiver(origin[0], origin[1], origin[2],
                     third_vector[0], third_vector[1], third_vector[2],
                     arrow_length_ratio=0.1, color="blue")  # 绘制绕z旋转后的p向量

plt.show()  # 绘制
2. 运行程序,观察效果
在frame_transformation.py的目录下执行以下命令:
sudo python frame_transformation.py
输入对应的转动角度,此时应观察到向量绕各轴依次转动后的变化。
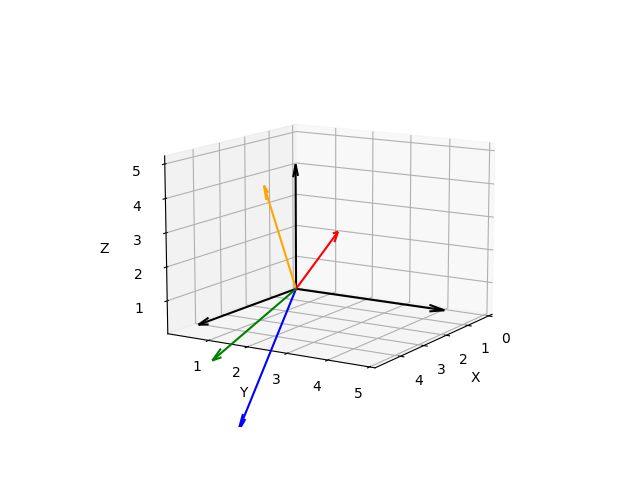
可视化动画:https://www.andre-gaschler.com/rotationconverter/
https://juejin.cn/post/7094065076008648718
实验总结
经过本知识点的学习和实验操作,你应该能达到以下水平:
| 知识点 | 内容 | 了解 | 熟悉 | 掌握 |
|---|---|---|---|---|
| 刚体 | 刚体的平动、转动基础知识 | ✔ | ||
| 位姿 | 位姿的描述 | ✔ | ||
| 坐标变换 | 坐标系之间的变换 | ✔ |
版权信息:教材尚未完善,此处预留版权信息处理方式
mini pupper相关内容可访问:https://github.com/mangdangroboticsclub


