框架:Grafana+Prometheus+Redis_exporter
Grafana安装-CSDN博客
普罗米修斯Prometheus监控安装(mac)-CSDN博客
1.Redis_exporter安装
直接下载
wget https://github.com/oliver006/redis_exporter/releases/download/v1.0.3/redis_exporter-v1.0.3.linux-amd64.tar.gz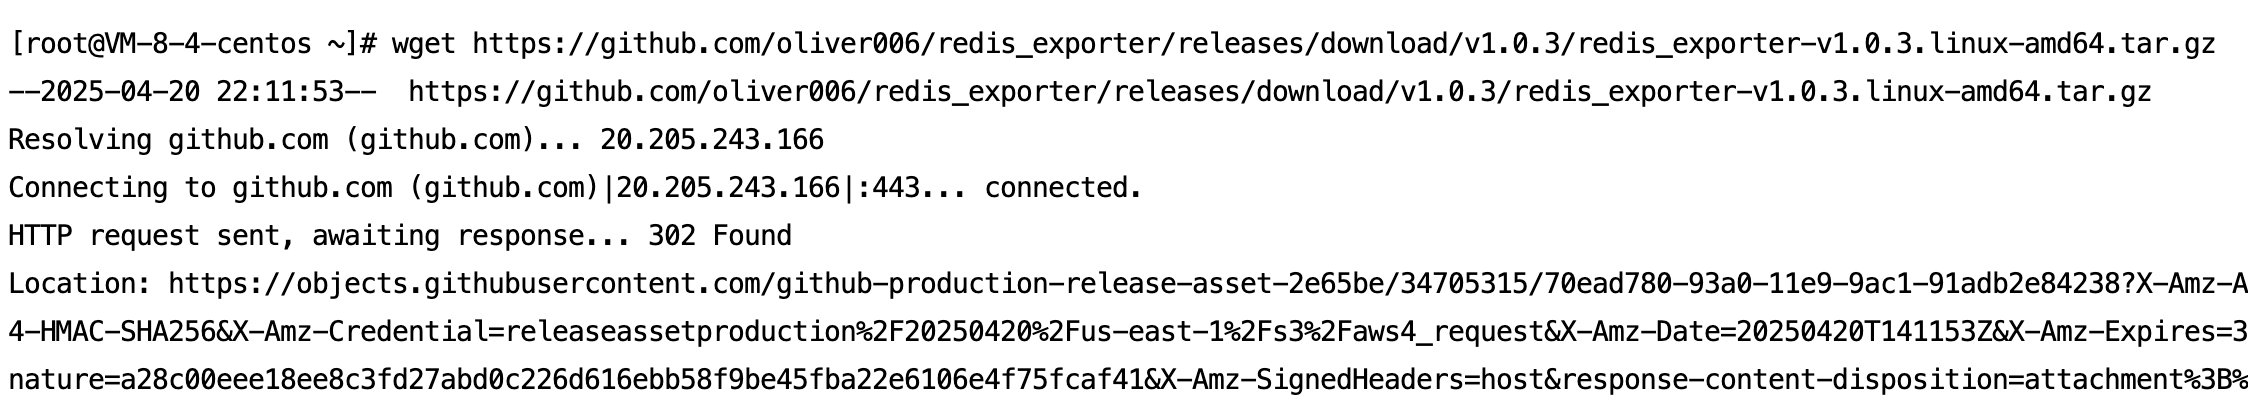
解压
tar -xvf redis_exporter-v1.0.3.linux-amd64.tar.gz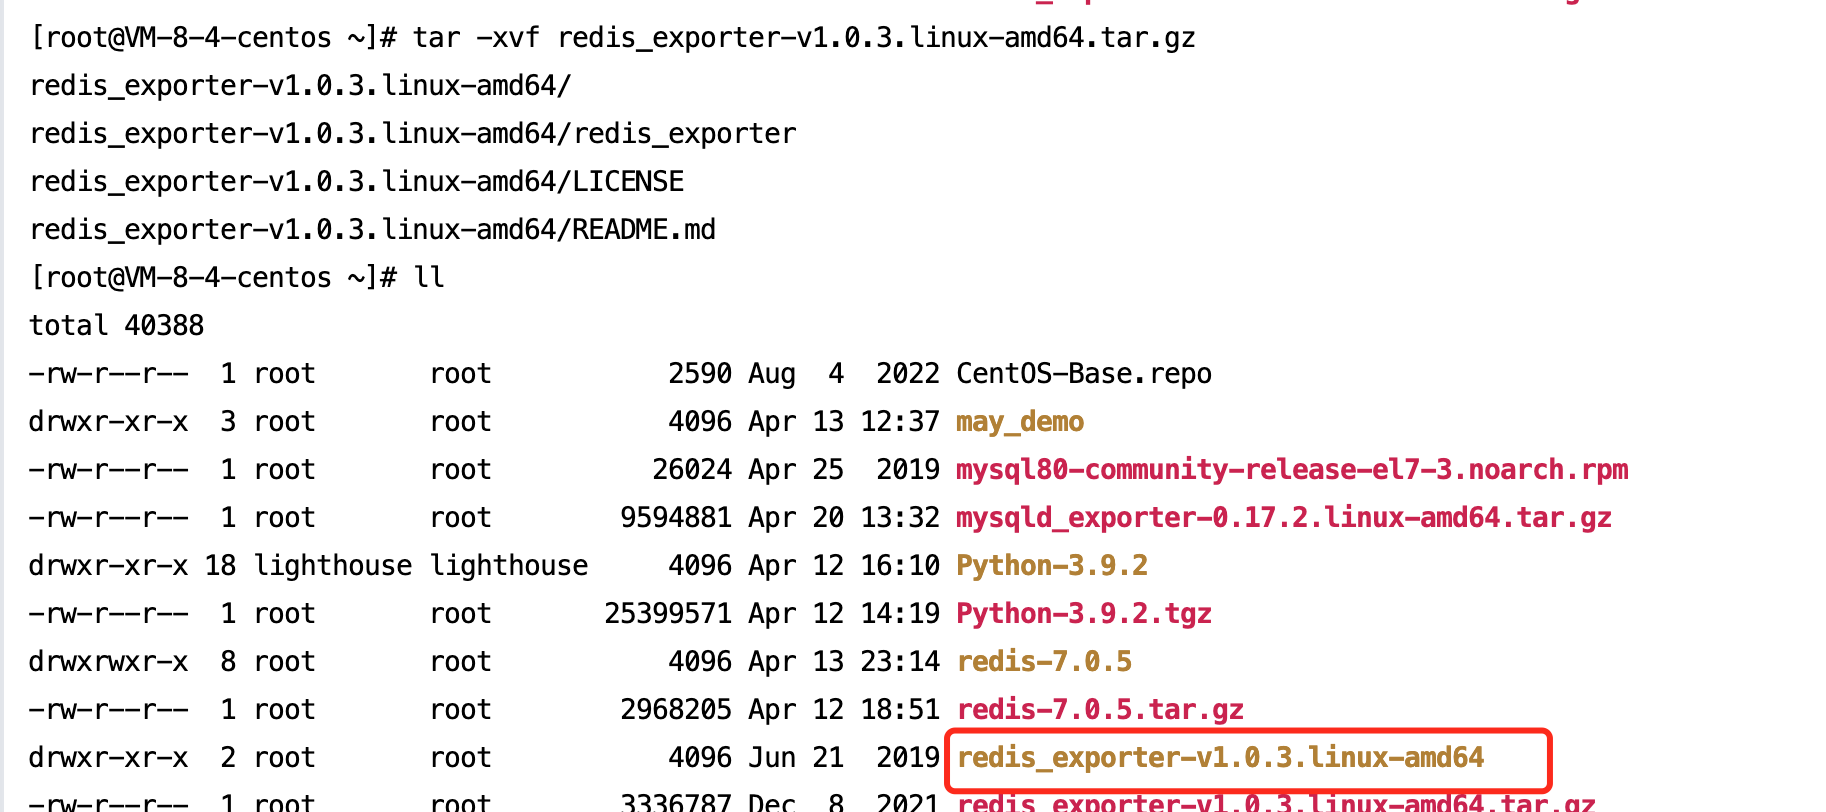
解压后修改名字,方便操作
mv redis_exporter-v1.0.3.linux-amd64 redis_exporter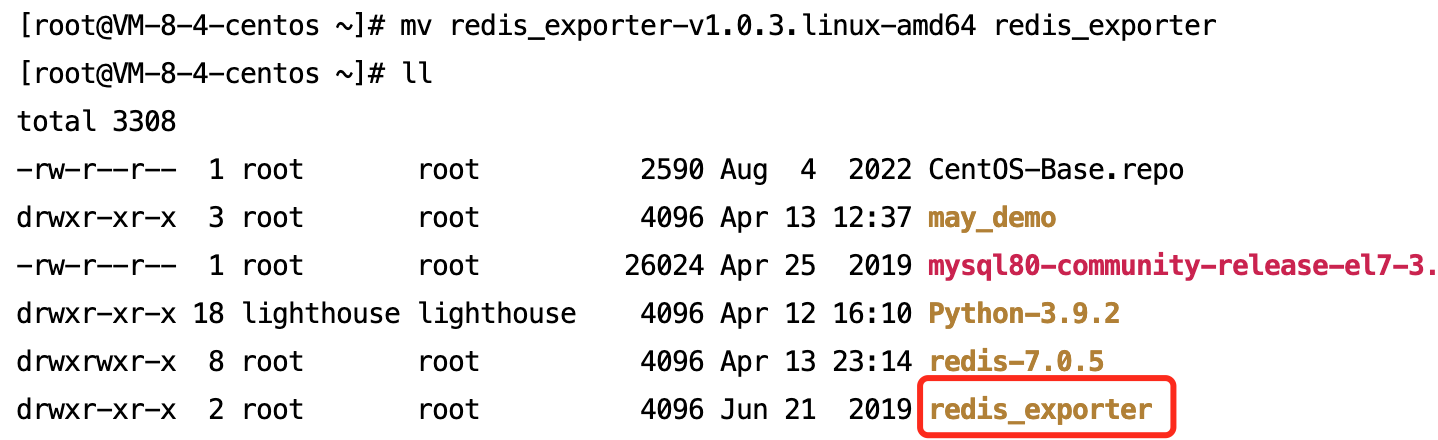
2.启动 Redis_exporter
进入 redis_exporter路径下
无密码
./redis_exporter redis//192.168.1.120:6379 &有密码
./redis_exporter -redis.addr 192.168.1.120:6379 -redis.password a***如果要让 Redis_exporter一直运行,不因与服务器连接页面关闭而关闭,使用以下指令
nohup ./redis_exporter -redis.addr redis://111.***0:6379 -redis.password a*** --web.listen-address=":9121" > nohup.log 2>&1 &ip地址和端口号请根据自身实际情况

3.配置Prometheus.yml
- Prometheus.yml配置路径
路径
/usr/local/etc/prometheus.yml
内容如下:
- job_name: "redis"
    static_configs:
    - targets: ["ip地址:9121"]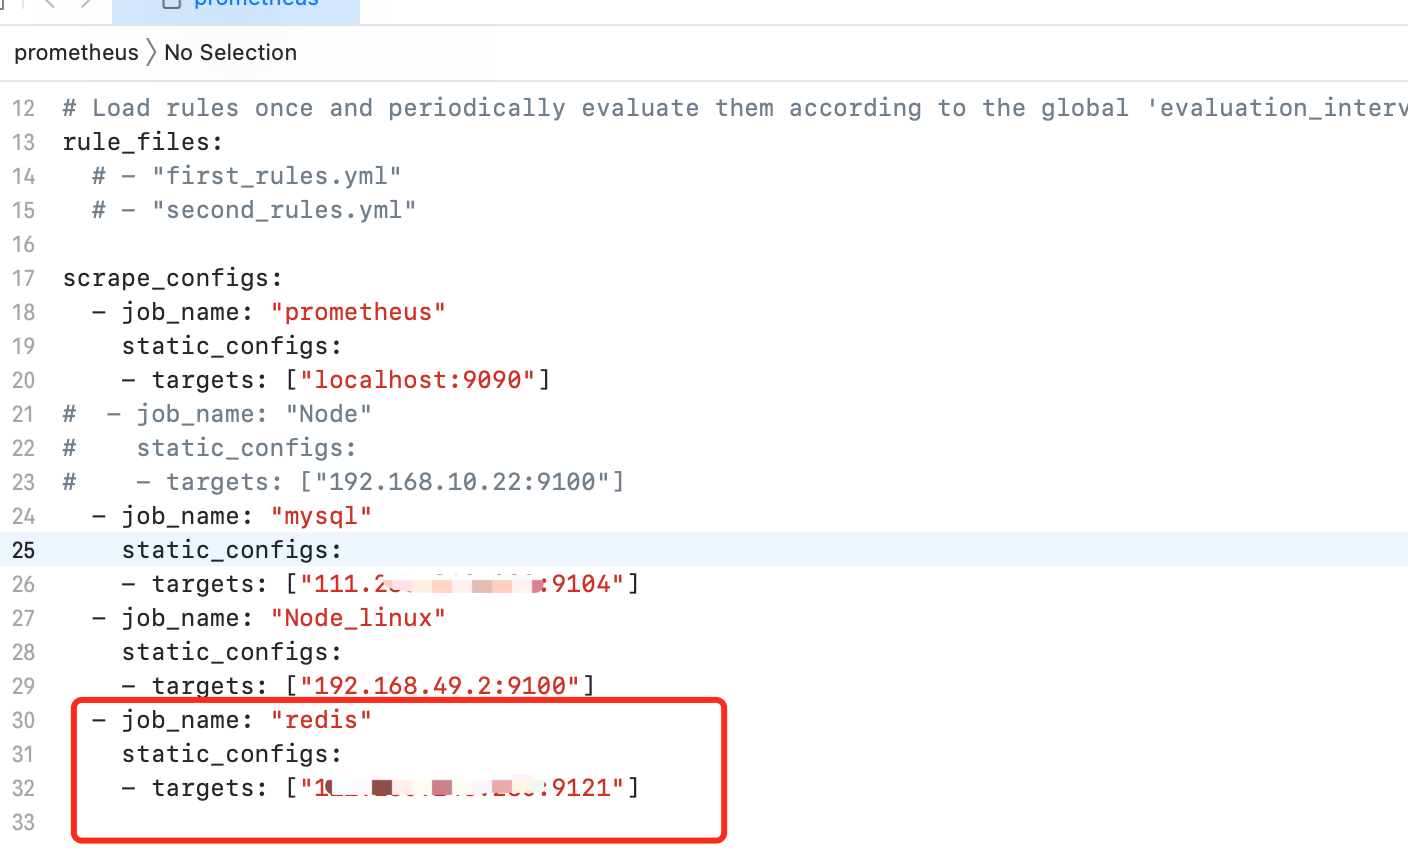
mac端重新加载:
prometheus --config.file=/usr/local/etc/prometheus.yml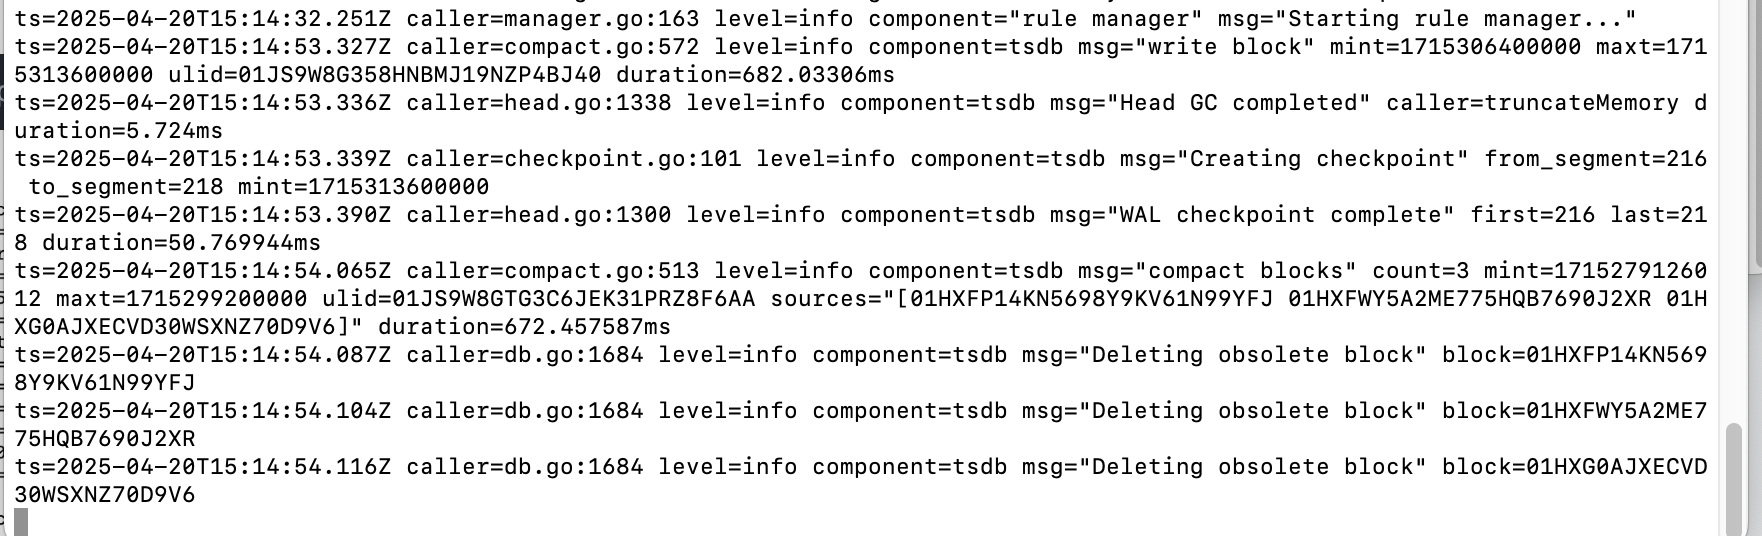
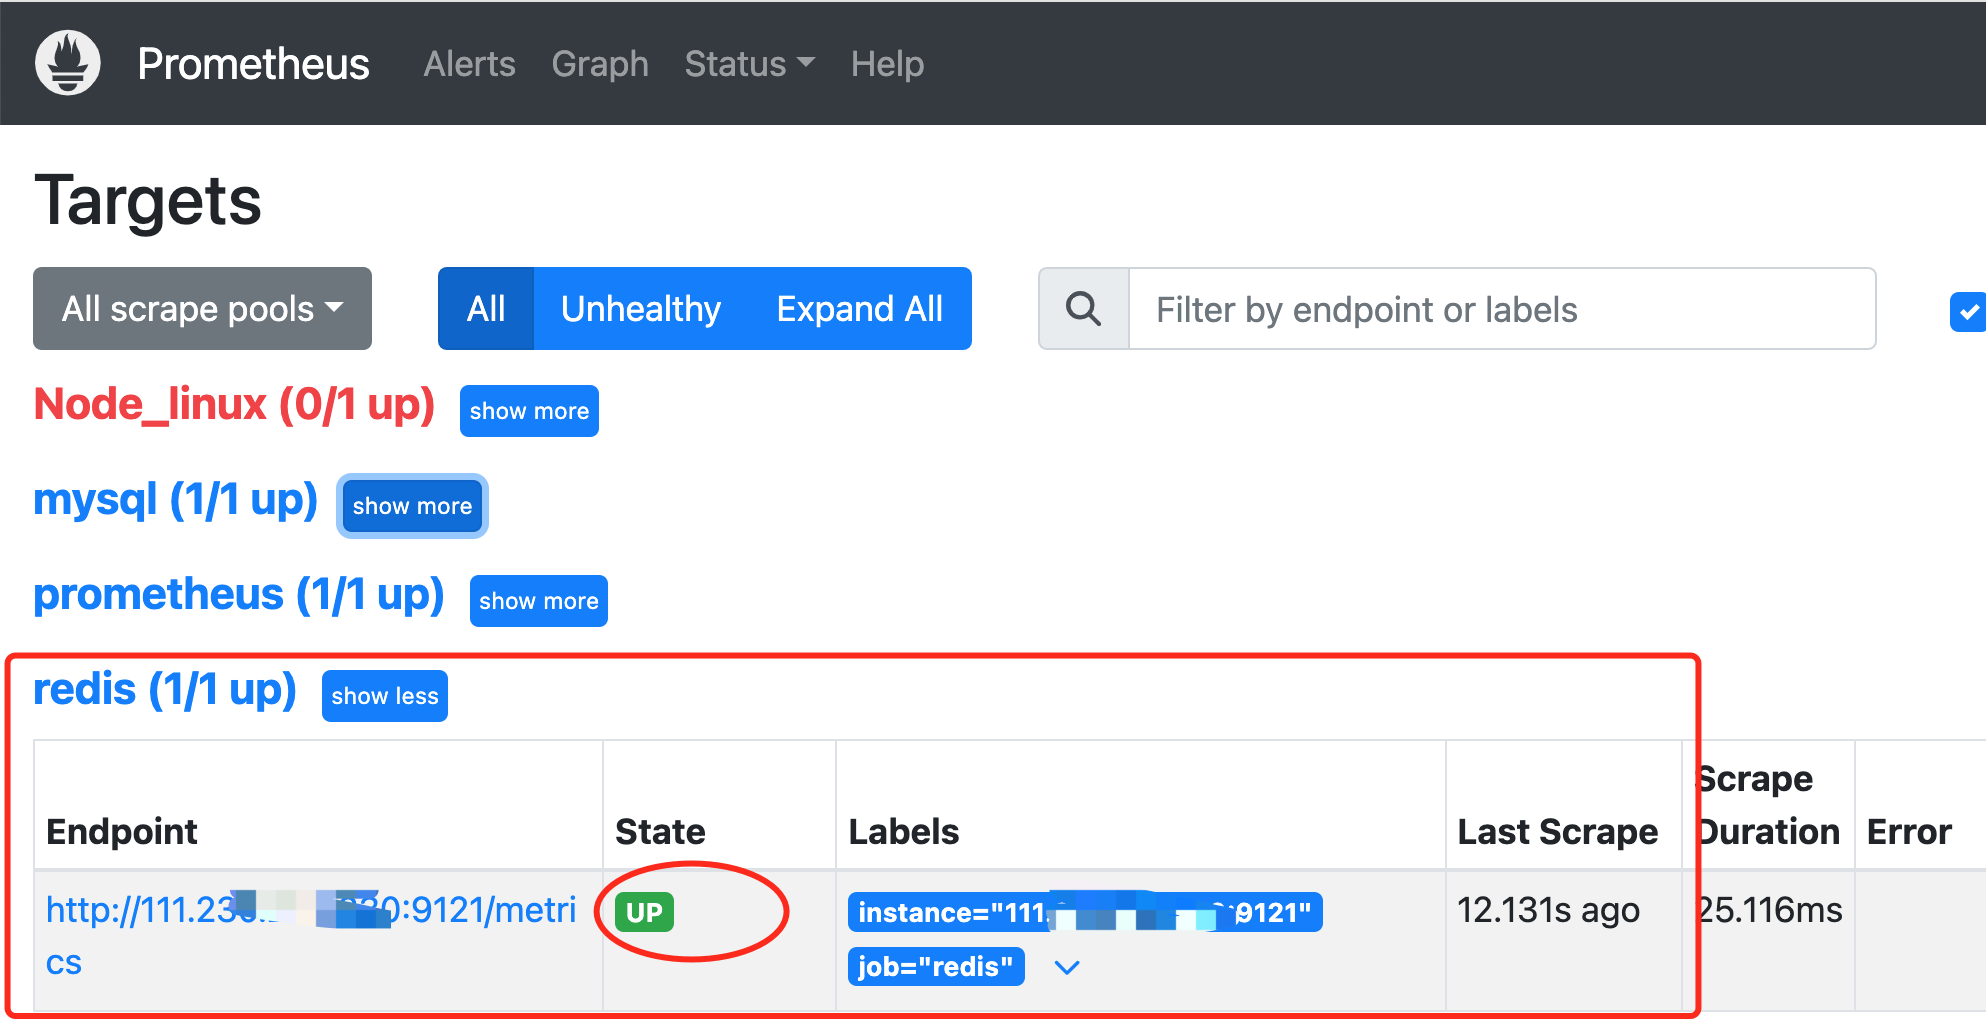
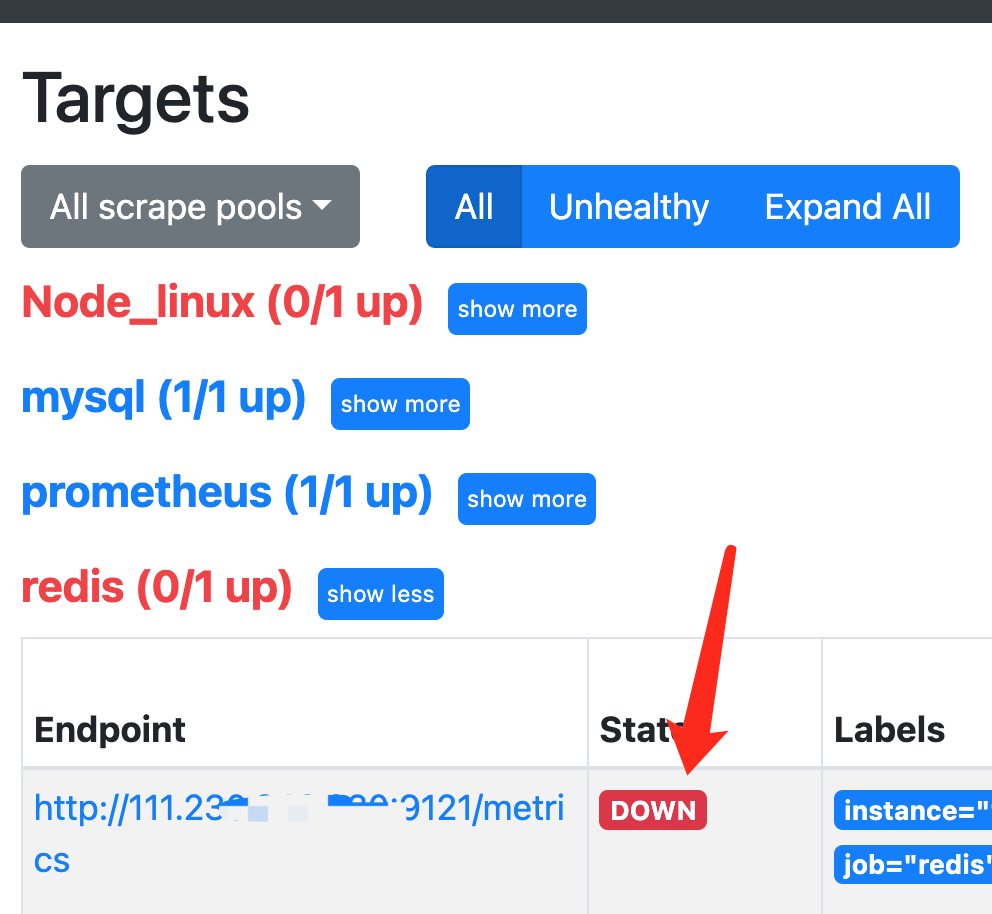
5.查Redis状态
- 进入地址
Premetheus的ip地址:9090/targets
http://localhost:9090/targets
如果显示State的结果为 UP 则说明成功。
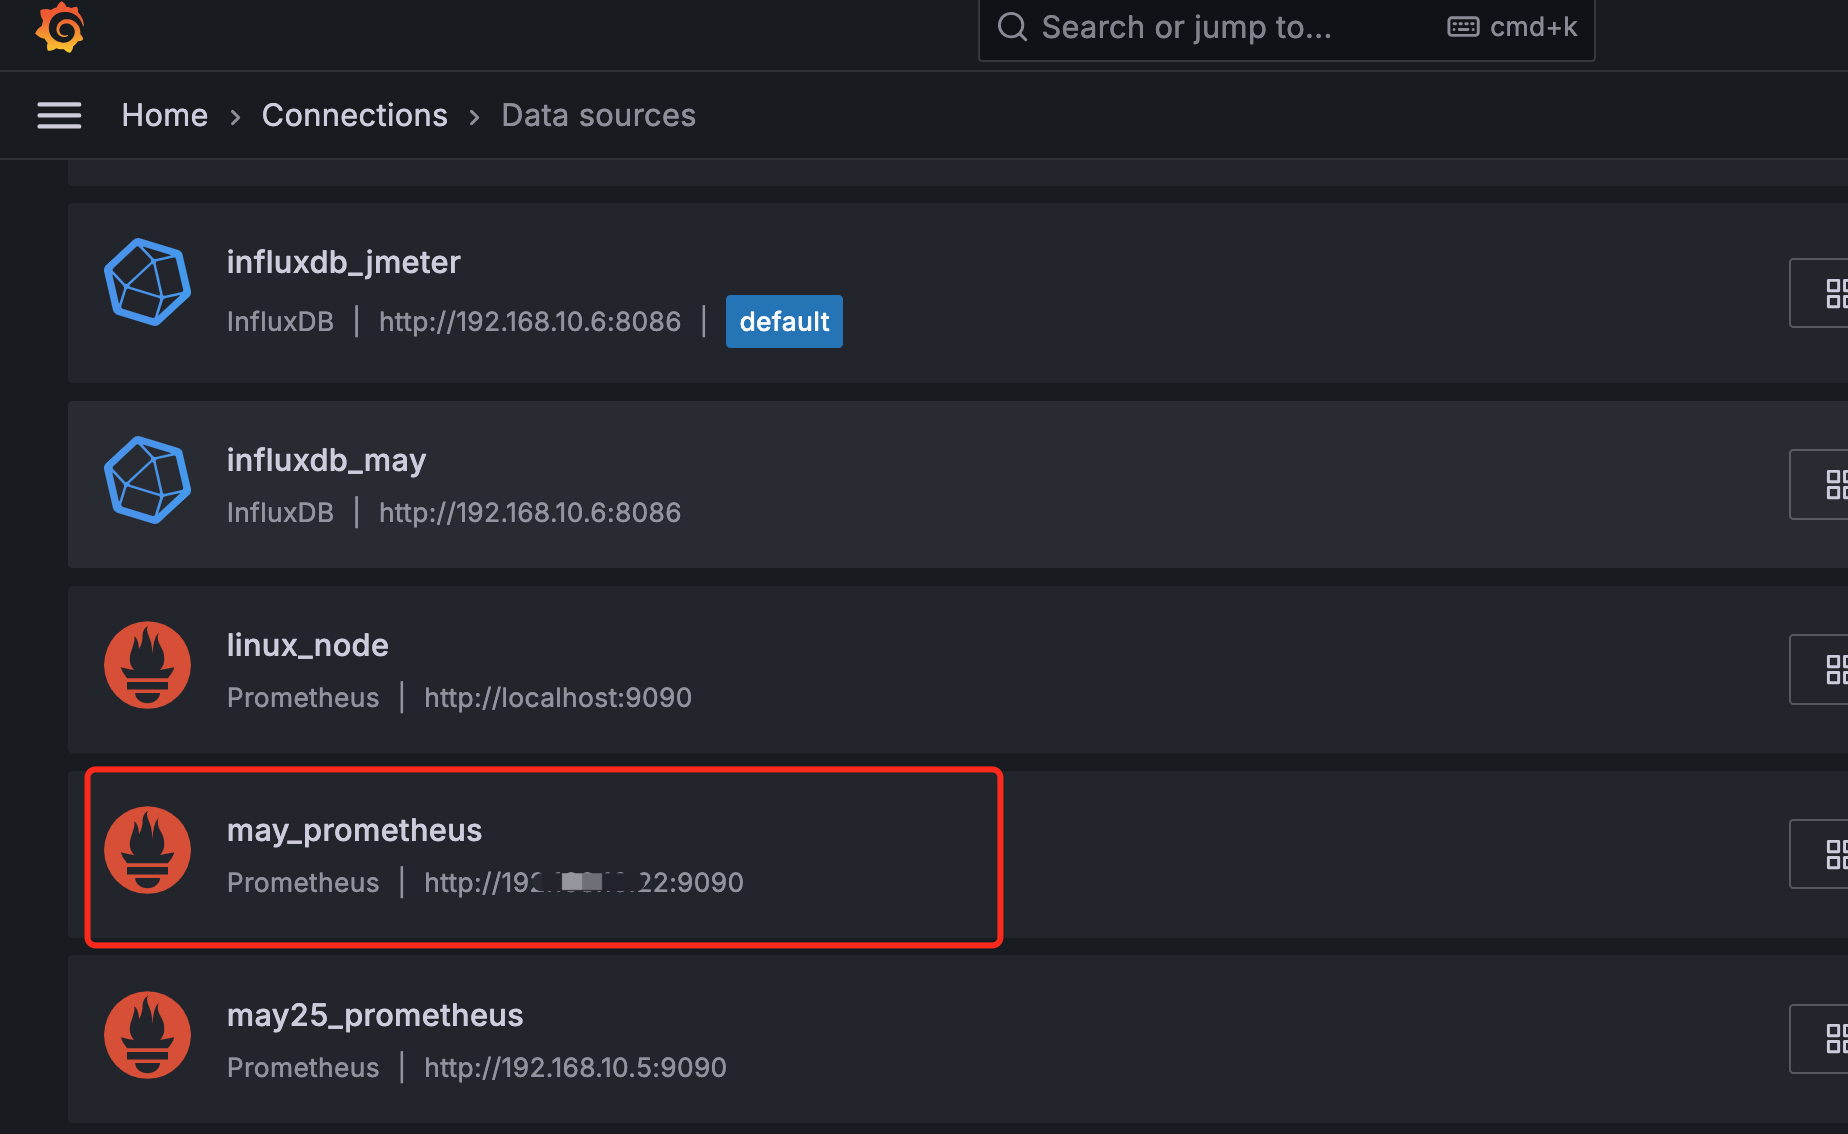
6. 配置Grafana的数据源
Grafana的ip地址:3000
本文:http://localhost:3000/
添加数据源,如果之前已经在Grafana中添加了此DataSource(指向了安装有Prometheus的ip地址和对应端口),则无需重新添加,在导入面板的时候,可以直接引用此DataSource;
点击左侧栏“Data sources”
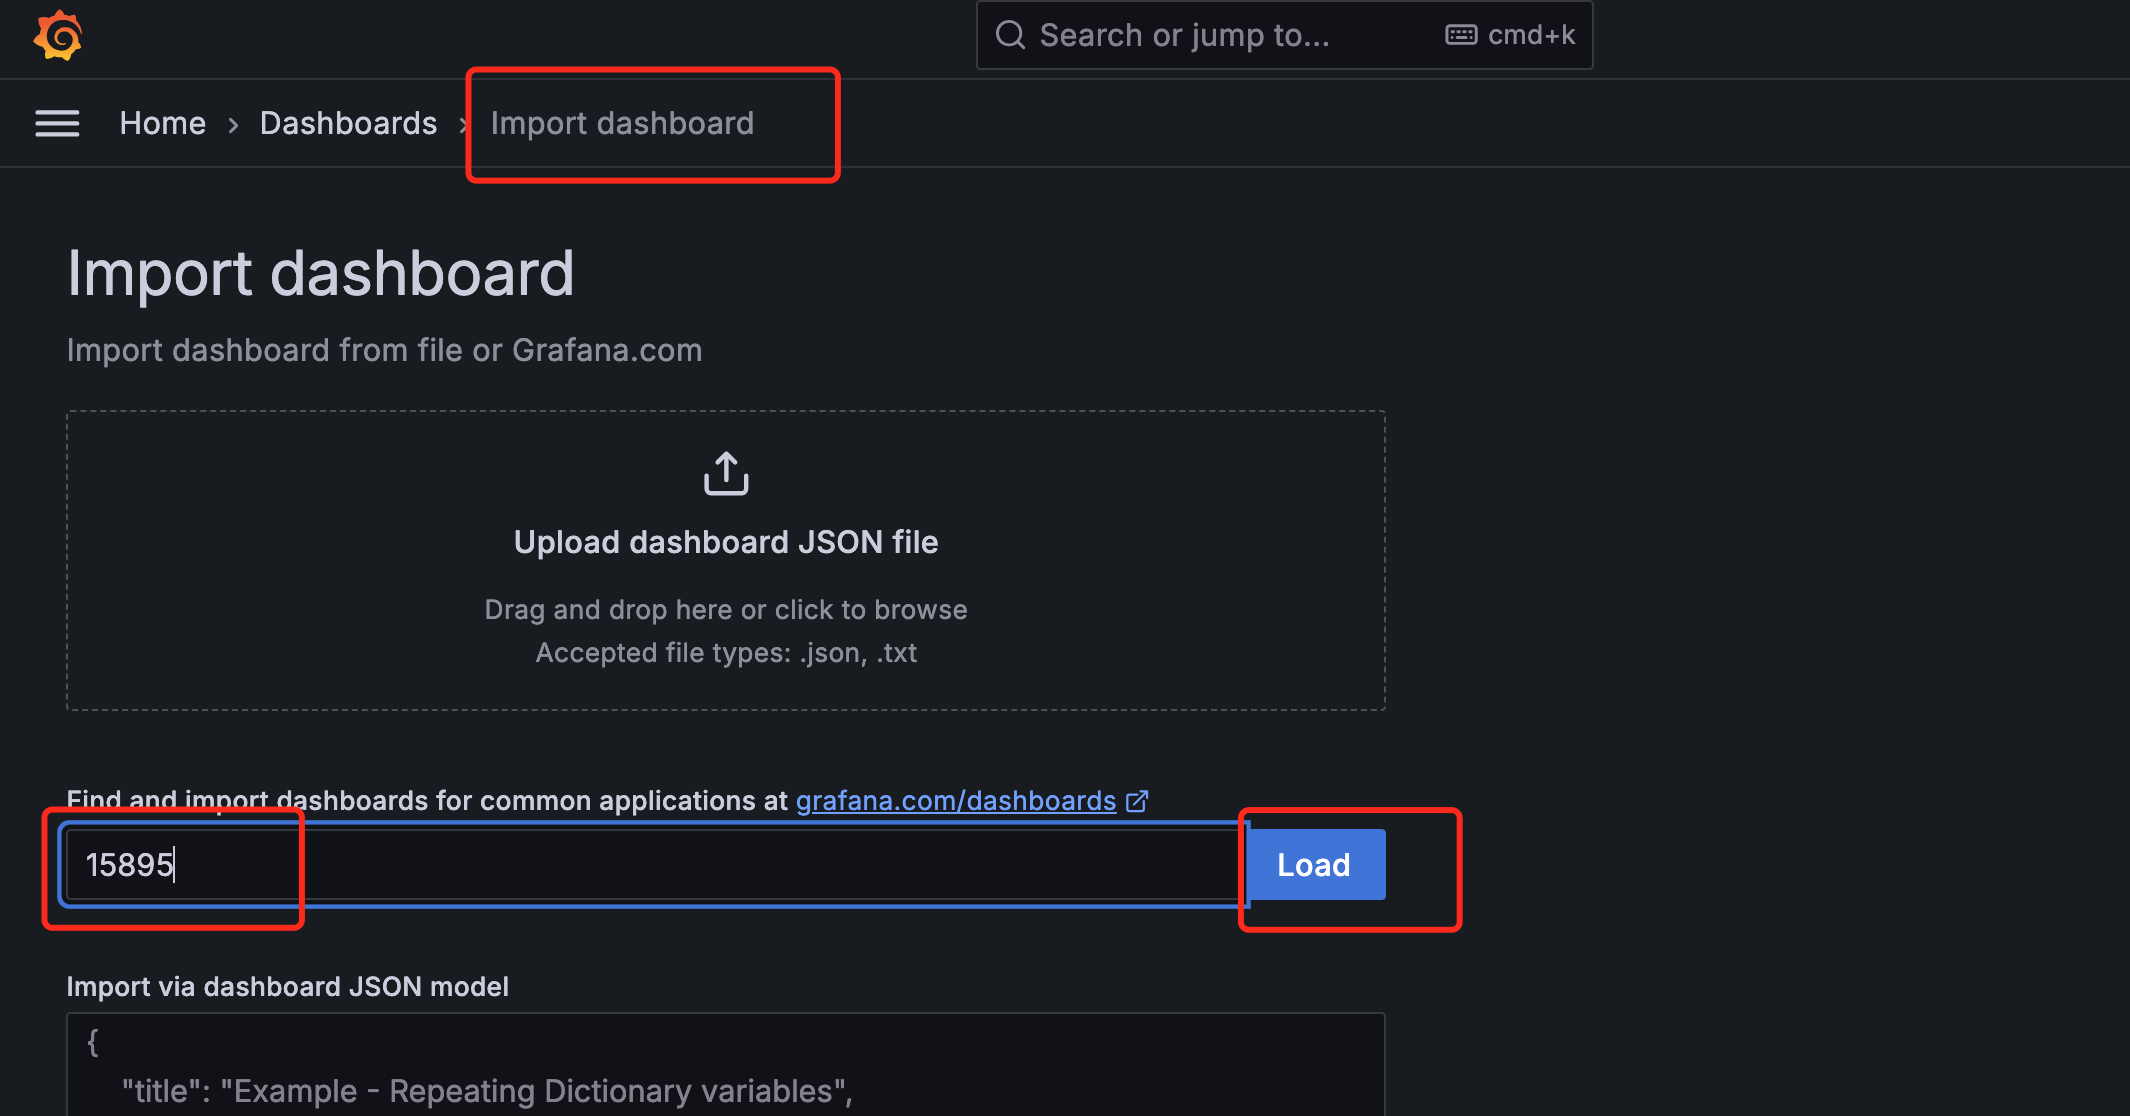
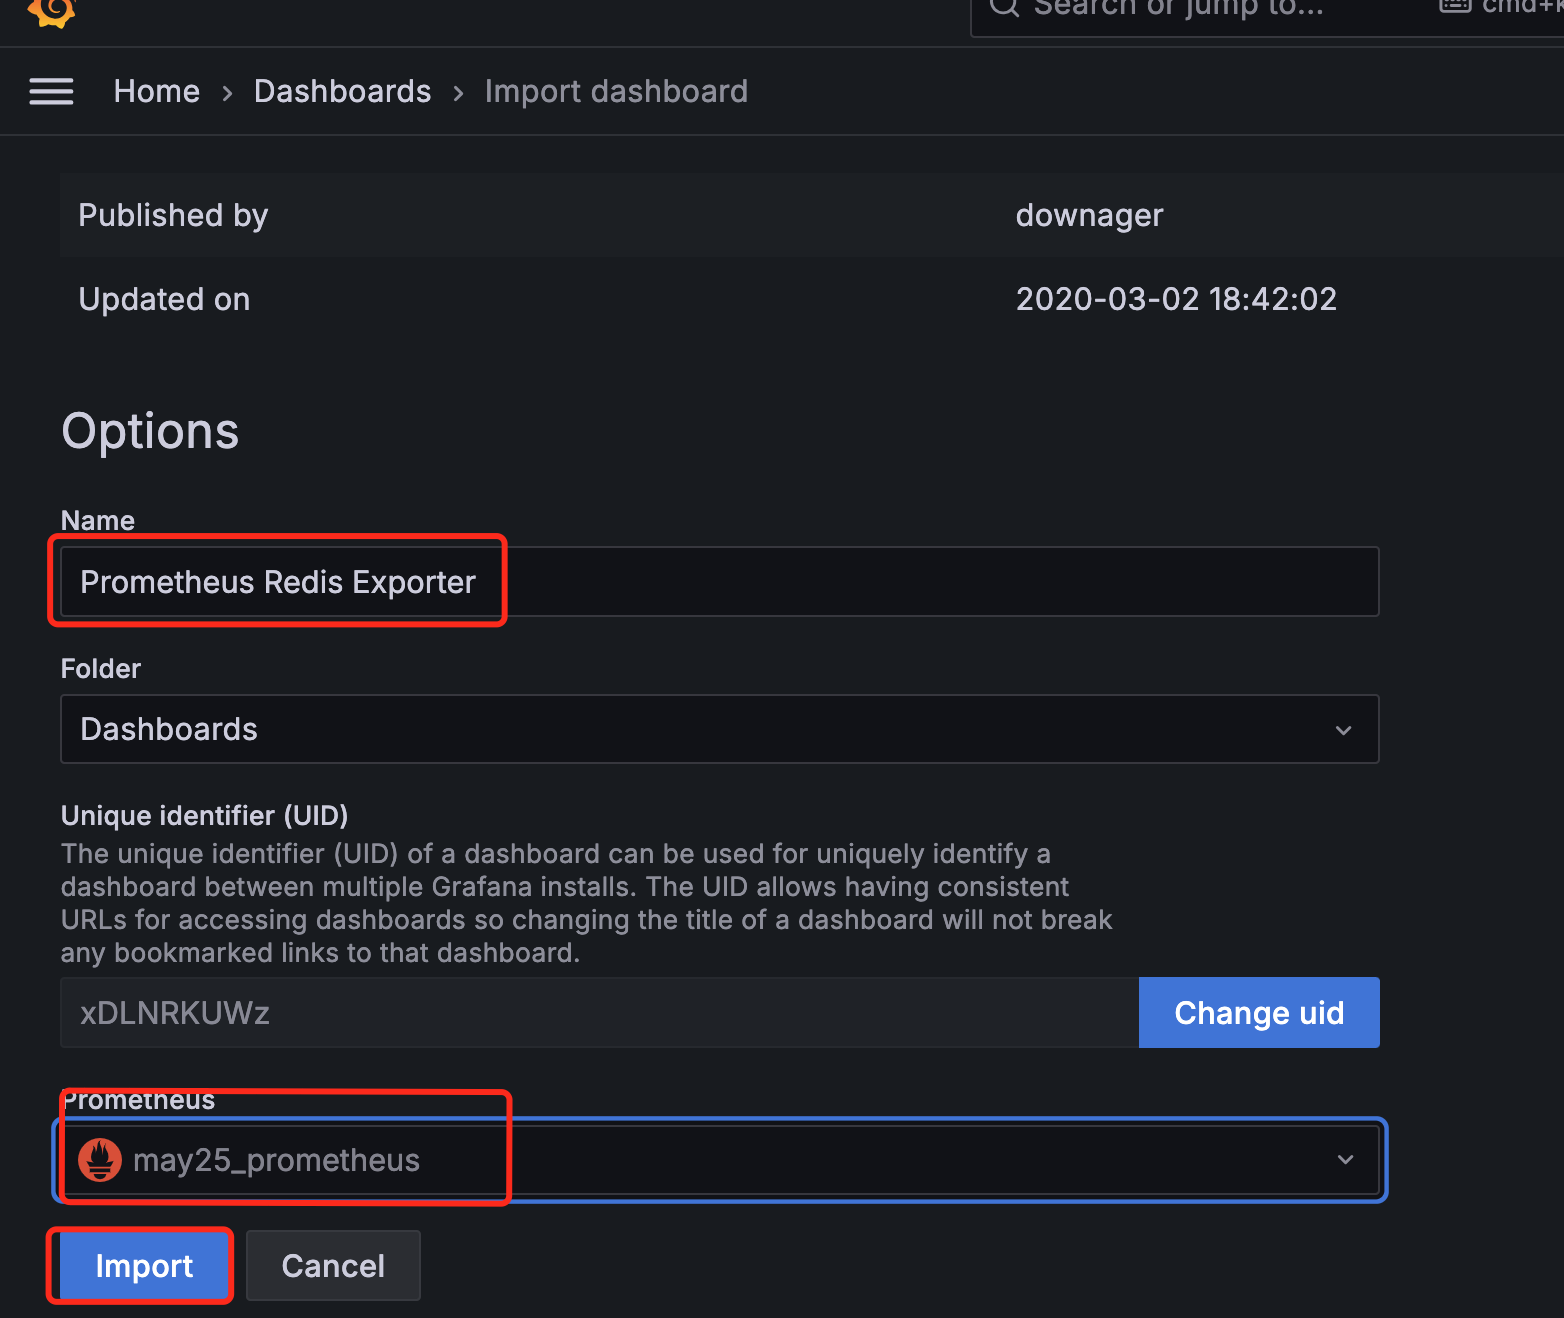
7.导入模板
- 点击 + 号选择Import
- 选择 15895/11835模板
官方控制面板地址:https://grafana.com/dashboards
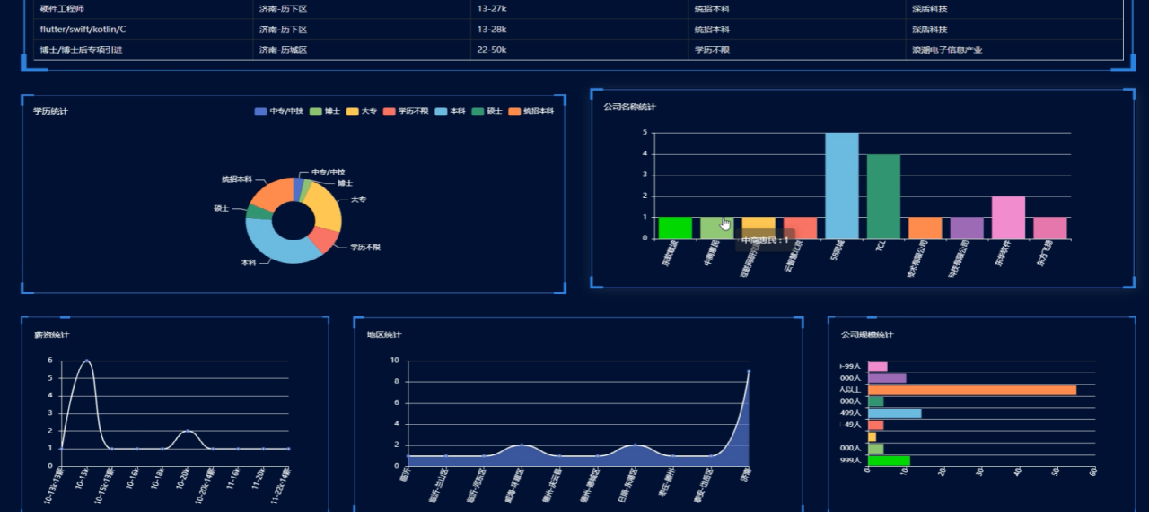
8.效果展示
Redis存在缓冲溢出漏洞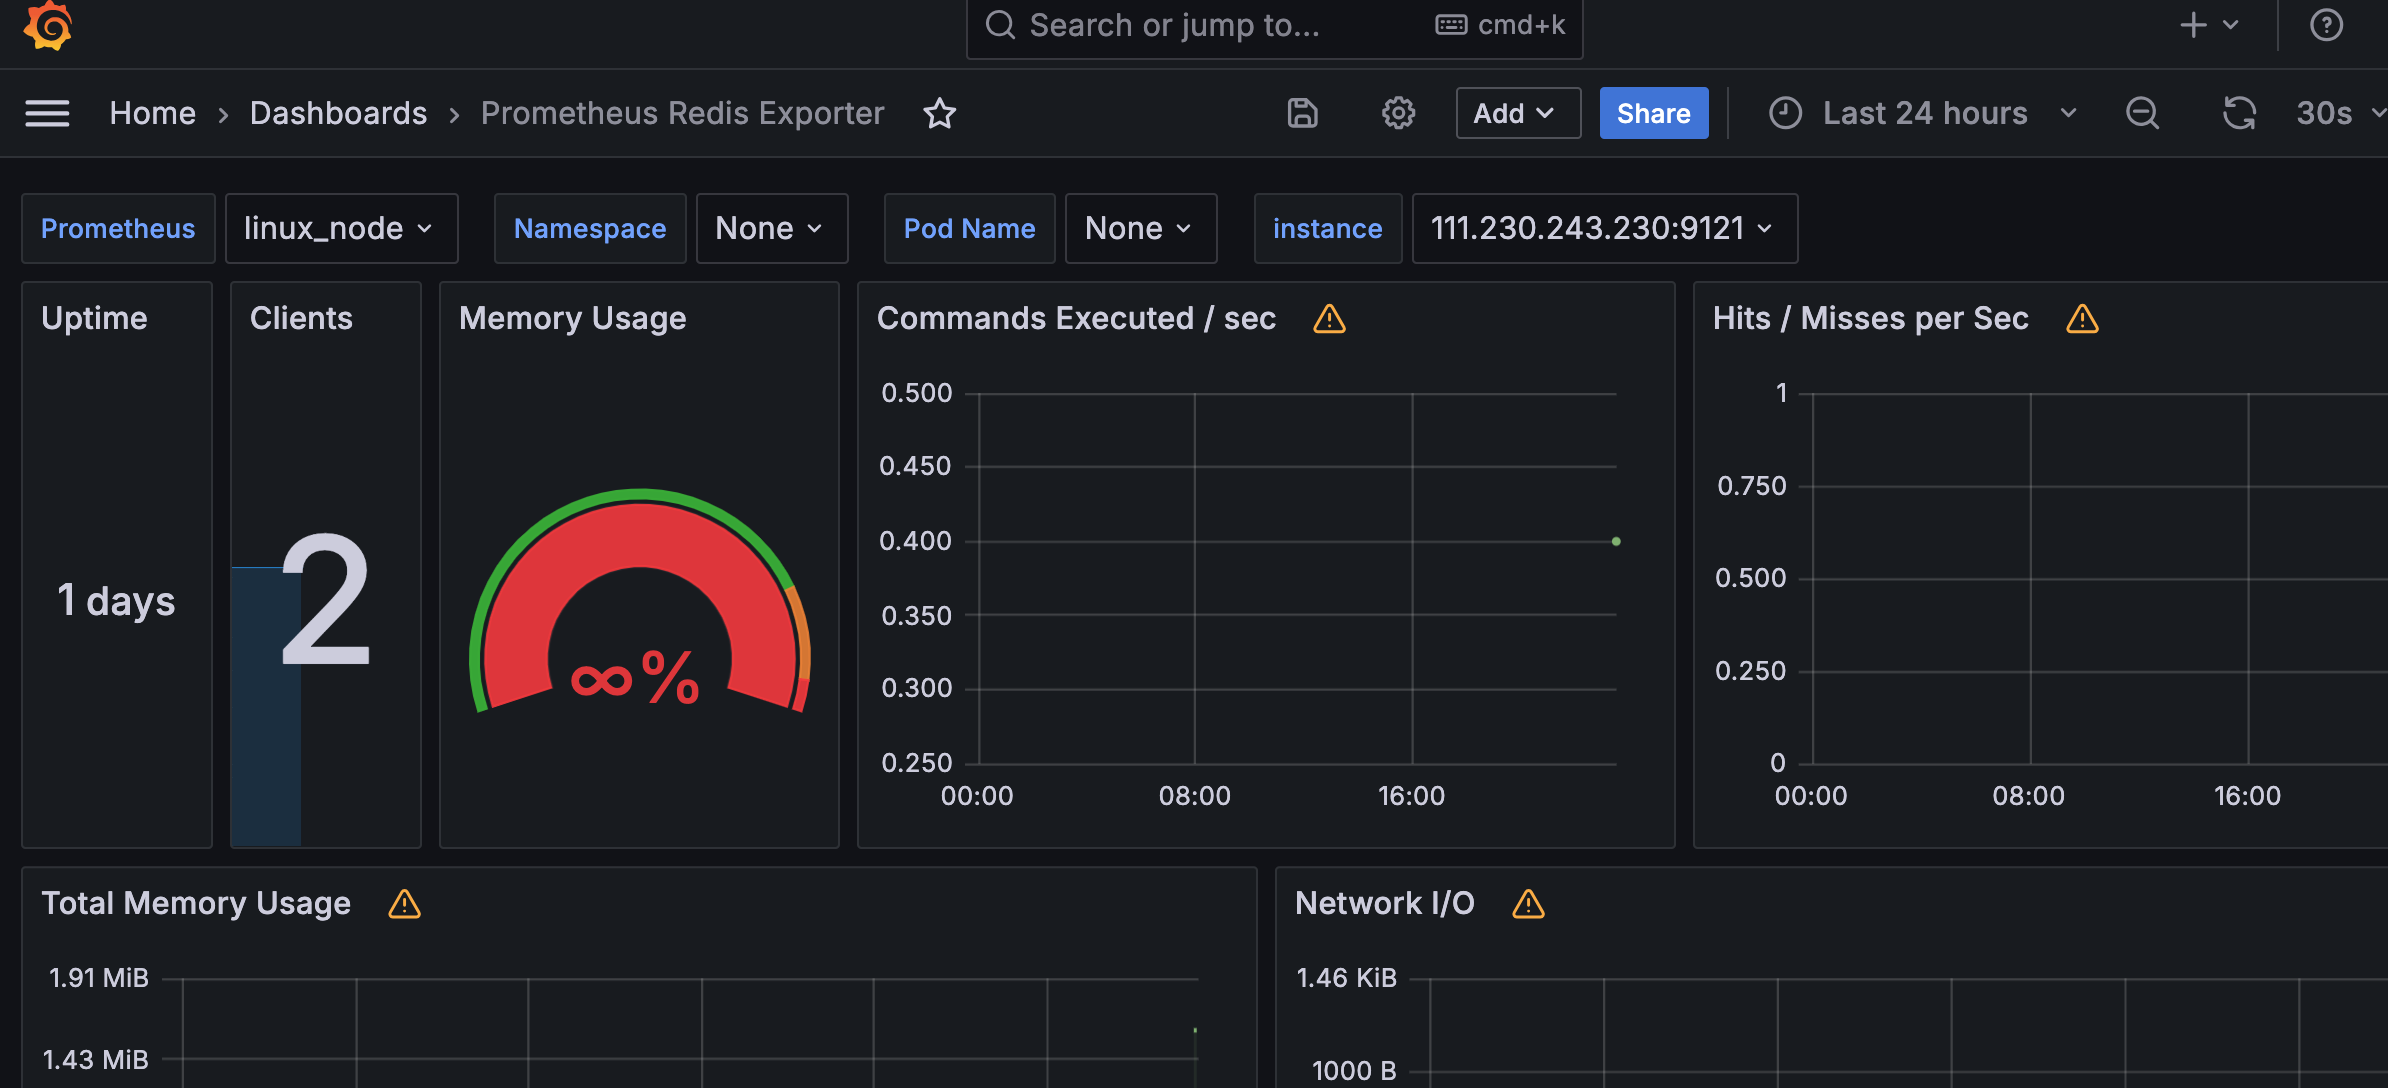
问题:SSH断开与服务器连接后,Prometheus就获取不到redis数据
解决方法:设置为永久启动
nohup ./redis_exporter -redis.addr redis://111.***0:6379 -redis.password a*** --web.listen-address=":9121" > nohup.log 2>&1 &

![[特殊字符] 分布式定时任务调度实战:XXL-JOB工作原理与路由策略详解](https://i-blog.csdnimg.cn/direct/3a638f73130d4e3b9fd8f534993826f2.jpeg)