前边我们已经讲解了使用cv2进行图像预处理与边缘检测等方面的知识,这里我们以答题卡自动批阅这一案例来实操一下。
大致思路
答题卡自动批阅的大致流程可以分为这五步:图像预处理-寻找考试信息区域与涂卡区域-考生信息区域OCR识别-涂卡区域填涂答案判断-图像中标记结果
接下来我们按照这五步来进行讲解。
图像预处理
答题卡获取首先,在网上随便找一张答题卡图片
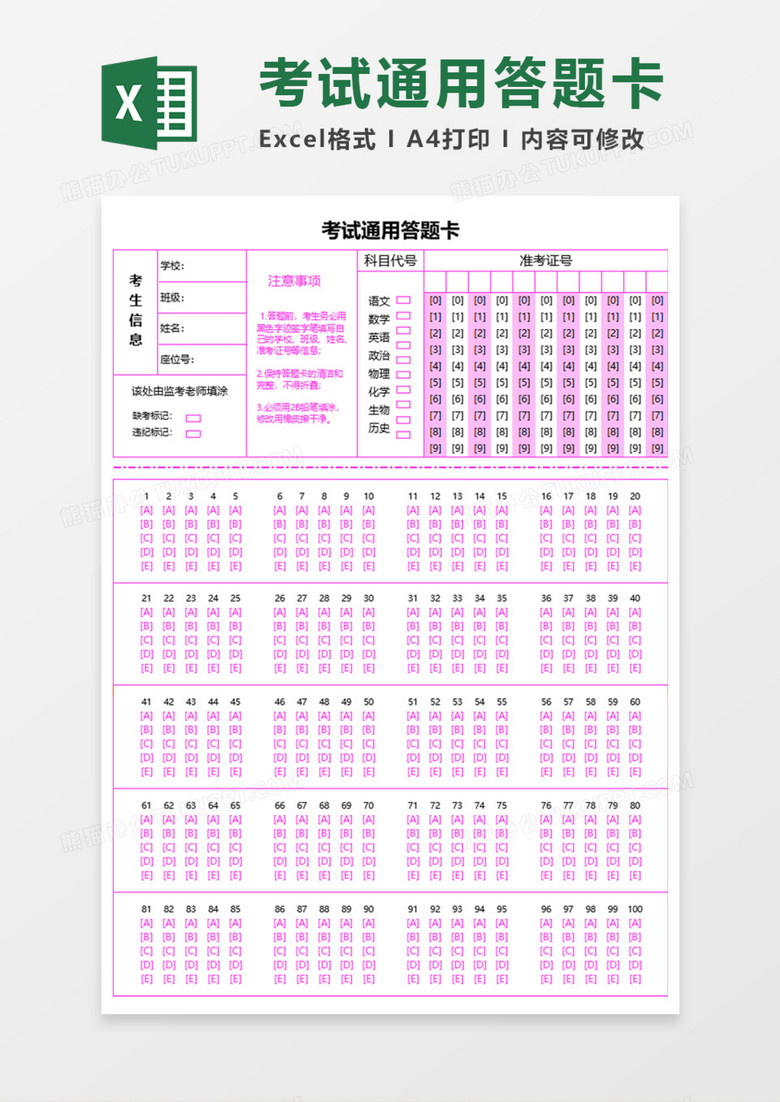
由于这里我只需要考生信息与填途题目,所以只是截取了左上角这一部分作为我们后续的目标。
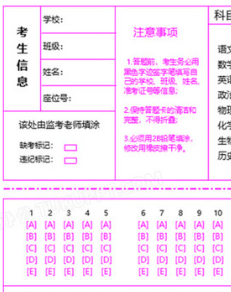
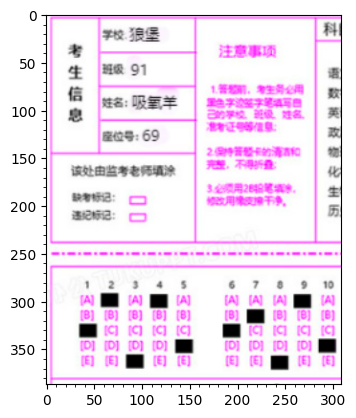
接着,我们使用图像编辑软件将考生信息填入,并将10道题目进行填涂。
读取图像
# #读取答题卡图片
import cv2
import matplotlib.pyplot as plt
src_image=cv2.imread(filename='answercard4.jpg',flags=cv2.IMREAD_COLOR_RGB)
height,width=src_image.shape[:2]
plt.xticks(range(0,width,10),minor=True)
plt.yticks(range(0,height,10),minor=True)
plt.imshow(src_image)
这里我使用matplotlib的imshow函数来显示图像,这样在jupyter环境中可以不打开任何弹窗直接显示图像,比较方便。
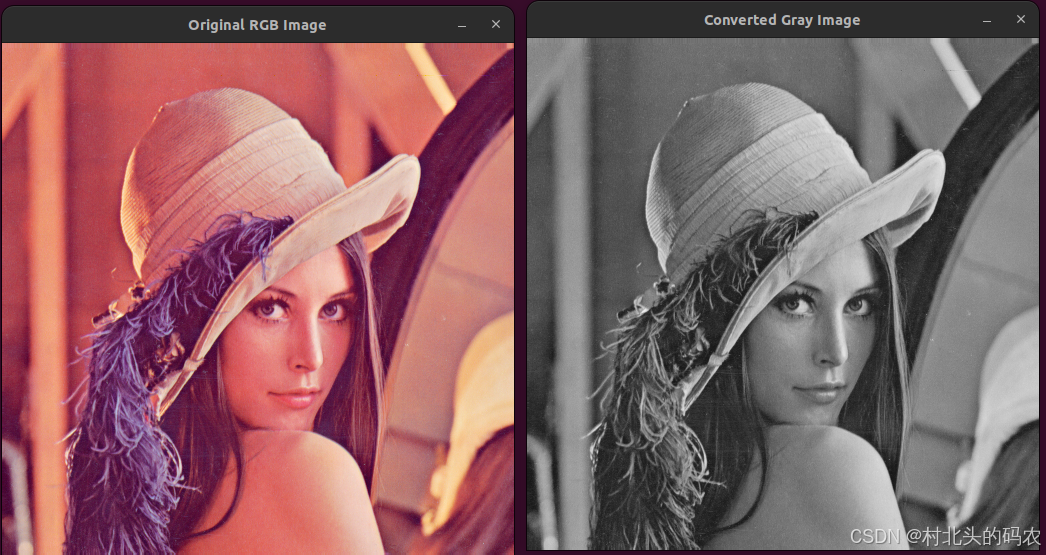
转为灰度图
#转为灰度图
gray_image=cv2.cvtColor(src=src_image,code=cv2.COLOR_RGB2GRAY)
plt.title('原始图像(灰度图)')
plt.imshow(gray_image,cmap='gray')
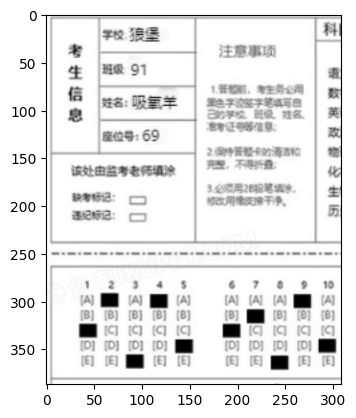
将原始图像转化为灰度图是为了后续的检测等操作,在计算机视觉任务中,基本上所有的操作都是针对灰度图来进行的,灰度图是将原始图像的多个通道按照一定权重求和叠加而来,这样一来多通道变成了单通道(),在计算量上也会比较友好。
阈值化
#阈值化
thresh,binary_image=cv2.threshold(src=gray_image,thresh=128,maxval=255,type=cv2.THRESH_OTSU+cv2.THRESH_BINARY)
plt.imshow(binary_image,cmap='gray')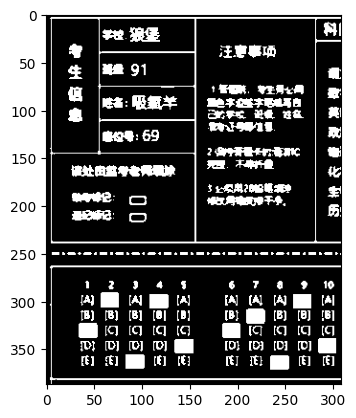
阈值化是为了更好的查找轮廓。这里阈值化我们使用cv2.THRESH+cv2.THRESH-OTSU方法来自动对图像进行二值化阈值分割。
考生信息与答题区域分割
#考生信息区域与答题区域分割
contours,hiercahy=cv2.findContours(binary_image,cv2.RETR_TREE,cv2.CHAIN_APPROX_SIMPLE)
possible_rectangles=[]
answer_rectangle=[]
for points in contours:
    x,y,w,h=cv2.boundingRect(points)
    if 800<w*h<120000:
        possible_rectangles.append((x,y,w,h))
information_rectangles=[rect for rect in possible_rectangles if 100<rect[2]<140 and 30<rect[3]<60]#长在100~~60
answer_rectangle=sorted(possible_rectangles,key=lambda x:x[2]*x[3])[-2]
marked_img=src_image.copy()
information_images=[]
for rect in information_rectangles:
    x, y, w, h,=rect
    cv2.rectangle(marked_img, (x, y), (x+w, y+h), (0, 255, 0), 3)
    information_images.append(marked_img[y:y+h,x:x+w])
x,y,w,h=answer_rectangle
answer_area=marked_img[y:y+h,x:x+w]
answer_area=cv2.cvtColor(src=answer_area,code=cv2.COLOR_RGB2GRAY)
cv2.rectangle(marked_img,(x,y),(x+w,y+h),(255,0,0),3)
plt.xticks(range(0,marked_img.shape[1],10),minor=True)
plt.yticks(range(0,marked_img.shape[0],10),minor=True)
plt.imshow(marked_img)
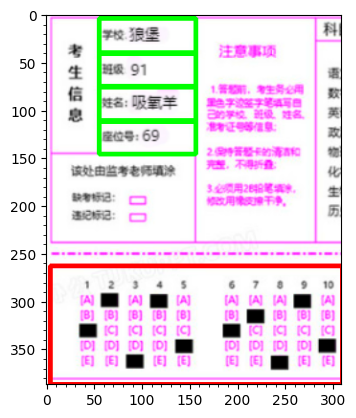
查找轮廓时我们通常使用findContours函数来进行查找(返回值为所有可能的轮廓点contours以及这些点之间的拓扑结构hierachy),考虑到要分割的区域都是矩形,因此我们可以在查找到的轮廓点中使用cv2.boundingrectangle函数来对查找到的轮廓进行矩形拟合。
然后,我们再使用cv2.drawContours函数将其在原始图像中标记出来即可。
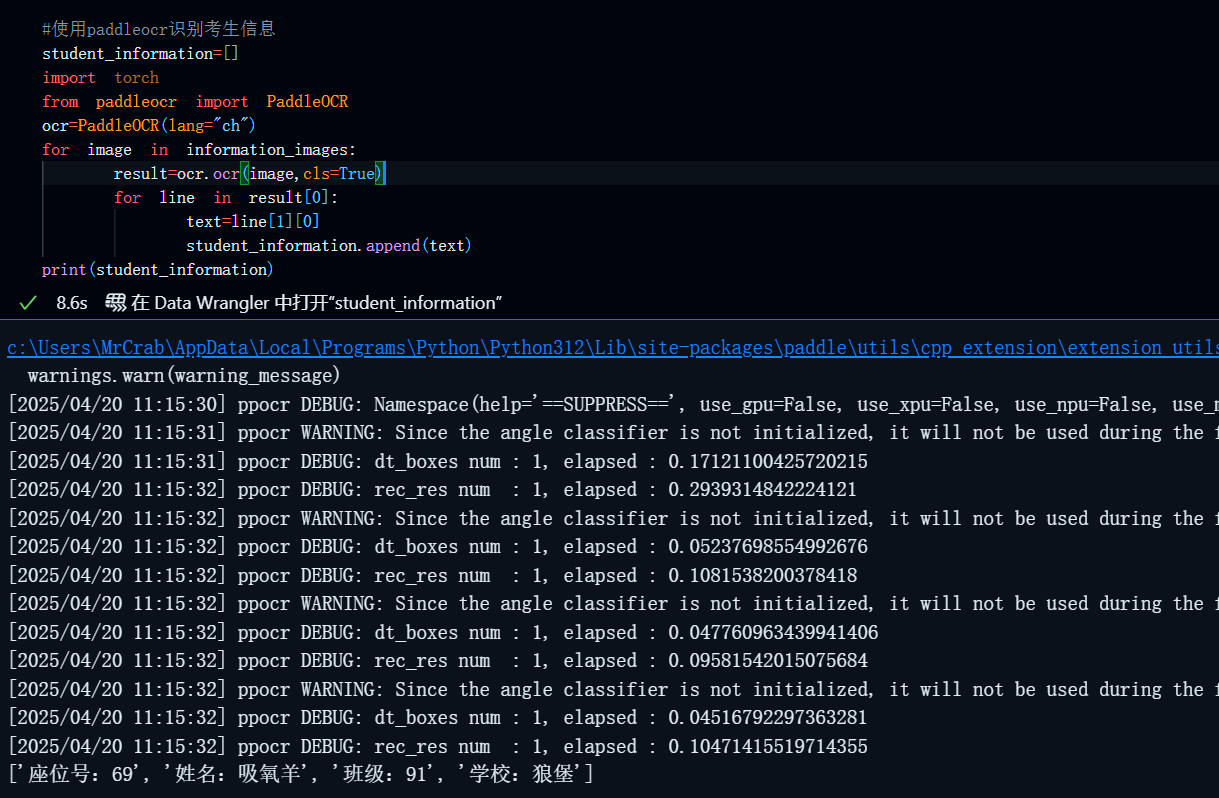
OCR识别
这里我使用现成的OCR字符识别库,这里我使用的是paddleocr
获取方式
pip install paddlepaddle paddleocrOCR识别
#使用paddleocr识别考生信息
student_information=[]
import torch
from paddleocr import PaddleOCR
ocr=PaddleOCR(lang="ch")
for image in information_images:
    result=ocr.ocr(image,cls=True)
    for line in result[0]:
        text=line[1][0]
        student_information.append(text)
print(student_information)
结果:
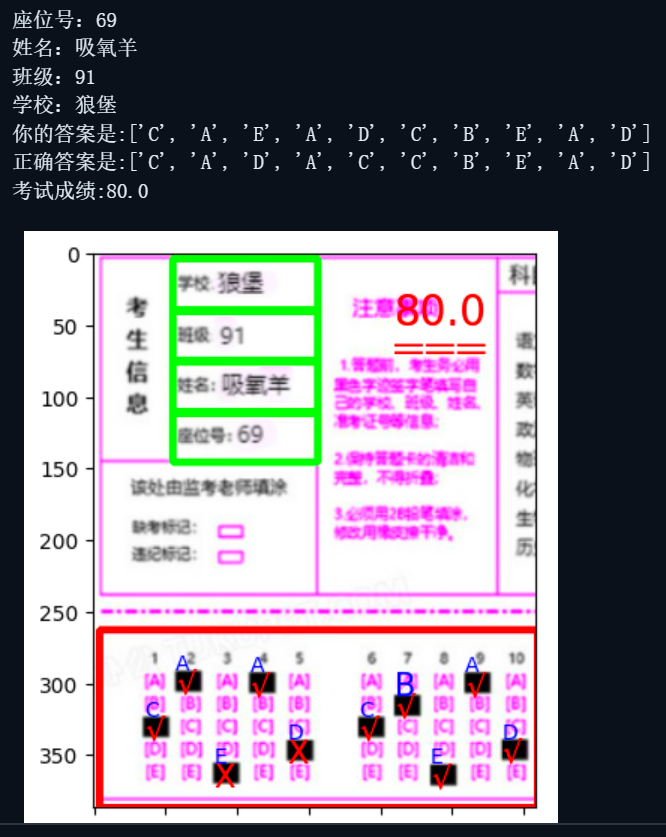
答题区域答案识别
这一步是整个任务的关键,但其实也比较简单,就是按照查找到的填涂过的黑色矩形的位置来判断,首先我们要在这个填涂答案的区域内定位所有黑色矩形的位置以及长和宽,然后根据以下的关系来判断每一列的答案是ABCDE的哪一个,其中filled_area_top是指整个填涂答案中最顶部的位置,即A的位置(我的答案中有A,倘若没有的话,也可以完全根据y坐标自行指定一个ABCDE所在的范围),filled_area_bottom是整个填入答案中最底部的位置,即E的位置。
thresh,binary_answer_area=cv2.threshold(src=answer_area,thresh=128,maxval=255,type=cv2.THRESH_BINARY+cv2.THRESH_OTSU)
contours,hiercahy=cv2.findContours(image=binary_answer_area,mode=cv2.RETR_TREE,method=cv2.CHAIN_APPROX_SIMPLE)
filled_areas=[]
answers=[]
epsilon=5
true_answers=['C','A','D','A','C','C','B','E','A','D']
for points in contours:
    x,y,w,h=cv2.boundingRect(points)
    if 300<w*h<500:
        filled_areas.append((x,y,w,h))
filled_areas=sorted(filled_areas,key=lambda point:point[1])
filled_area_top,filled_area_bottom=filled_areas[0][1],filled_areas[-1][1]
filled_areas=sorted(filled_areas,key=lambda point:point[0])
score=0
total_num=len(filled_areas)
avg_score=100/total_num
plt.imshow(marked_img)
for i in range(len(filled_areas)):
    x,y,w,h=filled_areas[i]
    if 0<=(y-filled_area_top)<=epsilon:
        answers.append('A')
        plt.text(x=x+5,y=y+height-answer_area.shape[0],s='A',color='blue')
        if true_answers[i]==answers[i]:
            plt.text(x=x+5,y=y+h+height-answer_area.shape[0],s='√',color='red',size=15)
            score+=avg_score
        else:
            plt.text(x=x+5,y=y+h+height-answer_area.shape[0],s='X',color='red',size=15)
    if epsilon<abs(y-filled_area_top)<=h+epsilon:
        answers.append('B')
        plt.text(x=x+5,y=y+height-answer_area.shape[0],s='B',color='blue',size=15)
        if true_answers[i]==answers[i]:
            plt.text(x=x+5,y=y+h+height-answer_area.shape[0],s='√',color='red',size=15)
            score+=avg_score
        else:
            plt.text(x=x+5,y=y+h+height-answer_area.shape[0],s='X',color='red',size=15)
    if h+epsilon<abs(y-filled_area_top)<=2*h+epsilon:
        answers.append('C')
        plt.text(x=x+5,y=y+height-answer_area.shape[0],s='C',color='blue')
        if true_answers[i]==answers[i]:
            plt.text(x=x+5,y=y+h+height-answer_area.shape[0],s='√',color='red',size=15)
            score+=avg_score
        else:
            plt.text(x=x+5,y=y+h+height-answer_area.shape[0],s='X',color='red',size=15)
    if 2*h+epsilon<abs(y-filled_area_top)<=3*h+epsilon:
        answers.append('D')
        plt.text(x=x+5,y=y+height-answer_area.shape[0],s='D',color='blue')
        if true_answers[i]==answers[i]:
            plt.text(x=x+5,y=y+h+height-answer_area.shape[0],s='√',color='red',size=15)
            score+=avg_score
        else:
            plt.text(x=x+5,y=y+h+height-answer_area.shape[0],s='X',color='red',size=15)
    if 0<=filled_area_bottom-y<=epsilon:
        answers.append('E')
        plt.text(x=x+5,y=y+height-answer_area.shape[0],s='E',color='blue')
        if true_answers[i]==answers[i]:
            plt.text(x=x+5,y=y+h+height-answer_area.shape[0],s='√',color='red',size=15)
            score+=avg_score
        else:
            plt.text(x=x+5,y=y+h+height-answer_area.shape[0],s='X',color='red',size=15)
plt.text(x=width-100,y=50,s=score,color='red',size='20')
plt.text(x=width-100,y=70,s='———',color='red',size='15')
plt.text(x=width-100,y=75,s='———',color='red',size='15')
for info in student_information:
    print(info)
print(f'你的答案是:{answers}')
print(f'正确答案是:{true_answers}')
print(f'考试成绩:{score}')
结果:
完整代码
# #读取答题卡图片
import cv2
import matplotlib.pyplot as plt
src_image=cv2.imread(filename='answercard4.jpg',flags=cv2.IMREAD_COLOR_RGB)
height,width=src_image.shape[:2]
plt.xticks(range(0,width,10),minor=True)
plt.yticks(range(0,height,10),minor=True)
plt.imshow(src_image)
#转为灰度图
gray_image=cv2.cvtColor(src=src_image,code=cv2.COLOR_RGB2GRAY)
plt.imshow(gray_image,cmap='gray')
thresh,binary_image=cv2.threshold(src=gray_image,thresh=128,maxval=255,type=cv2.THRESH_BINARY_INV+cv2.THRESH_OTSU)
plt.imshow(binary_image,cmap='gray')
#考生信息区域与答题区域分割
contours,hiercahy=cv2.findContours(binary_image,cv2.RETR_TREE,cv2.CHAIN_APPROX_SIMPLE)
possible_rectangles=[]
answer_rectangle=[]
for points in contours:
    x,y,w,h=cv2.boundingRect(points)
    if 800<w*h<120000:
        possible_rectangles.append((x,y,w,h))
information_rectangles=[rect for rect in possible_rectangles if 100<rect[2]<140 and 30<rect[3]<60]#长在100~~60
answer_rectangle=sorted(possible_rectangles,key=lambda x:x[2]*x[3])[-2]
marked_img=src_image.copy()
information_images=[]
for rect in information_rectangles:
    x, y, w, h,=rect
    cv2.rectangle(marked_img, (x, y), (x+w, y+h), (0, 255, 0), 3)
    information_images.append(marked_img[y:y+h,x:x+w])
x,y,w,h=answer_rectangle
answer_area=marked_img[y:y+h,x:x+w]
answer_area=cv2.cvtColor(src=answer_area,code=cv2.COLOR_RGB2GRAY)
cv2.rectangle(marked_img,(x,y),(x+w,y+h),(255,0,0),3)
plt.xticks(range(0,marked_img.shape[1],10),minor=True)
plt.yticks(range(0,marked_img.shape[0],10),minor=True)
plt.imshow(marked_img)
#使用paddleocr识别考生信息
student_information=[]
import torch
from paddleocr import PaddleOCR
ocr=PaddleOCR(lang="ch")
for image in information_images:
    result=ocr.ocr(image,cls=True)
    for line in result[0]:
        text=line[1][0]
        student_information.append(text)
print(student_information)

thresh,binary_answer_area=cv2.threshold(src=answer_area,thresh=128,maxval=255,type=cv2.THRESH_BINARY+cv2.THRESH_OTSU)
contours,hiercahy=cv2.findContours(image=binary_answer_area,mode=cv2.RETR_TREE,method=cv2.CHAIN_APPROX_SIMPLE)
filled_areas=[]
answers=[]
epsilon=5
true_answers=['C','A','D','A','C','C','B','E','A','D']
for points in contours:
    x,y,w,h=cv2.boundingRect(points)
    if 300<w*h<500:
        filled_areas.append((x,y,w,h))
filled_areas=sorted(filled_areas,key=lambda point:point[1])
filled_area_top,filled_area_bottom=filled_areas[0][1],filled_areas[-1][1]
filled_areas=sorted(filled_areas,key=lambda point:point[0])
score=0
total_num=len(filled_areas)
avg_score=100/total_num
plt.imshow(marked_img)
for i in range(len(filled_areas)):
    x,y,w,h=filled_areas[i]
    if 0<=(y-filled_area_top)<=epsilon:
        answers.append('A')
        plt.text(x=x+5,y=y+height-answer_area.shape[0],s='A',color='blue')
        if true_answers[i]==answers[i]:
            plt.text(x=x+5,y=y+h+height-answer_area.shape[0],s='√',color='red',size=15)
            score+=avg_score
        else:
            plt.text(x=x+5,y=y+h+height-answer_area.shape[0],s='X',color='red',size=15)
    if epsilon<abs(y-filled_area_top)<=h+epsilon:
        answers.append('B')
        plt.text(x=x+5,y=y+height-answer_area.shape[0],s='B',color='blue',size=15)
        if true_answers[i]==answers[i]:
            plt.text(x=x+5,y=y+h+height-answer_area.shape[0],s='√',color='red',size=15)
            score+=avg_score
        else:
            plt.text(x=x+5,y=y+h+height-answer_area.shape[0],s='X',color='red',size=15)
    if h+epsilon<abs(y-filled_area_top)<=2*h+epsilon:
        answers.append('C')
        plt.text(x=x+5,y=y+height-answer_area.shape[0],s='C',color='blue')
        if true_answers[i]==answers[i]:
            plt.text(x=x+5,y=y+h+height-answer_area.shape[0],s='√',color='red',size=15)
            score+=avg_score
        else:
            plt.text(x=x+5,y=y+h+height-answer_area.shape[0],s='X',color='red',size=15)
    if 2*h+epsilon<abs(y-filled_area_top)<=3*h+epsilon:
        answers.append('D')
        plt.text(x=x+5,y=y+height-answer_area.shape[0],s='D',color='blue')
        if true_answers[i]==answers[i]:
            plt.text(x=x+5,y=y+h+height-answer_area.shape[0],s='√',color='red',size=15)
            score+=avg_score
        else:
            plt.text(x=x+5,y=y+h+height-answer_area.shape[0],s='X',color='red',size=15)
    if 0<=filled_area_bottom-y<=epsilon:
        answers.append('E')
        plt.text(x=x+5,y=y+height-answer_area.shape[0],s='E',color='blue')
        if true_answers[i]==answers[i]:
            plt.text(x=x+5,y=y+h+height-answer_area.shape[0],s='√',color='red',size=15)
            score+=avg_score
        else:
            plt.text(x=x+5,y=y+h+height-answer_area.shape[0],s='X',color='red',size=15)
plt.text(x=width-100,y=50,s=score,color='red',size='20')
plt.text(x=width-100,y=70,s='———',color='red',size='15')
plt.text(x=width-100,y=75,s='———',color='red',size='15')
for info in student_information:
    print(info)
print(f'你的答案是:{answers}')
print(f'正确答案是:{true_answers}')
print(f'考试成绩:{score}')
总结

以上便是计算机视觉cv2入门之答题卡自动批阅的所有内容,所有代码作者纯手敲无任何AI,如果本文对你有用,还劳驾各位一键三连支持一下博主。