安装 Prometheus + Grafana
docker 编排
  prometheus:
    image: prom/prometheus:v2.40.1
    container_name: prometheus
    ports:
      - "9090:9090"
    volumes:
      - /docker/prometheus/prometheus.yml:/etc/prometheus/prometheus.yml
    network_mode: "host"

  grafana:
    image: grafana/grafana:9.2.4
    container_name: grafana
    environment:
      TZ: Asia/Shanghai
      # 服务地址 用于指定外网ip或域名
      GF_SERVER_ROOT_URL: ""
      # admin 管理员密码
      GF_SECURITY_ADMIN_PASSWORD: 123456
    ports:
      - "3000:3000"
    volumes:
      - /docker/grafana/grafana.ini:/etc/grafana/grafana.ini
      - /docker/grafana:/var/lib/grafana
    network_mode: "host"
配置文件编写
prometheus.yml
# my global config
global:
  scrape_interval:     15s # Set the scrape interval to every 15 seconds. Default is every 1 minute.
  evaluation_interval: 15s # Evaluate rules every 15 seconds. The default is every 1 minute.
  # scrape_timeout is set to the global default (10s).


# A scrape configuration containing exactly one endpoint to scrape:
# Here it's Prometheus itself.
# 需要监控什么 在这里增加即可
scrape_configs:
  - job_name: 'Prometheus'
    static_configs:
      - targets: ['127.0.0.1:9090']
  - job_name: 'Grafana'
    static_configs:
      - targets: ['127.0.0.1:3000']
grafana.ini 官方默认配置 按需更改
内容过多 请查看下方附件
启动 Prometheus 与 Grafana
执行 docker 命令安装启动
docker-compose up -d prometheus grafana
查看 prometheus 控制台
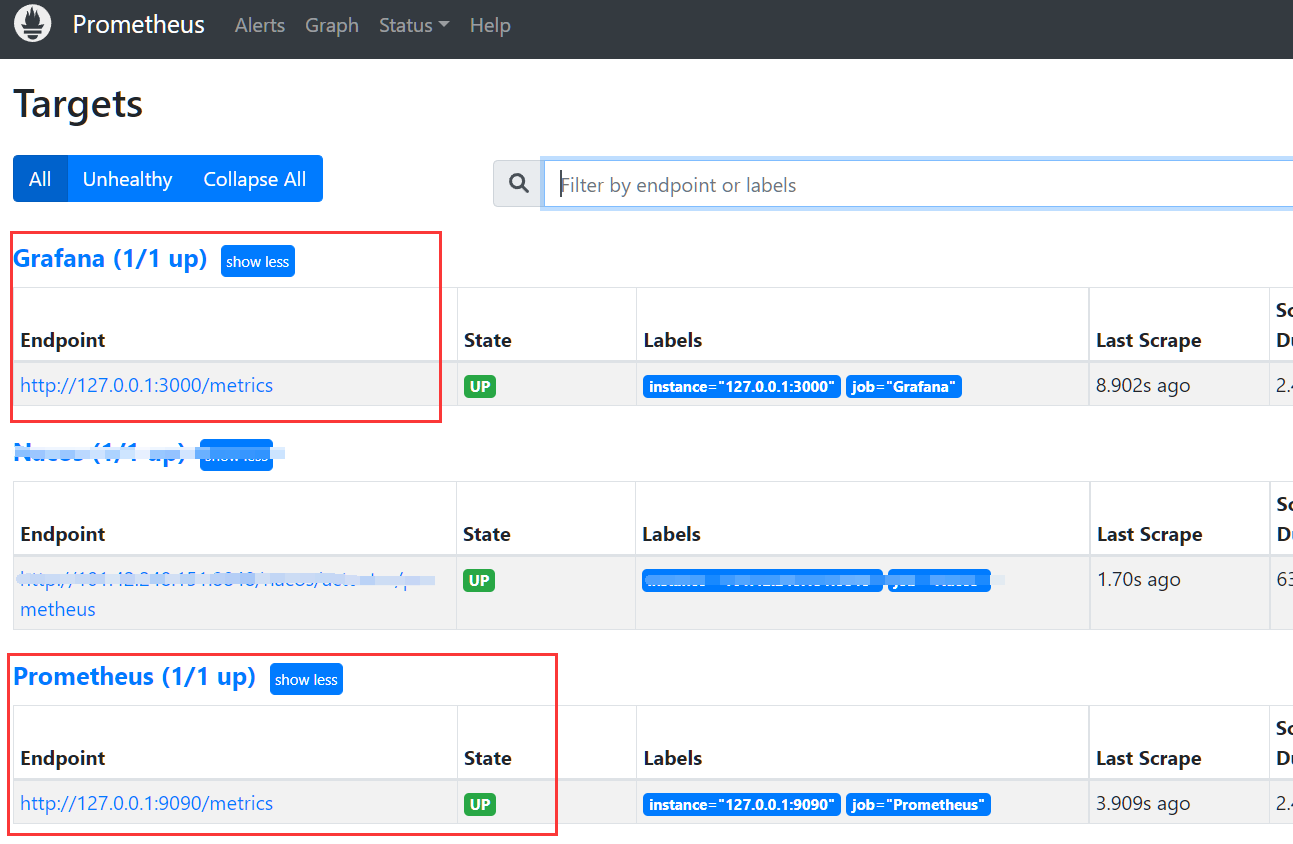
访问 9090 端口进入控制台 找到上方菜单 Status -> Targets
查看我们配置好的数据源节点采集状态

查看 Grafana 控制台
访问 3000 端口输入配置好的账号密码 进入控制台

配置 prometheus 数据源采集
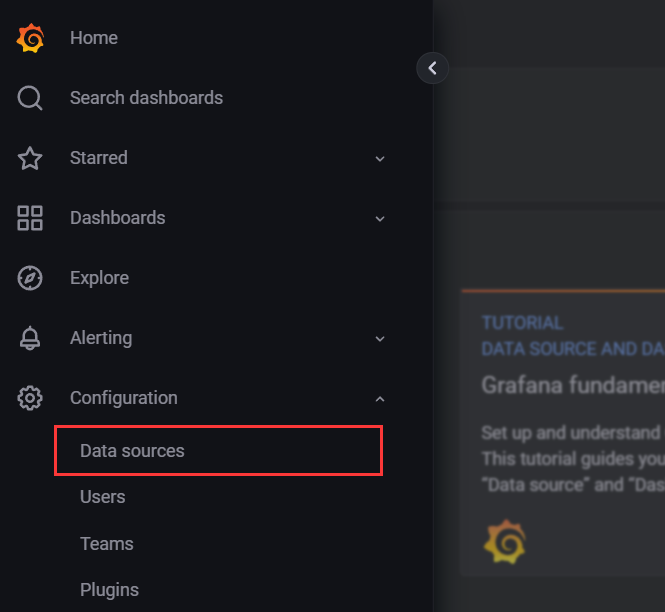
进入右侧菜单 Configuration -> Data Sources
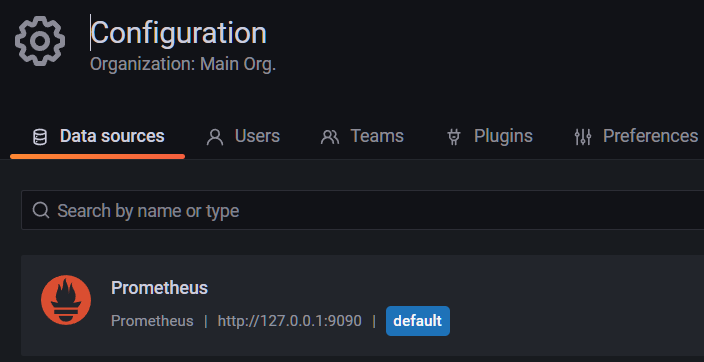
点击右侧 Add data source

选择 prometheus 类型 填写 prometheus 地址与超时时间 然后点击下方保存

配置监控页面
进入 Grafana 官方 监控模板仓库 在这里可以找到各式各样的监控模板
https://grafana.com/grafana/dashboards/
搜索框输入 prometheus 往下翻找到 Prometheus 2.0 Overview 这个模板

点击右侧 copy ID 这里ID为 3662 然后回到 Grafana 控制台
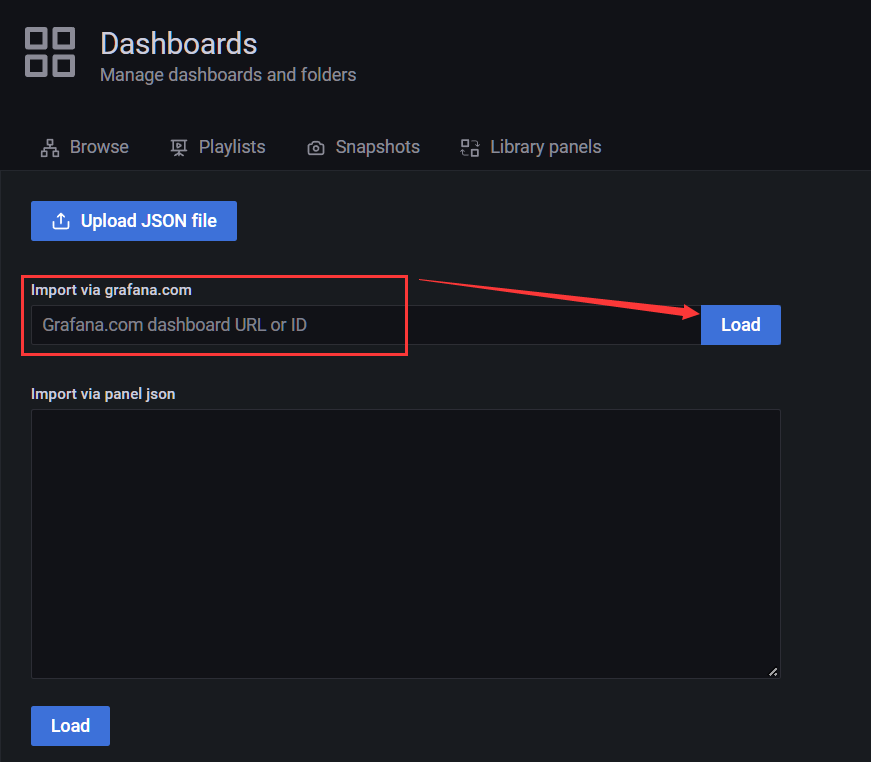
点击右侧菜单 Dashboards -> Import

输入刚才复制的 模板ID 点击 Load 下载模板
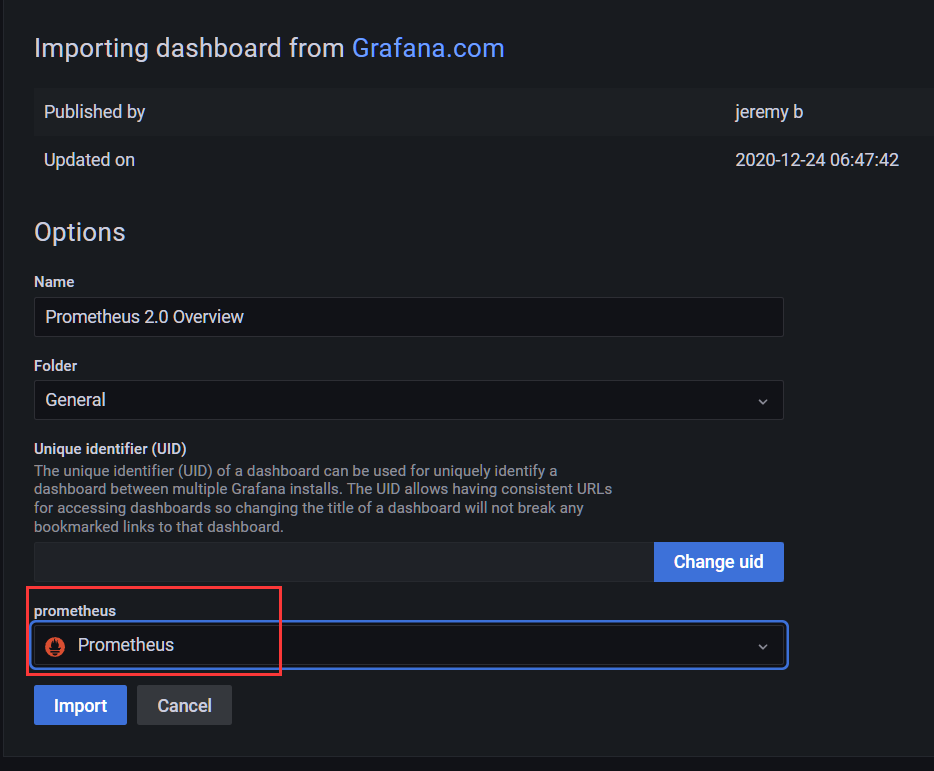
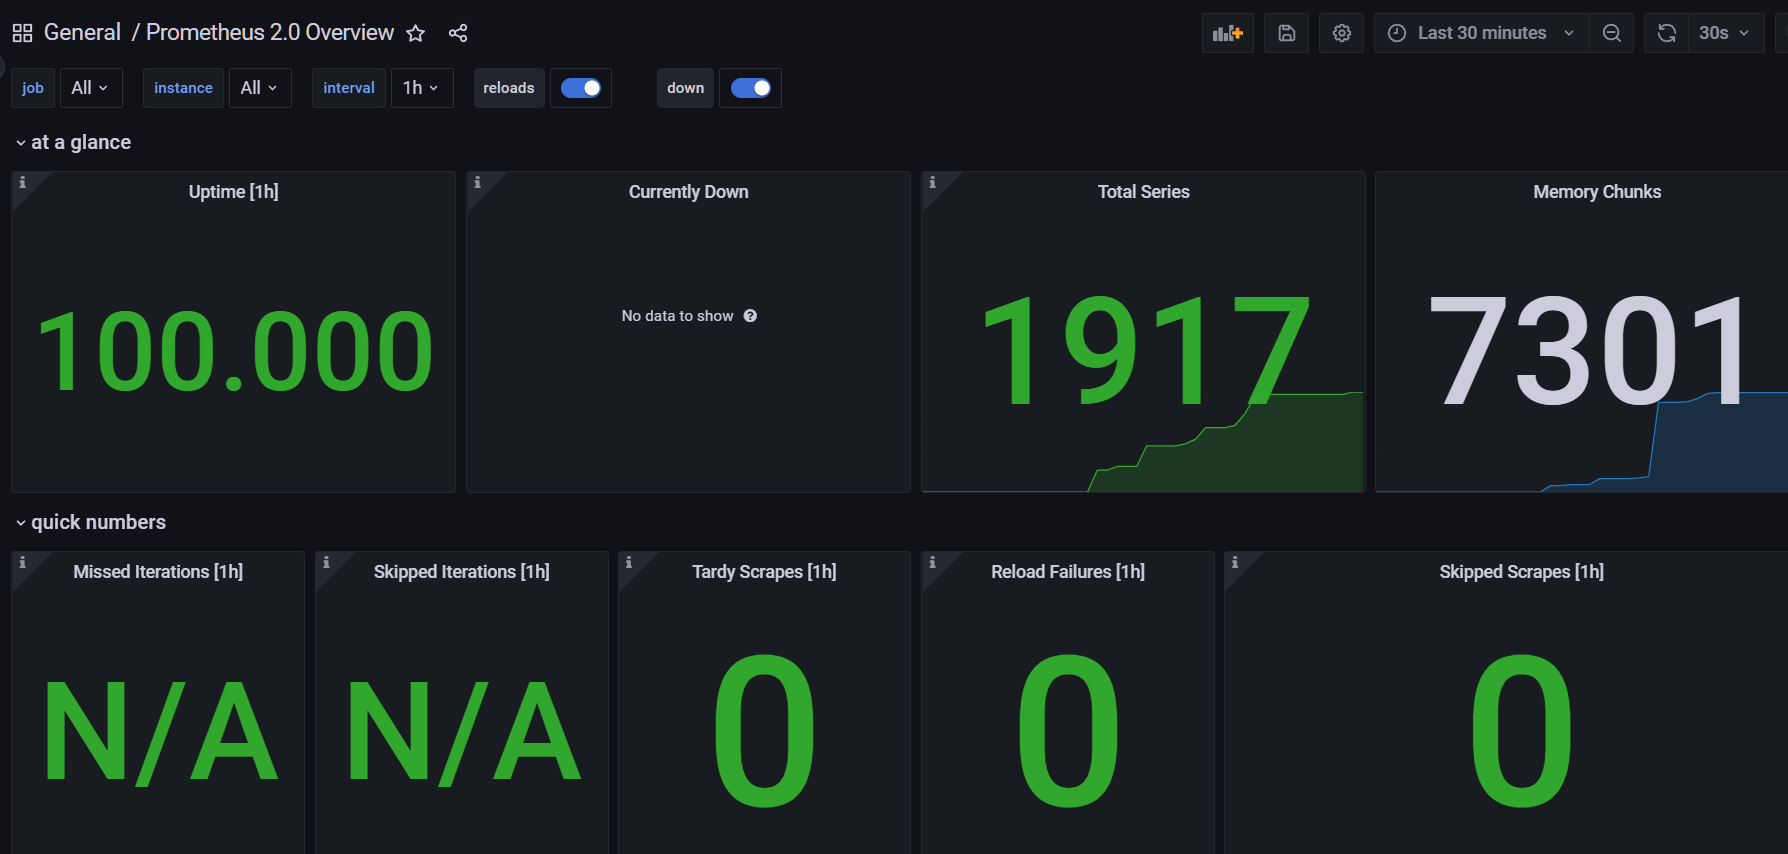
选择我们配置好的 prometheus 数据源 点击下方导入 即可完成模板的配置导入
附件
##################### Grafana Configuration Example #####################
#
# Everything has defaults so you only need to uncomment things you want to
# change

# possible values : production, development
;app_mode = production

# instance name, defaults to HOSTNAME environment variable value or hostname if HOSTNAME var is empty
;instance_name = ${HOSTNAME}

#################################### Paths ####################################
[paths]
# Path to where grafana can store temp files, sessions, and the sqlite3 db (if that is used)
;data = /var/lib/grafana

# Temporary files in `data` directory older than given duration will be removed
;temp_data_lifetime = 24h

# Directory where grafana can store logs
;logs = /var/log/grafana

# Directory where grafana will automatically scan and look for plugins
;plugins = /var/lib/grafana/plugins

# folder that contains provisioning config files that grafana will apply on startup and while running.
;provisioning = conf/provisioning

#################################### Server ####################################
[server]
# Protocol (http, https, h2, socket)
;protocol = http

# The ip address to bind to, empty will bind to all interfaces
;http_addr =

# The http port  to use
;http_port = 3000

# The public facing domain name used to access grafana from a browser
;domain = localhost

# Redirect to correct domain if host header does not match domain
# Prevents DNS rebinding attacks
;enforce_domain = false

# The full public facing url you use in browser, used for redirects and emails
# If you use reverse proxy and sub path specify full url (with sub path)
;root_url = %(protocol)s://%(domain)s:%(http_port)s/

# Serve Grafana from subpath specified in `root_url` setting. By default it is set to `false` for compatibility reasons.
;serve_from_sub_path = false

# Log web requests
;router_logging = false

# the path relative working path
;static_root_path = public

# enable gzip
;enable_gzip = false

# https certs & key file
;cert_file =
;cert_key =

# Unix socket path
;socket =

#################################### Database ####################################
[database]
# You can configure the database connection by specifying type, host, name, user and password
# as separate properties or as on string using the url properties.

# Either "mysql", "postgres" or "sqlite3", it's your choice
;type = sqlite3
;host = 127.0.0.1:3306
;name = grafana
;user = root
# If the password contains # or ; you have to wrap it with triple quotes. Ex """#password;"""
;password =

# Use either URL or the previous fields to configure the database
# Example: mysql://user:secret@host:port/database
;url =

# For "postgres" only, either "disable", "require" or "verify-full"
;ssl_mode = disable

;ca_cert_path =
;client_key_path =
;client_cert_path =
;server_cert_name =

# For "sqlite3" only, path relative to data_path setting
;path = grafana.db

# Max idle conn setting default is 2
;max_idle_conn = 2

# Max conn setting default is 0 (mean not set)
;max_open_conn =

# Connection Max Lifetime default is 14400 (means 14400 seconds or 4 hours)
;conn_max_lifetime = 14400

# Set to true to log the sql calls and execution times.
;log_queries =

# For "sqlite3" only. cache mode setting used for connecting to the database. (private, shared)
;cache_mode = private

#################################### Cache server #############################
[remote_cache]
# Either "redis", "memcached" or "database" default is "database"
;type = database

# cache connectionstring options
# database: will use Grafana primary database.
# redis: config like redis server e.g. `addr=127.0.0.1:6379,pool_size=100,db=0,ssl=false`. Only addr is required. ssl may be 'true', 'false', or 'insecure'.
# memcache: 127.0.0.1:11211
;connstr =

#################################### Data proxy ###########################
[dataproxy]

# This enables data proxy logging, default is false
;logging = false

# How long the data proxy waits before timing out, default is 30 seconds.
# This setting also applies to core backend HTTP data sources where query requests use an HTTP client with timeout set.
;timeout = 30

# How many seconds the data proxy waits before sending a keepalive probe request.
;keep_alive_seconds = 30

# How many seconds the data proxy waits for a successful TLS Handshake before timing out.
;tls_handshake_timeout_seconds = 10

# How many seconds the data proxy will wait for a server's first response headers after
# fully writing the request headers if the request has an "Expect: 100-continue"
# header. A value of 0 will result in the body being sent immediately, without
# waiting for the server to approve.
;expect_continue_timeout_seconds = 1

# The maximum number of idle connections that Grafana will keep alive.
;max_idle_connections = 100

# How many seconds the data proxy keeps an idle connection open before timing out.
;idle_conn_timeout_seconds = 90

# If enabled and user is not anonymous, data proxy will add X-Grafana-User header with username into the request, default is false.
;send_user_header = false

#################################### Analytics ####################################
[analytics]
# Server reporting, sends usage counters to stats.grafana.org every 24 hours.
# No ip addresses are being tracked, only simple counters to track
# running instances, dashboard and error counts. It is very helpful to us.
# Change this option to false to disable reporting.
;reporting_enabled = true

# Set to false to disable all checks to https://grafana.net
# for new versions (grafana itself and plugins), check is used
# in some UI views to notify that grafana or plugin update exists
# This option does not cause any auto updates, nor send any information
# only a GET request to http://grafana.com to get latest versions
;check_for_updates = true

# Google Analytics universal tracking code, only enabled if you specify an id here
;google_analytics_ua_id =

# Google Tag Manager ID, only enabled if you specify an id here
;google_tag_manager_id =

#################################### Security ####################################
[security]
# disable creation of admin user on first start of grafana
;disable_initial_admin_creation = false

# default admin user, created on startup
;admin_user = admin

# default admin password, can be changed before first start of grafana,  or in profile settings
;admin_password = admin

# used for signing
;secret_key = SW2YcwTIb9zpOOhoPsMm

# disable gravatar profile images
;disable_gravatar = false

# data source proxy whitelist (ip_or_domain:port separated by spaces)
;data_source_proxy_whitelist =

# disable protection against brute force login attempts
;disable_brute_force_login_protection = false

# set to true if you host Grafana behind HTTPS. default is false.
;cookie_secure = false

# set cookie SameSite attribute. defaults to `lax`. can be set to "lax", "strict", "none" and "disabled"
;cookie_samesite = lax

# set to true if you want to allow browsers to render Grafana in a <frame>, <iframe>, <embed> or <object>. default is false.
;allow_embedding = false

# Set to true if you want to enable http strict transport security (HSTS) response header.
# This is only sent when HTTPS is enabled in this configuration.
# HSTS tells browsers that the site should only be accessed using HTTPS.
;strict_transport_security = false

# Sets how long a browser should cache HSTS. Only applied if strict_transport_security is enabled.
;strict_transport_security_max_age_seconds = 86400

# Set to true if to enable HSTS preloading option. Only applied if strict_transport_security is enabled.
;strict_transport_security_preload = false

# Set to true if to enable the HSTS includeSubDomains option. Only applied if strict_transport_security is enabled.
;strict_transport_security_subdomains = false

# Set to true to enable the X-Content-Type-Options response header.
# The X-Content-Type-Options response HTTP header is a marker used by the server to indicate that the MIME types advertised
# in the Content-Type headers should not be changed and be followed.
;x_content_type_options = true

# Set to true to enable the X-XSS-Protection header, which tells browsers to stop pages from loading
# when they detect reflected cross-site scripting (XSS) attacks.
;x_xss_protection = true

#################################### Snapshots ###########################
[snapshots]
# snapshot sharing options
;external_enabled = true
;external_snapshot_url = https://snapshots-origin.raintank.io
;external_snapshot_name = Publish to snapshot.raintank.io

# Set to true to enable this Grafana instance act as an external snapshot server and allow unauthenticated requests for
# creating and deleting snapshots.
;public_mode = false

# remove expired snapshot
;snapshot_remove_expired = true

#################################### Dashboards History ##################
[dashboards]
# Number dashboard versions to keep (per dashboard). Default: 20, Minimum: 1
;versions_to_keep = 20

# Minimum dashboard refresh interval. When set, this will restrict users to set the refresh interval of a dashboard lower than given interval. Per default this is 5 seconds.
# The interval string is a possibly signed sequence of decimal numbers, followed by a unit suffix (ms, s, m, h, d), e.g. 30s or 1m.
;min_refresh_interval = 5s

# Path to the default home dashboard. If this value is empty, then Grafana uses StaticRootPath + "dashboards/home.json"
;default_home_dashboard_path =

#################################### Users ###############################
[users]
# disable user signup / registration
;allow_sign_up = true

# Allow non admin users to create organizations
;allow_org_create = true

# Set to true to automatically assign new users to the default organization (id 1)
;auto_assign_org = true

# Set this value to automatically add new users to the provided organization (if auto_assign_org above is set to true)
;auto_assign_org_id = 1

# Default role new users will be automatically assigned (if disabled above is set to true)
;auto_assign_org_role = Viewer

# Require email validation before sign up completes
;verify_email_enabled = false

# Background text for the user field on the login page
;login_hint = email or username
;password_hint = password

# Default UI theme ("dark" or "light")
;default_theme = dark

# External user management, these options affect the organization users view
;external_manage_link_url =
;external_manage_link_name =
;external_manage_info =

# Viewers can edit/inspect dashboard settings in the browser. But not save the dashboard.
;viewers_can_edit = false

# Editors can administrate dashboard, folders and teams they create
;editors_can_admin = false

# The duration in time a user invitation remains valid before expiring. This setting should be expressed as a duration. Examples: 6h (hours), 2d (days), 1w (week). Default is 24h (24 hours). The minimum supported duration is 15m (15 minutes).
;user_invite_max_lifetime_duration = 24h

[auth]
# Login cookie name
;login_cookie_name = grafana_session

# The maximum lifetime (duration) an authenticated user can be inactive before being required to login at next visit. Default is 7 days (7d). This setting should be expressed as a duration, e.g. 5m (minutes), 6h (hours), 10d (days), 2w (weeks), 1M (month). The lifetime resets at each successful token rotation.
;login_maximum_inactive_lifetime_duration =

# The maximum lifetime (duration) an authenticated user can be logged in since login time before being required to login. Default is 30 days (30d). This setting should be expressed as a duration, e.g. 5m (minutes), 6h (hours), 10d (days), 2w (weeks), 1M (month).
;login_maximum_lifetime_duration =

# How often should auth tokens be rotated for authenticated users when being active. The default is each 10 minutes.
;token_rotation_interval_minutes = 10

# Set to true to disable (hide) the login form, useful if you use OAuth, defaults to false
;disable_login_form = false

# Set to true to disable the signout link in the side menu. useful if you use auth.proxy, defaults to false
;disable_signout_menu = false

# URL to redirect the user to after sign out
;signout_redirect_url =

# Set to true to attempt login with OAuth automatically, skipping the login screen.
# This setting is ignored if multiple OAuth providers are configured.
;oauth_auto_login = false

# OAuth state max age cookie duration in seconds. Defaults to 600 seconds.
;oauth_state_cookie_max_age = 600

# limit of api_key seconds to live before expiration
;api_key_max_seconds_to_live = -1

# Set to true to enable SigV4 authentication option for HTTP-based datasources.
;sigv4_auth_enabled = false

#################################### Anonymous Auth ######################
[auth.anonymous]
# enable anonymous access
;enabled = false

# specify organization name that should be used for unauthenticated users
;org_name = Main Org.

# specify role for unauthenticated users
;org_role = Viewer

# mask the Grafana version number for unauthenticated users
;hide_version = false

#################################### GitHub Auth ##########################
[auth.github]
;enabled = false
;allow_sign_up = true
;client_id = some_id
;client_secret = some_secret
;scopes = user:email,read:org
;auth_url = https://github.com/login/oauth/authorize
;token_url = https://github.com/login/oauth/access_token
;api_url = https://api.github.com/user
;allowed_domains =
;team_ids =
;allowed_organizations =

#################################### GitLab Auth #########################
[auth.gitlab]
;enabled = false
;allow_sign_up = true
;client_id = some_id
;client_secret = some_secret
;scopes = api
;auth_url = https://gitlab.com/oauth/authorize
;token_url = https://gitlab.com/oauth/token
;api_url = https://gitlab.com/api/v4
;allowed_domains =
;allowed_groups =

#################################### Google Auth ##########################
[auth.google]
;enabled = false
;allow_sign_up = true
;client_id = some_client_id
;client_secret = some_client_secret
;scopes = https://www.googleapis.com/auth/userinfo.profile https://www.googleapis.com/auth/userinfo.email
;auth_url = https://accounts.google.com/o/oauth2/auth
;token_url = https://accounts.google.com/o/oauth2/token
;api_url = https://www.googleapis.com/oauth2/v1/userinfo
;allowed_domains =
;hosted_domain =

#################################### Grafana.com Auth ####################
[auth.grafana_com]
;enabled = false
;allow_sign_up = true
;client_id = some_id
;client_secret = some_secret
;scopes = user:email
;allowed_organizations =

#################################### Azure AD OAuth #######################
[auth.azuread]
;name = Azure AD
;enabled = false
;allow_sign_up = true
;client_id = some_client_id
;client_secret = some_client_secret
;scopes = openid email profile
;auth_url = https://login.microsoftonline.com/<tenant-id>/oauth2/v2.0/authorize
;token_url = https://login.microsoftonline.com/<tenant-id>/oauth2/v2.0/token
;allowed_domains =
;allowed_groups =

#################################### Okta OAuth #######################
[auth.okta]
;name = Okta
;enabled = false
;allow_sign_up = true
;client_id = some_id
;client_secret = some_secret
;scopes = openid profile email groups
;auth_url = https://<tenant-id>.okta.com/oauth2/v1/authorize
;token_url = https://<tenant-id>.okta.com/oauth2/v1/token
;api_url = https://<tenant-id>.okta.com/oauth2/v1/userinfo
;allowed_domains =
;allowed_groups =
;role_attribute_path =

#################################### Generic OAuth ##########################
[auth.generic_oauth]
;enabled = false
;name = OAuth
;allow_sign_up = true
;client_id = some_id
;client_secret = some_secret
;scopes = user:email,read:org
;email_attribute_name = email:primary
;email_attribute_path =
;login_attribute_path =
;id_token_attribute_name =
;auth_url = https://foo.bar/login/oauth/authorize
;token_url = https://foo.bar/login/oauth/access_token
;api_url = https://foo.bar/user
;allowed_domains =
;team_ids =
;allowed_organizations =
;role_attribute_path =
;tls_skip_verify_insecure = false
;tls_client_cert =
;tls_client_key =
;tls_client_ca =

#################################### Basic Auth ##########################
[auth.basic]
;enabled = true

#################################### Auth Proxy ##########################
[auth.proxy]
;enabled = false
;header_name = X-WEBAUTH-USER
;header_property = username
;auto_sign_up = true
;sync_ttl = 60
;whitelist = 192.168.1.1, 192.168.2.1
;headers = Email:X-User-Email, Name:X-User-Name
# Read the auth proxy docs for details on what the setting below enables
;enable_login_token = false

#################################### Auth LDAP ##########################
[auth.ldap]
;enabled = false
;config_file = /etc/grafana/ldap.toml
;allow_sign_up = true

# LDAP backround sync (Enterprise only)
# At 1 am every day
;sync_cron = "0 0 1 * * *"
;active_sync_enabled = true

#################################### SMTP / Emailing ##########################
[smtp]
;enabled = false
;host = localhost:25
;user =
# If the password contains # or ; you have to wrap it with triple quotes. Ex """#password;"""
;password =
;cert_file =
;key_file =
;skip_verify = false
;from_address = admin@grafana.localhost
;from_name = Grafana
# EHLO identity in SMTP dialog (defaults to instance_name)
;ehlo_identity = dashboard.example.com
# SMTP startTLS policy (defaults to 'OpportunisticStartTLS')
;startTLS_policy = NoStartTLS

[emails]
;welcome_email_on_sign_up = false
;templates_pattern = emails/*.html

#################################### Logging ##########################
[log]
# Either "console", "file", "syslog". Default is console and  file
# Use space to separate multiple modes, e.g. "console file"
;mode = console file

# Either "debug", "info", "warn", "error", "critical", default is "info"
;level = info

# optional settings to set different levels for specific loggers. Ex filters = sqlstore:debug
;filters =

# For "console" mode only
[log.console]
;level =

# log line format, valid options are text, console and json
;format = console

# For "file" mode only
[log.file]
;level =

# log line format, valid options are text, console and json
;format = text

# This enables automated log rotate(switch of following options), default is true
;log_rotate = true

# Max line number of single file, default is 1000000
;max_lines = 1000000

# Max size shift of single file, default is 28 means 1 << 28, 256MB
;max_size_shift = 28

# Segment log daily, default is true
;daily_rotate = true

# Expired days of log file(delete after max days), default is 7
;max_days = 7

[log.syslog]
;level =

# log line format, valid options are text, console and json
;format = text

# Syslog network type and address. This can be udp, tcp, or unix. If left blank, the default unix endpoints will be used.
;network =
;address =

# Syslog facility. user, daemon and local0 through local7 are valid.
;facility =

# Syslog tag. By default, the process' argv[0] is used.
;tag =

#################################### Usage Quotas ########################
[quota]
; enabled = false

#### set quotas to -1 to make unlimited. ####
# limit number of users per Org.
; org_user = 10

# limit number of dashboards per Org.
; org_dashboard = 100

# limit number of data_sources per Org.
; org_data_source = 10

# limit number of api_keys per Org.
; org_api_key = 10

# limit number of orgs a user can create.
; user_org = 10

# Global limit of users.
; global_user = -1

# global limit of orgs.
; global_org = -1

# global limit of dashboards
; global_dashboard = -1

# global limit of api_keys
; global_api_key = -1

# global limit on number of logged in users.
; global_session = -1

#################################### Alerting ############################
[alerting]
# Disable alerting engine & UI features
;enabled = true
# Makes it possible to turn off alert rule execution but alerting UI is visible
;execute_alerts = true

# Default setting for new alert rules. Defaults to categorize error and timeouts as alerting. (alerting, keep_state)
;error_or_timeout = alerting

# Default setting for how Grafana handles nodata or null values in alerting. (alerting, no_data, keep_state, ok)
;nodata_or_nullvalues = no_data

# Alert notifications can include images, but rendering many images at the same time can overload the server
# This limit will protect the server from render overloading and make sure notifications are sent out quickly
;concurrent_render_limit = 5


# Default setting for alert calculation timeout. Default value is 30
;evaluation_timeout_seconds = 30

# Default setting for alert notification timeout. Default value is 30
;notification_timeout_seconds = 30

# Default setting for max attempts to sending alert notifications. Default value is 3
;max_attempts = 3

# Makes it possible to enforce a minimal interval between evaluations, to reduce load on the backend
;min_interval_seconds = 1

# Configures for how long alert annotations are stored. Default is 0, which keeps them forever.
# This setting should be expressed as a duration. Examples: 6h (hours), 10d (days), 2w (weeks), 1M (month).
;max_annotation_age =

# Configures max number of alert annotations that Grafana stores. Default value is 0, which keeps all alert annotations.
;max_annotations_to_keep =

#################################### Annotations #########################

[annotations.dashboard]
# Dashboard annotations means that annotations are associated with the dashboard they are created on.

# Configures how long dashboard annotations are stored. Default is 0, which keeps them forever.
# This setting should be expressed as a duration. Examples: 6h (hours), 10d (days), 2w (weeks), 1M (month).
;max_age =

# Configures max number of dashboard annotations that Grafana stores. Default value is 0, which keeps all dashboard annotations.
;max_annotations_to_keep =

[annotations.api]
# API annotations means that the annotations have been created using the API without any
# association with a dashboard.

# Configures how long Grafana stores API annotations. Default is 0, which keeps them forever.
# This setting should be expressed as a duration. Examples: 6h (hours), 10d (days), 2w (weeks), 1M (month).
;max_age =

# Configures max number of API annotations that Grafana keeps. Default value is 0, which keeps all API annotations.
;max_annotations_to_keep =

#################################### Explore #############################
[explore]
# Enable the Explore section
;enabled = true

#################################### Internal Grafana Metrics ##########################
# Metrics available at HTTP API Url /metrics
[metrics]
# Disable / Enable internal metrics
;enabled           = true
# Graphite Publish interval
;interval_seconds  = 10
# Disable total stats (stat_totals_*) metrics to be generated
;disable_total_stats = false

#If both are set, basic auth will be required for the metrics endpoint.
; basic_auth_username =
; basic_auth_password =

# Metrics environment info adds dimensions to the `grafana_environment_info` metric, which
# can expose more information about the Grafana instance.
[metrics.environment_info]
#exampleLabel1 = exampleValue1
#exampleLabel2 = exampleValue2

# Send internal metrics to Graphite
[metrics.graphite]
# Enable by setting the address setting (ex localhost:2003)
;address =
;prefix = prod.grafana.%(instance_name)s.

#################################### Grafana.com integration  ##########################
# Url used to import dashboards directly from Grafana.com
[grafana_com]
;url = https://grafana.com

#################################### Distributed tracing ############
[tracing.jaeger]
# Enable by setting the address sending traces to jaeger (ex localhost:6831)
;address = localhost:6831
# Tag that will always be included in when creating new spans. ex (tag1:value1,tag2:value2)
;always_included_tag = tag1:value1
# Type specifies the type of the sampler: const, probabilistic, rateLimiting, or remote
;sampler_type = const
# jaeger samplerconfig param
# for "const" sampler, 0 or 1 for always false/true respectively
# for "probabilistic" sampler, a probability between 0 and 1
# for "rateLimiting" sampler, the number of spans per second
# for "remote" sampler, param is the same as for "probabilistic"
# and indicates the initial sampling rate before the actual one
# is received from the mothership
;sampler_param = 1
# sampling_server_url is the URL of a sampling manager providing a sampling strategy.
;sampling_server_url =
# Whether or not to use Zipkin propagation (x-b3- HTTP headers).
;zipkin_propagation = false
# Setting this to true disables shared RPC spans.
# Not disabling is the most common setting when using Zipkin elsewhere in your infrastructure.
;disable_shared_zipkin_spans = false

#################################### External image storage ##########################
[external_image_storage]
# Used for uploading images to public servers so they can be included in slack/email messages.
# you can choose between (s3, webdav, gcs, azure_blob, local)
;provider =

[external_image_storage.s3]
;endpoint =
;path_style_access =
;bucket =
;region =
;path =
;access_key =
;secret_key =

[external_image_storage.webdav]
;url =
;public_url =
;username =
;password =

[external_image_storage.gcs]
;key_file =
;bucket =
;path =

[external_image_storage.azure_blob]
;account_name =
;account_key =
;container_name =

[external_image_storage.local]
# does not require any configuration

[rendering]
# Options to configure a remote HTTP image rendering service, e.g. using https://github.com/grafana/grafana-image-renderer.
# URL to a remote HTTP image renderer service, e.g. http://localhost:8081/render, will enable Grafana to render panels and dashboards to PNG-images using HTTP requests to an external service.
;server_url =
# If the remote HTTP image renderer service runs on a different server than the Grafana server you may have to configure this to a URL where Grafana is reachable, e.g. http://grafana.domain/.
;callback_url =
# Concurrent render request limit affects when the /render HTTP endpoint is used. Rendering many images at the same time can overload the server,
# which this setting can help protect against by only allowing a certain amount of concurrent requests.
;concurrent_render_request_limit = 30

[panels]
# If set to true Grafana will allow script tags in text panels. Not recommended as it enable XSS vulnerabilities.
;disable_sanitize_html = false

[plugins]
;enable_alpha = false
;app_tls_skip_verify_insecure = false
# Enter a comma-separated list of plugin identifiers to identify plugins that are allowed to be loaded even if they lack a valid signature.
;allow_loading_unsigned_plugins =
;marketplace_url = https://grafana.com/grafana/plugins/

#################################### Grafana Image Renderer Plugin ##########################
[plugin.grafana-image-renderer]
# Instruct headless browser instance to use a default timezone when not provided by Grafana, e.g. when rendering panel image of alert.
# See ICU’s metaZones.txt (https://cs.chromium.org/chromium/src/third_party/icu/source/data/misc/metaZones.txt) for a list of supported
# timezone IDs. Fallbacks to TZ environment variable if not set.
;rendering_timezone =

# Instruct headless browser instance to use a default language when not provided by Grafana, e.g. when rendering panel image of alert.
# Please refer to the HTTP header Accept-Language to understand how to format this value, e.g. 'fr-CH, fr;q=0.9, en;q=0.8, de;q=0.7, *;q=0.5'.
;rendering_language =

# Instruct headless browser instance to use a default device scale factor when not provided by Grafana, e.g. when rendering panel image of alert.
# Default is 1. Using a higher value will produce more detailed images (higher DPI), but will require more disk space to store an image.
;rendering_viewport_device_scale_factor =

# Instruct headless browser instance whether to ignore HTTPS errors during navigation. Per default HTTPS errors are not ignored. Due to
# the security risk it's not recommended to ignore HTTPS errors.
;rendering_ignore_https_errors =

# Instruct headless browser instance whether to capture and log verbose information when rendering an image. Default is false and will
# only capture and log error messages. When enabled, debug messages are captured and logged as well.
# For the verbose information to be included in the Grafana server log you have to adjust the rendering log level to debug, configure
# [log].filter = rendering:debug.
;rendering_verbose_logging =

# Instruct headless browser instance whether to output its debug and error messages into running process of remote rendering service.
# Default is false. This can be useful to enable (true) when troubleshooting.
;rendering_dumpio =

# Additional arguments to pass to the headless browser instance. Default is --no-sandbox. The list of Chromium flags can be found
# here (https://peter.sh/experiments/chromium-command-line-switches/). Multiple arguments is separated with comma-character.
;rendering_args =

# You can configure the plugin to use a different browser binary instead of the pre-packaged version of Chromium.
# Please note that this is not recommended, since you may encounter problems if the installed version of Chrome/Chromium is not
# compatible with the plugin.
;rendering_chrome_bin =

# Instruct how headless browser instances are created. Default is 'default' and will create a new browser instance on each request.
# Mode 'clustered' will make sure that only a maximum of browsers/incognito pages can execute concurrently.
# Mode 'reusable' will have one browser instance and will create a new incognito page on each request.
;rendering_mode =

# When rendering_mode = clustered you can instruct how many browsers or incognito pages can execute concurrently. Default is 'browser'
# and will cluster using browser instances.
# Mode 'context' will cluster using incognito pages.
;rendering_clustering_mode =
# When rendering_mode = clustered you can define maximum number of browser instances/incognito pages that can execute concurrently..
;rendering_clustering_max_concurrency =

# Limit the maximum viewport width, height and device scale factor that can be requested.
;rendering_viewport_max_width =
;rendering_viewport_max_height =
;rendering_viewport_max_device_scale_factor =

# Change the listening host and port of the gRPC server. Default host is 127.0.0.1 and default port is 0 and will automatically assign
# a port not in use.
;grpc_host =
;grpc_port =

[enterprise]
# Path to a valid Grafana Enterprise license.jwt file
;license_path =

[feature_toggles]
# enable features, separated by spaces
;enable =

[date_formats]
# For information on what formatting patterns that are supported https://momentjs.com/docs/#/displaying/

# Default system date format used in time range picker and other places where full time is displayed
;full_date = YYYY-MM-DD HH:mm:ss

# Used by graph and other places where we only show small intervals
;interval_second = HH:mm:ss
;interval_minute = HH:mm
;interval_hour = MM/DD HH:mm
;interval_day = MM/DD
;interval_month = YYYY-MM
;interval_year = YYYY

# Experimental feature
;use_browser_locale = false

# Default timezone for user preferences. Options are 'browser' for the browser local timezone or a timezone name from IANA Time Zone database, e.g. 'UTC' or 'Europe/Amsterdam' etc.
;default_timezone = browser




![[附源码]java毕业设计文具销售系统](https://img-blog.csdnimg.cn/488a962c859d4eeb915dbf6606edf4d8.png)

