import re
import numpy as np
import matplotlib.pyplot as plt
from matplotlib.font_manager import FontProperties
font_path = '/usr/local/sunlogin/res/font/wqy-zenhei.ttc'
my_font = FontProperties(fname=font_path)
log_file_path = 'number.txt'
output_file_path = 'backward_point_cloud_stats.txt'
pattern = re.compile(r'\[(\d+) 3 \d+\]')
backward_point_cloud_counts = []
with open(log_file_path, 'r') as file:
for line in file:
matches = pattern.findall(line)
if matches:
backward_point_cloud_counts.extend([int(count) for count in matches])
if backward_point_cloud_counts:
print(f"成功提取到 {len(backward_point_cloud_counts)} 个后向点云数量。")
else:
print("没有找到后向点云的相关数据。")
max_value = np.max(backward_point_cloud_counts)
min_value = np.min(backward_point_cloud_counts)
mean_value = np.mean(backward_point_cloud_counts)
variance_value = np.var(backward_point_cloud_counts)
lower_percentile = np.percentile(backward_point_cloud_counts, 5)
upper_percentile = np.percentile(backward_point_cloud_counts, 95)
print(f"最大值: {max_value}")
print(f"最小值: {min_value}")
print(f"平均值: {mean_value}")
print(f"方差: {variance_value}")
print(f"90%的数据位于区间 [{lower_percentile}, {upper_percentile}] 之间")
with open(output_file_path, 'w') as output_file:
output_file.write("后向点云数量统计结果:\n")
output_file.write(f"最大值: {max_value}\n")
output_file.write(f"最小值: {min_value}\n")
output_file.write(f"平均值: {mean_value}\n")
output_file.write(f"方差: {variance_value}\n")
output_file.write(f"90%的数据位于区间 [{lower_percentile}, {upper_percentile}] 之间\n")
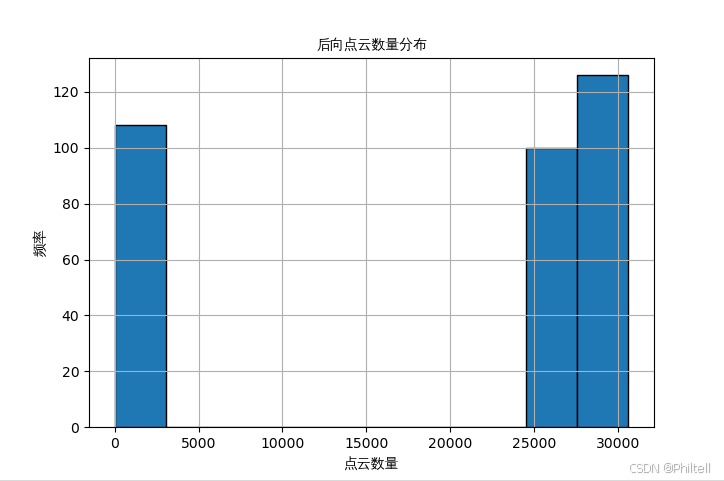
plt.hist(backward_point_cloud_counts, bins=10, edgecolor='black')
plt.title('后向点云数量分布', fontproperties=my_font)
plt.xlabel('点云数量', fontproperties=my_font)
plt.ylabel('频率', fontproperties=my_font)
plt.grid(True)
plt.show()


