语法如下:
pks = findpeaks(data)
[pks,locs] = findpeaks(data)
[pks,locs,w,p] = findpeaks(data)
[___] = findpeaks(data,x)
[___] = findpeaks(data,Fs)
[___] = findpeaks(___,Name,Value)
findpeaks(___)
where,pks是峰值返回值,locs是数据索引值
- […] = FINDPEAKS(…,
'MinPeakHeight',MPH) finds only those peaks that are greater than the minimum peak height, MPH. MPH is a real-valued scalar. The default value of MPH is -Inf.- […] = FINDPEAKS(…,
'MinPeakProminence',MPP) finds peaks guaranteed to have a vertical drop of more than MPP from the peak on both sides without encountering either the end of the signal or a larger intervening peak. The default value of MPP is zero.- […] = FINDPEAKS(…,
'Threshold',TH) finds peaks that are at least greater than both adjacent samples by the threshold, TH. TH is a real-valued scalar greater than or equal to zero. The default value of TH is zero.- FINDPEAKS(…,
'WidthReference',WR) estimates the width of the peak as the distance between the points where the signal intercepts a horizontal reference line. The points are found by linear interpolation. The height of the line is selected using the criterion specified in WR:
应用案例:
对信号数据进行频域分析后,想提取指定幅值以上的峰值所对应倍频,以下图为例,提取幅值为0.1以上的倍频值,可通过关键字MinPeakProminence进行操作。
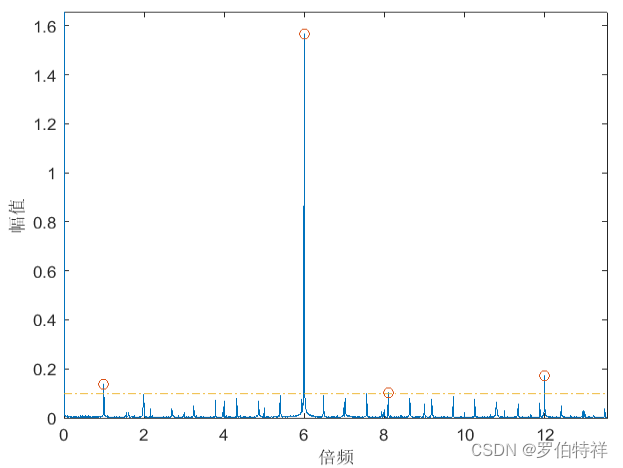
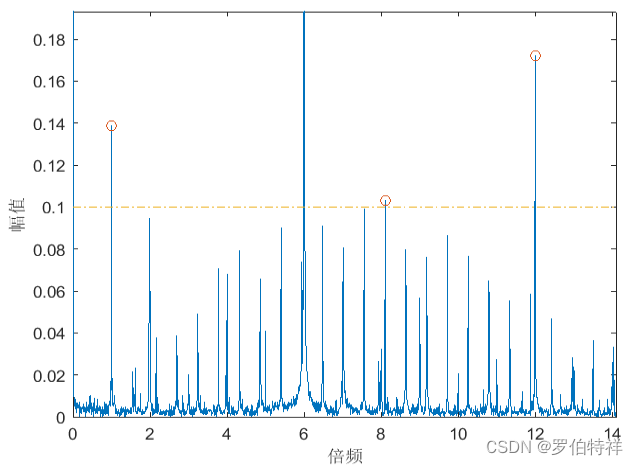
实现代码如下:
 [pks, locs] = findpeaks(y,'MinPeakProminence',0.1)
 hold on
 plot(freq(locs)*60/rpm,y(locs),'o')
 xlabel("倍频")
 ylabel("幅值")
 plot([0,165],[0.1,0.1],'-.')
参考文献:
- https://ww2.mathworks.cn/help/signal/ref/findpeaks.html?searchHighlight=findpeaks&s_tid=srchtitle_findpeaks_1
- https://ww2.mathworks.cn/help/signal/ug/find-peaks-in-data.html?searchHighlight=findpeaks&s_tid=srchtitle_findpeaks_3
- https://ww2.mathworks.cn/help/signal/ug/peak-analysis.html?searchHighlight=findpeaks&s_tid=srchtitle_findpeaks_7
- https://ww2.mathworks.cn/help/signal/ug/determine-peak-widths.html?searchHighlight=findpeaks&s_tid=srchtitle_findpeaks_5