文章目录
- 梯度下降法的理解
- 图解
- 极值点和最值点
- 梯度下降法的求导运算
- 公式推导
- 梯度下降法的实现
梯度下降法的理解
梯度下降法不是一个机器学习算法,既不是在做监督学习,也不是在做非监督学习,是一种基于搜索的最优化方法。
作用:最小化一个损失函数
梯度上升法:最大化一个损失函数
图解
- 先给出一个损失函数J,在二维平面中画出的曲线如下图所示。蓝点处画的一条直线是在这一点上的导数,为负值,当theta增大,导数增大,在最低处导数为0,即为极值点,为极小值。

- 由上图可看出,曲线向下凹陷,可将曲线比作一个山谷,蓝点为一个球,球滚落的速度为eta(学习率),在蓝点处,theta变化相同的值时,步长会逐渐变小,因为eta逐渐变小。

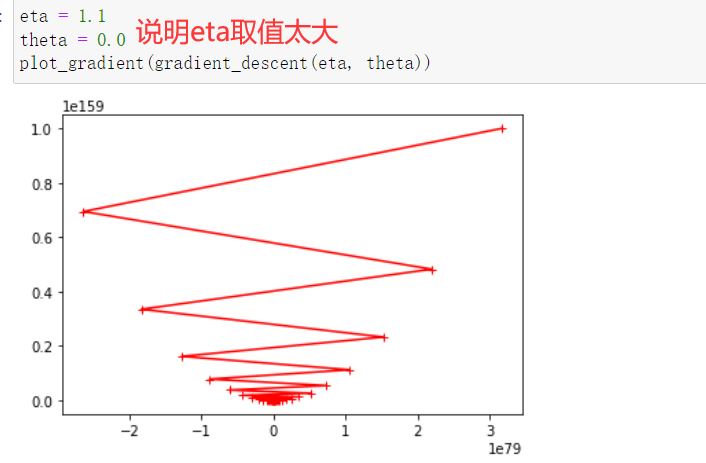
- eta叫做学习率(learning rate),是梯度下降法的一个超参数。eta的取值影响我们求得最优解的速度,eta的取值过小,收留太慢,eta取值过大,可能甚至得不到最优解。


极值点和最值点
并不是所有的函数都有唯一的极值点,线性回归的损失函数具有唯一的最优解。

梯度下降法的求导运算
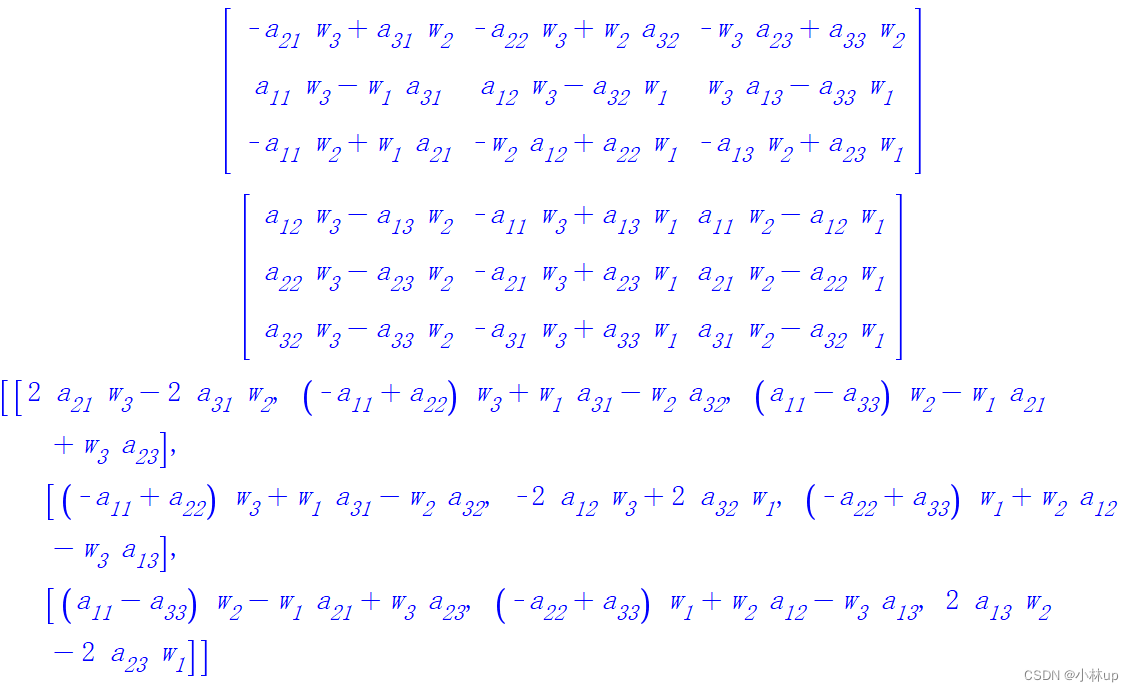
以上主要是以一个维度进行讲解,当在多维时求损失函数,其求法如下。
公式推导
- 我们的主要目标是使损失函数达到最小,于是我们可以通过公式的推导,得出最终的公式。

- 对损失函数进行求导,并列为矩阵形式。

- 为什么要除以m?因为求和运算后本身会对数据做一个扩大的处理,有可能在我们特征数量增大的时候,求得的导数结果变得比较厉害,而求导后我们希望得到的数据跟原来的数据有很大的关系,所以要除以m。

梯度下降法的实现
- 先创建一个损失函数
import numpy as np
import matplotlib.pyplot as plt

plt_x = np.linspace(-1,6,141)
plt_y = (plt_x-2.5)**2-1
plt.plot(plt_x, plt_y)
plt.show()

- 写出求导函数和求值函数
def dj(theta):
    return 2*(theta-2.5) # 传入theta,求theta点对应的导数

def j(theta):
    return (theta-2.5)**2-1 # 传入theta,求theta点对应的值
- 找到极值点,获得对应的theta值
eta = 0.1 # 设置学习率
theta = 0.0
epsilon = 1e-8
theta_history = [theta] # 存储移动步数
while True:
    gradient = dj(theta) # 求导数
    last_theta = theta
    theta = theta - gradient*eta # theta减去步长
    theta_history.append(theta)
    if np.abs(j(theta) - j(last_theta)) < epsilon: # 小于epsilon认为到达极值点
        break
print(theta)
print(dj(theta))
print(j(theta))
print(len(theta_history))

- 在损失函数的曲线上画出移动的轨迹
plt.plot(plt_x, plt_y)
plt.plot(theta_history, [(i-2.5)**2-1 for i in theta_history], color='r', marker='+')
plt.show()

- 对以上程序进行函数封装
def gradient_descent(eta, initial_theta, n_iters=1e3, epsilon=1e-8): # n_iters为最大迭代次数
    theta = initial_theta
    theta_history = [initial_theta]
    i_iter = 1
    def dj(theta):
        try:
            return 2*(theta-2.5) # 传入theta,求theta点对应的导数
        except:
            return float('inf') # 返回一个无穷大的值
    def j(theta):
        return (theta-2.5)**2-1 # 传入theta,求theta点对应的值

    while i_iter<n_iters:
        gradient = dj(theta)
        last_theta = theta
        theta = theta - gradient*eta
        theta_history.append(theta)
        if np.abs(j(theta) - j(last_theta)) < epsilon:
            break
        i_iter += 1
    return theta_history

def plot_gradient(theta_history):
    plt.plot(plt_x, plt_y)
    plt.plot(theta_history, [(i-2.5)**2-1 for i in theta_history], color='r', marker='+')
    plt.show()

