文章目录
- G6 图可视化引擎
- 简单上手
- 复杂一点的案例
- S2 多维交叉分析表格
- 简单的一个vue3使用S2的例子
G6 图可视化引擎
G6 是一个简单、易用、完备的图可视化引擎,它在高定制能力的基础上,提供了一系列设计优雅、便于使用的图可视化解决方案。能帮助开发者搭建属于自己的图可视化、图分析、或图编辑器应用。
简单上手
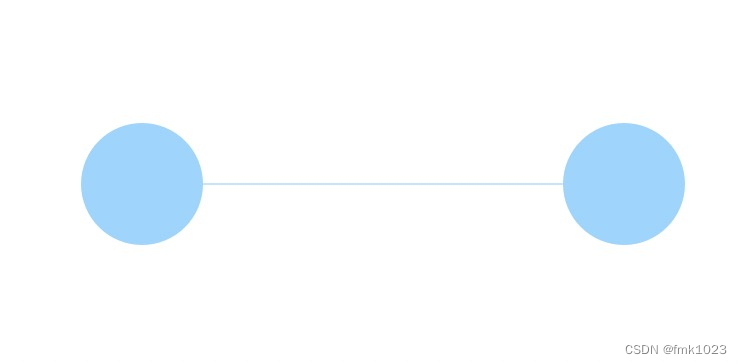
- 安装@antv/g6
npm install @antv/g6
# 或者
yarn add @antv/g6
- 创建容器
<div id="mountNode" ref="mountNode"></div>
- 数据准备
      const data = {
        nodes: [
          { id: 'node1', x: 100, y: 200, label: 'Node 1' },
          { id: 'node2', x: 300, y: 200, label: 'Node 2' },
        ],
        edges: [
          { source: 'node1', target: 'node2' },
        ],
      };
- 创建关系图
      const graph = new G6.Graph({
        container: this.$refs.graphContainer,
        width: 600,
        height: 400,
        modes: {
          default: ['drag-canvas', 'zoom-canvas', 'click-select'],
        },
        layout: {
          type: 'random',
        },
        defaultNode: {
          size: 30,
        },
      });
- 配置数据源,渲染
graph.data(data); // 读取 Step 2 中的数据源到图上 //高版本使用setData
graph.render(); // 渲染图
复杂一点的案例
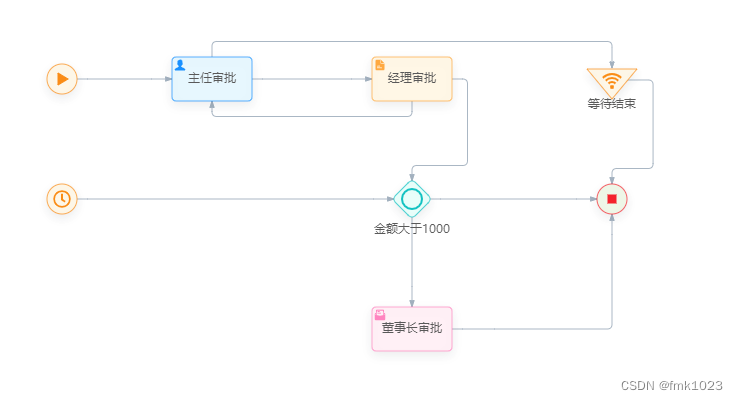
      demoData: {
        nodes: [{ id: 'startNode1', x: 50, y: 200, label: '', clazz: 'start', },
          { id: 'startNode2', x: 50, y: 320, label: '', clazz: 'timerStart', },
          { id: 'taskNode1', x: 200, y: 200, label: '主任审批', clazz: 'userTask',  },
          { id: 'taskNode2', x: 400, y: 200, label: '经理审批', clazz: 'scriptTask',  },
          { id: 'gatewayNode', x: 400, y: 320, label: '金额大于1000', clazz: 'inclusiveGateway',  },
          { id: 'taskNode3', x: 400, y: 450, label: '董事长审批', clazz: 'receiveTask', },
          { id: 'catchNode1', x: 600, y: 200, label: '等待结束', clazz: 'signalCatch', },
          { id: 'endNode', x: 600, y: 320, label: '', clazz: 'end', }],
        edges: [{ source: 'startNode1', target: 'taskNode1', sourceAnchor:1, targetAnchor:3, clazz: 'flow' },
          { source: 'startNode2', target: 'gatewayNode', sourceAnchor:1, targetAnchor:3, clazz: 'flow' },
          { source: 'taskNode1', target: 'catchNode1', sourceAnchor:0, targetAnchor:0, clazz: 'flow' },
          { source: 'taskNode1', target: 'taskNode2', sourceAnchor:1, targetAnchor:3, clazz: 'flow' },
          { source: 'taskNode2', target: 'gatewayNode', sourceAnchor:1, targetAnchor:0, clazz: 'flow' },
          { source: 'taskNode2', target: 'taskNode1', sourceAnchor:2, targetAnchor:2, clazz: 'flow' },
          { source: 'gatewayNode', target: 'taskNode3', sourceAnchor:2, targetAnchor:0, clazz: 'flow' },
          { source: 'gatewayNode', target: 'endNode', sourceAnchor:1, targetAnchor:2, clazz: 'flow'},
          { source: 'taskNode3', target: 'endNode', sourceAnchor:1, targetAnchor:1, clazz: 'flow' },
          { source: 'catchNode1', target: 'endNode', sourceAnchor:1, targetAnchor:0, clazz: 'flow' }]
      },
S2 多维交叉分析表格
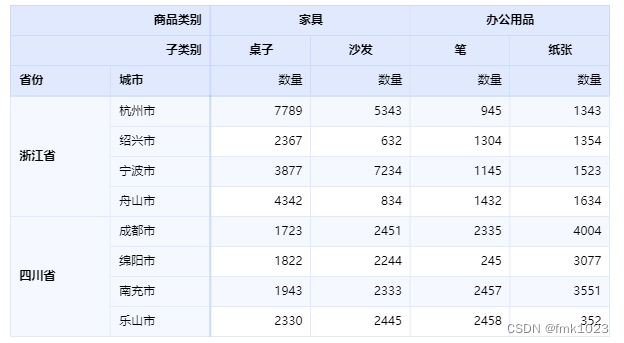
S2 是一个面向可视分析领域的数据驱动的表可视化引擎。S 取自于 SpreadSheet 的两个 S,2 代表了透视表中的行列两个维度。旨在提供美观、易用、高性能、易扩展的多维表格。
简单的一个vue3使用S2的例子
- 安装依赖
yarn add @antv/s2@next @antv/s2-vue@next ant-design-vue@3.x
- 创建数据
const s2DataConfig = {
  fields: {
    rows: ['province', 'city'],
    columns: ['type'],
    values: ['price'],
  },
  data: [
    {
      province: "浙江",
      city: "杭州",
      type: "笔",
      price: "1",
    },
    {
      province: "浙江",
      city: "杭州",
      type: "纸张",
      price: "2",
    },
    {
      province: "浙江",
      city: "舟山",
      type: "笔",
      price: "17",
    },
    {
      province: "浙江",
      city: "舟山",
      type: "纸张",
      price: "6",
    },
    {
      province: "吉林",
      city: "长春",
      type: "笔",
      price: "8",
    },
    {
      province: "吉林",
      city: "白山",
      type: "笔",
      price: "12",
    },
    {
      province: "吉林",
      city: "长春",
      type: "纸张",
      price: "3",
    },
    {
      province: "吉林",
      city: "白山",
      type: "纸张",
      price: "25",
    },
    {
      province: "浙江",
      city: "杭州",
      type: "笔",
      cost: "0.5",
    },
    {
      province: "浙江",
      city: "杭州",
      type: "纸张",
      cost: "20",
    },
    {
      province: "浙江",
      city: "舟山",
      type: "笔",
      cost: "1.7",
    },
    {
      province: "浙江",
      city: "舟山",
      type: "纸张",
      cost: "0.12",
    },
    {
      province: "吉林",
      city: "长春",
      type: "笔",
      cost: "10",
    },
    {
      province: "吉林",
      city: "白山",
      type: "笔",
      cost: "9",
    },
    {
      province: "吉林",
      city: "长春",
      type: "纸张",
      cost: "3",
    },
    {
      province: "吉林",
      city: "白山",
      type: "纸张",
      cost: "1",
    }
  ]
};
const s2Options = {
  width: 600,
  height: 480
}
- 组件开发及渲染
// App.vue
<script lang="ts">
import type { S2DataConfig, S2Options } from '@antv/s2';
import { SheetComponent } from '@antv/s2-vue';
import { defineComponent, onMounted, reactive, ref, shallowRef } from 'vue';
import "@antv/s2-vue/dist/style.min.css";

export default defineComponent({
  setup() {
    // dataCfg 数据字段较多,建议使用 shallow, 如果有数据更改直接替换整个对象
    const dataCfg = shallowRef(s2DataConfig);
    const options: S2Options = reactive(s2Options);

    return {
      dataCfg,
      options,
    };
  },

  components: {
    SheetComponent,
  },
});
</script>

<template>
  <SheetComponent :dataCfg="dataCfg" :options="options" />
</template>
