前置文章:
将一维机械振动信号构造为训练集和测试集(Python)
https://mp.weixin.qq.com/s/DTKjBo6_WAQ7bUPZEdB1TA
旋转机械振动信号特征提取(Python)
https://mp.weixin.qq.com/s/VwvzTzE-pacxqb9rs8hEVw
import pandas as pd
import numpy as np
import matplotlib.pyplot as plt
import seaborn as sns
from matplotlib.colors import ListedColormap
import matplotlib.patches as mpatches
from sklearn.model_selection import train_test_split
from sklearn.preprocessing import MinMaxScaler
from sklearn.neighbors import KNeighborsClassifier
from sklearn.metrics import classification_report
from sklearn.metrics import confusion_matrix
from sklearn import tree
import joblib
df_train = pd.read_csv("statistics_10_train.csv" , sep = ',')
df_test = pd.read_csv("statistics_10_test.csv" , sep = ',')X_train = df_train[['Kurtosis', 'Impulse factor', 'RMS', 'Margin factor', 'Skewness',
'Shape factor', 'Peak to peak', 'Crest factor']].values
y_train = df_train['Tipo'].values
X_test = df_test[['Kurtosis', 'Impulse factor', 'RMS', 'Margin factor', 'Skewness',
'Shape factor', 'Peak to peak', 'Crest factor']].values
y_test = df_test['Tipo'].valuesmax_depth_values = range(1, 20)
scores_train = []
scores_test = []
for m in max_depth_values:
treeModel = tree.DecisionTreeClassifier(random_state = 0, max_depth = m)
treeModel.fit(X_train, y_train)
scores_train.append(treeModel.score(X_train, y_train))
scores_test.append(treeModel.score(X_test, y_test))
plt.figure()
plt.xlabel('max_depth')
plt.ylabel('Accuracy')
plt.plot(max_depth_values, scores_train, label = 'Train')
plt.plot(max_depth_values, scores_test, label = 'Test')
plt.legend()
treeModel = tree.DecisionTreeClassifier(random_state = 0, max_depth = 7)
treeModel.fit(X_train, y_train)
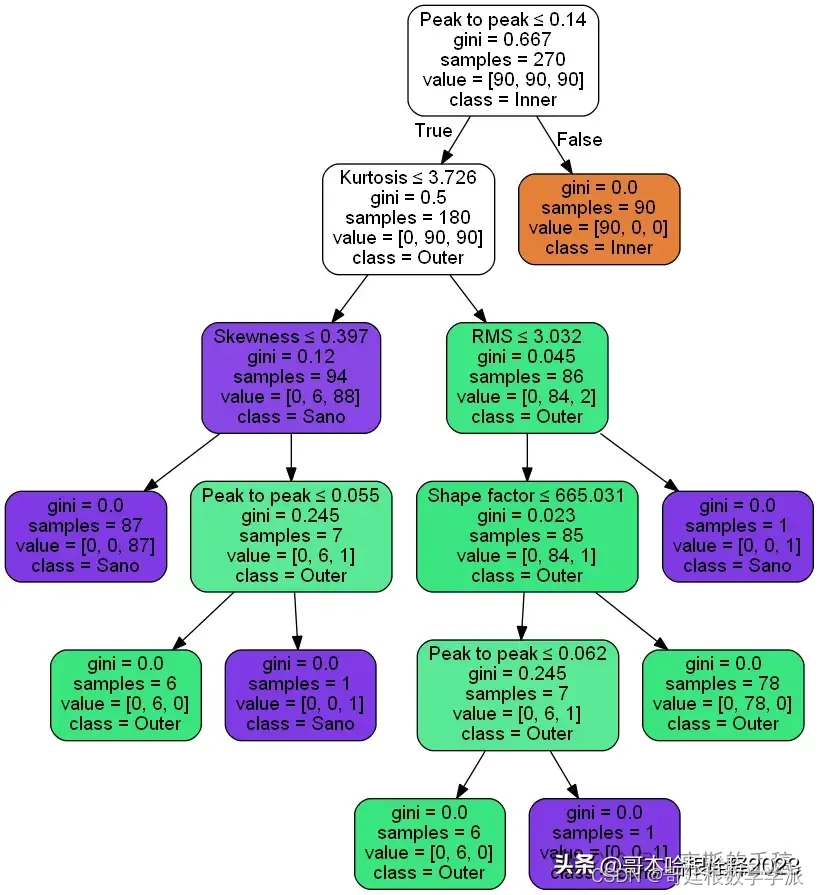
DecisionTreeClassifier(max_depth=7, random_state=0)tree.plot_tree(treeModel) [Text(200.88000000000002, 199.32, 'X[6] <= 0.14\ngini = 0.667\nsamples = 270\nvalue = [90, 90, 90]'),
Text(167.40000000000003, 163.07999999999998, 'X[0] <= 3.726\ngini = 0.5\nsamples = 180\nvalue = [0, 90, 90]'),
Text(66.96000000000001, 126.83999999999999, 'X[4] <= 0.397\ngini = 0.12\nsamples = 94\nvalue = [0, 6, 88]'),
Text(33.480000000000004, 90.6, 'gini = 0.0\nsamples = 87\nvalue = [0, 0, 87]'),
Text(100.44000000000001, 90.6, 'X[6] <= 0.055\ngini = 0.245\nsamples = 7\nvalue = [0, 6, 1]'),
Text(66.96000000000001, 54.359999999999985, 'gini = 0.0\nsamples = 6\nvalue = [0, 6, 0]'),
Text(133.92000000000002, 54.359999999999985, 'gini = 0.0\nsamples = 1\nvalue = [0, 0, 1]'),
Text(267.84000000000003, 126.83999999999999, 'X[2] <= 3.032\ngini = 0.045\nsamples = 86\nvalue = [0, 84, 2]'),
Text(234.36, 90.6, 'X[5] <= 665.031\ngini = 0.023\nsamples = 85\nvalue = [0, 84, 1]'),
Text(200.88000000000002, 54.359999999999985, 'X[6] <= 0.062\ngini = 0.245\nsamples = 7\nvalue = [0, 6, 1]'),
Text(167.40000000000003, 18.119999999999976, 'gini = 0.0\nsamples = 6\nvalue = [0, 6, 0]'),
Text(234.36, 18.119999999999976, 'gini = 0.0\nsamples = 1\nvalue = [0, 0, 1]'),
Text(267.84000000000003, 54.359999999999985, 'gini = 0.0\nsamples = 78\nvalue = [0, 78, 0]'),
Text(301.32000000000005, 90.6, 'gini = 0.0\nsamples = 1\nvalue = [0, 0, 1]'),
Text(234.36, 163.07999999999998, 'gini = 0.0\nsamples = 90\nvalue = [90, 0, 0]')]
target_names = ['Inner', 'Outer', 'Healthy']
pred = treeModel.predict(X_test)
print(confusion_matrix(y_test, pred))
print(classification_report(y_test, pred, target_names = target_names))
[[28 1 1]
[ 0 30 0]
[ 0 3 27]]
precision recall f1-score support
Inner 1.00 0.93 0.97 30
Outer 0.88 1.00 0.94 30
Healthy 0.96 0.90 0.93 30
accuracy 0.94 90
macro avg 0.95 0.94 0.94 90
weighted avg 0.95 0.94 0.94 90pred_train = treeModel.predict(X_train)
print(confusion_matrix(y_train, pred_train))
print(classification_report(y_train, pred_train, target_names = target_names))[[90 0 0]
[ 0 90 0]
[ 0 0 90]]
precision recall f1-score support
Inner 1.00 1.00 1.00 90
Outer 1.00 1.00 1.00 90
Healthy 1.00 1.00 1.00 90
accuracy 1.00 270
macro avg 1.00 1.00 1.00 270
weighted avg 1.00 1.00 1.00 270sns.set()
mat = confusion_matrix(y_test, pred)
fig, ax = plt.subplots(figsize=(7,6))
sns.set(font_scale=1.3)
sns.heatmap(mat.T, square=False, annot=True, fmt='d', cbar=False,
xticklabels=['Fallo inner race', 'Fallo oute race', 'Healthy'],
yticklabels=['Fallo inner race', 'Fallo oute race', 'Healthy'],
cmap=sns.cubehelix_palette(light=1, as_cmap=True))
plt.xlabel('true label');
plt.ylabel('predicted label');
from sklearn.tree import export_graphviz
from six import StringIO
from IPython.display import Image
import pydotplus
dot_data = StringIO()
estadisticos = ['Kurtosis', 'Impulse factor', 'RMS', 'Margin factor', 'Skewness',
                'Shape factor', 'Peak to peak', 'Crest factor']
export_graphviz(treeModel, out_file=dot_data,
                filled=True, rounded = True,
                special_characters = True, feature_names = estadisticos, class_names = ['Inner', 'Outer', 'Sano'])
graph = pydotplus.graph_from_dot_data(dot_data.getvalue())
graph.write_png('tree_hamming.png')
Image(graph.create_png())