不管是在vue2中还是在vue3中其实本质上的原理和步骤都是一样的,只是语法可能有所不同。
为了方便大家看起乱,vue2和vue3我分开写。
echarts官网:
https://echarts.apache.org/zh/index.htmlVue2篇:
1.导入echarts包(通过 npm 或 yarn 安装 ECharts)
npm的方式:
npm install echarts --save
或者 yarn的方式
yarn add echarts
下载好后,将echarts导入到需要使用echarts图表的组件中(这里我使用的全部导入)
import * as echarts from 'echarts';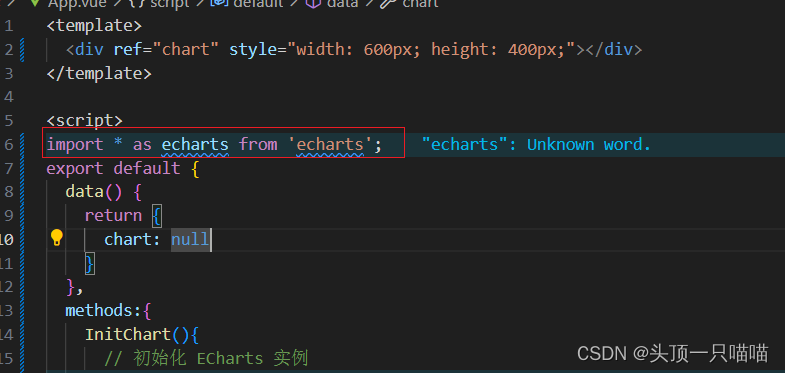
2.获取要渲染的dom元素(用ref获取容器)
(当然如果js原生学的好的话,你可使用下面的ID获取)
document.getElementById('容器ID名')使用ref获取容器(注意:这个容器一定要有一定的宽高,不然渲染出来,你看不到):

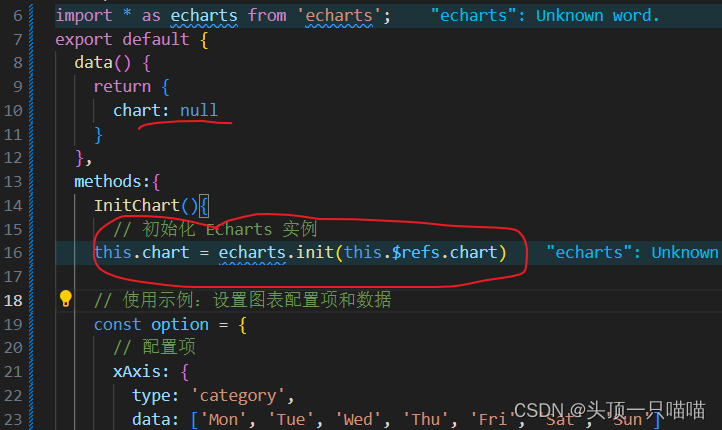
3.把dom元素传入到echart.init中(注意要先定义一个变量来接收echarts实例,这里我定义的是chart,所以代码如下)
值得一提我将echart相关的代码封装到一个方法InitChart中,为了代码的的工整。
this.chart = echarts.init(this.$refs.chart)因为这里使用是vue2,之前给容量定义ref,这里就用this.$refs获取容器
4.准备渲染配置项
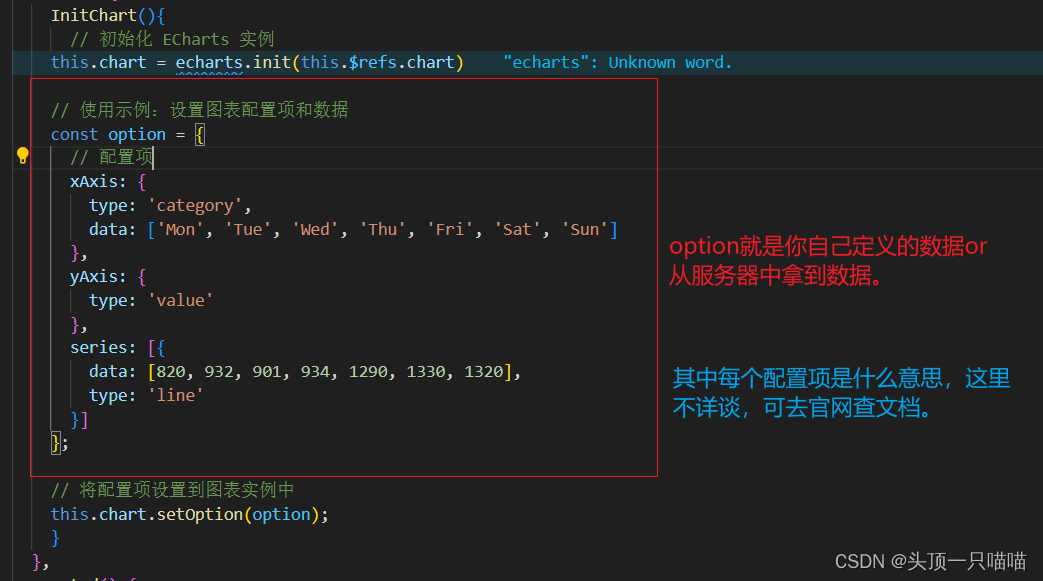
5.把配置项传给echarts实例
this.chart.setOption(option)
6.mounted调用封装的那个方法,(也是最容易忘记的)

最后附上所用案例代码:
<template>
  <div ref="chart" style="width: 600px; height: 400px;"></div>
</template>

<script>
import * as echarts from 'echarts';
export default {
  data() {
    return {
      chart: null
    }
  },
  methods:{
    InitChart(){
      // 初始化 ECharts 实例
    this.chart = echarts.init(this.$refs.chart)

    // 使用示例:设置图表配置项和数据
    const option = {
      // 配置项
      xAxis: {
        type: 'category',
        data: ['Mon', 'Tue', 'Wed', 'Thu', 'Fri', 'Sat', 'Sun']
      },
      yAxis: {
        type: 'value'
      },
      series: [{
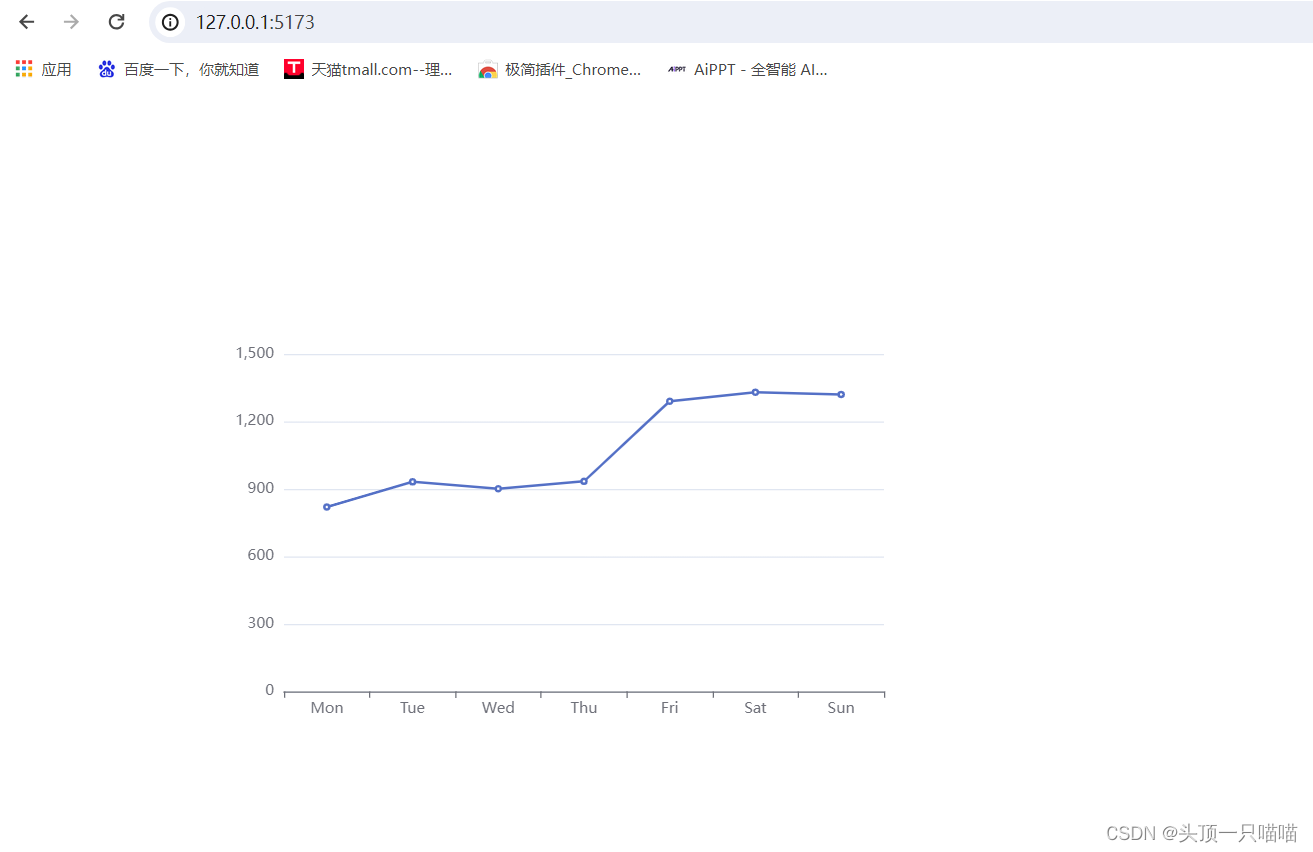
        data: [820, 932, 901, 934, 1290, 1330, 1320],
        type: 'line'
      }]
    };

    // 将配置项设置到图表实例中
    this.chart.setOption(option);
    }
  },
  mounted() {
    this.InitChart()
  }
}

</script>

<style>
</style>
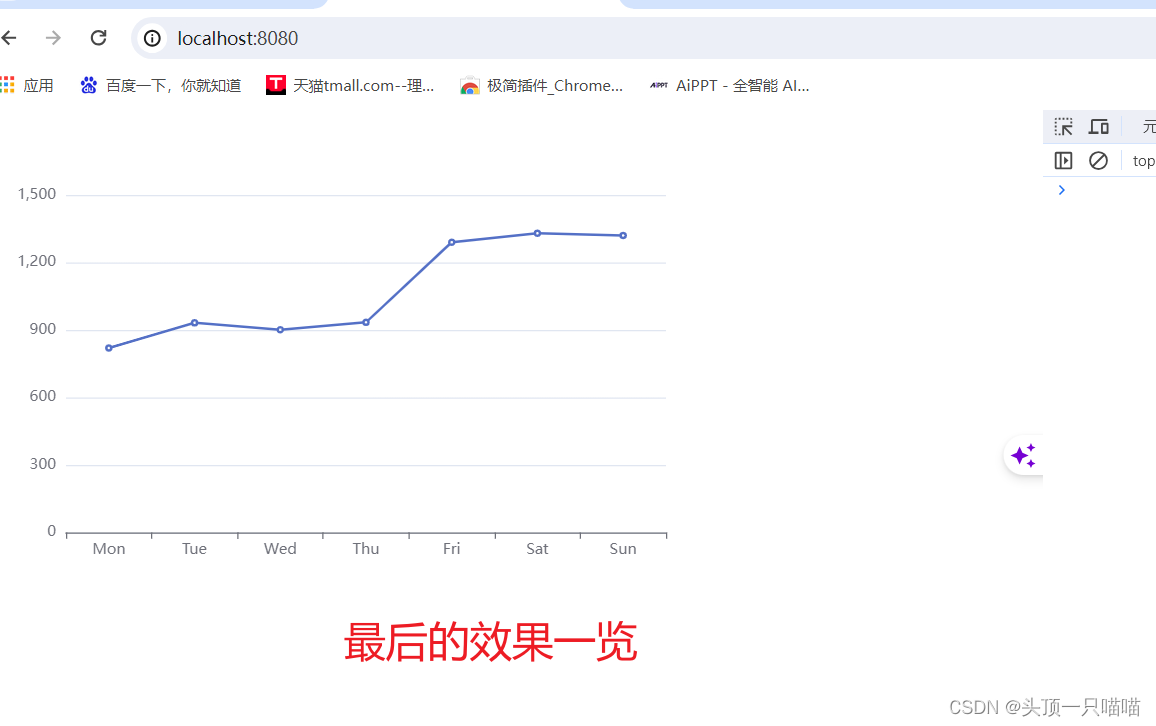
效果一览:
Vue3篇:
由于vue3的基本逻辑与vue2相同,我直接用整图讲解:
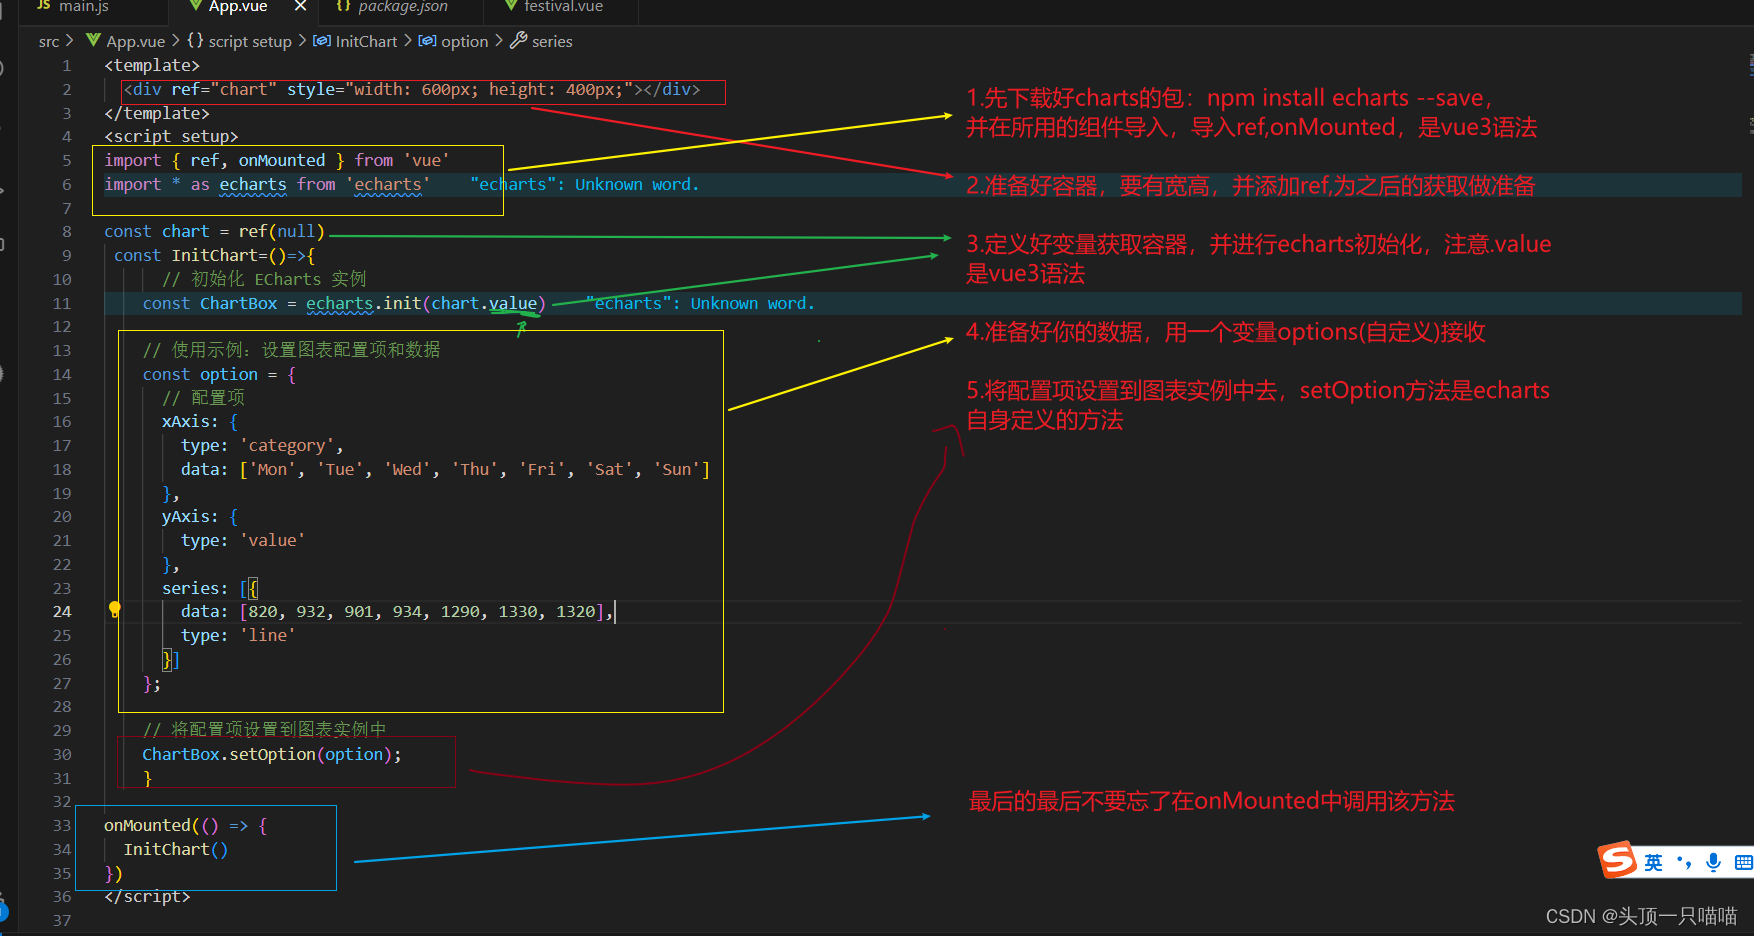
附上案例代码:
<template>
  <div ref="chart" style="width: 600px; height: 400px;"></div>
</template>
<script setup>
import { ref, onMounted } from 'vue'
import * as echarts from 'echarts'

const chart = ref(null)
 const InitChart=()=>{
      // 初始化 ECharts 实例
    const ChartBox = echarts.init(chart.value)

    // 使用示例:设置图表配置项和数据
    const option = {
      // 配置项
      xAxis: {
        type: 'category',
        data: ['Mon', 'Tue', 'Wed', 'Thu', 'Fri', 'Sat', 'Sun']
      },
      yAxis: {
        type: 'value'
      },
      series: [{
        data: [820, 932, 901, 934, 1290, 1330, 1320],
        type: 'line'
      }]
    };

    // 将配置项设置到图表实例中
    ChartBox.setOption(option);
    }

onMounted(() => {
  InitChart()
})
</script>


<style>
</style>
效果图一样:
