0、各项回归指标简介
- Relative Root Mean Squared Error(RRMSE):The RRMSE normalizes the Root Mean Squared Error (RMSE) by the mean of observations. It goes from 0 to infinity. The lower the better the prediction performance.
- The NRMSE(Normalized Root Mean Square Error) is calculated as the RMSE divided by the range of the observed values, expressed as a percentage. The range of the observed values is the difference between the maximum and minimum values of the observed data.
Best possible score is 0.0, smaller value is better. Range = [0, +inf) - MAE (Mean absolute error) represents the difference between the original and predicted values extracted by averaged the absolute difference over the data set.
- MSE (Mean Squared Error) represents the difference between the
original and predicted values extracted by squared the average
difference over the data set. - RMSE (Root Mean Squared Error) is the error rate by the square root
of MSE. - R-squared (Coefficient of determination) represents the coefficient
of how well the values fit compared to the original values. The value
from 0 to 1 interpreted as percentages. The higher the value is, the
better the model is.
1、Python计算回归拟合各项指标:包括RMSE # RRMSE # RSE # NSE # MAE # R # R2 # MAPE # ρ
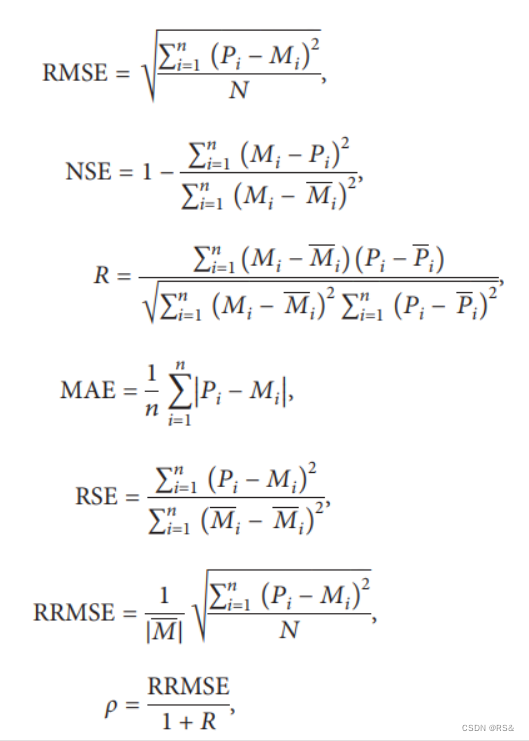
图片来源:https://github.com/alifrmf/Evaluation-Metrics-for-Linear-Regression/blob/main/README.md
代码:
# RMSE
def rmse(y_true, y_pred):
    squared_diff = (y_true - y_pred) ** 2
    mean_squared_diff = np.mean(squared_diff)
    rmse_value = np.sqrt(mean_squared_diff)
    return rmse_value
RRMSE计算方式一:RMSE除以真实值的均值
# RRMSE(Relative Root Mean Squared Error )
def rrmse(y_true, y_pred):
    # Calculate the squared errors between the predicted and true values
    squared_errors = (y_true - y_pred) ** 2

    # Calculate the mean of the squared errors
    mean_squared_error = np.mean(squared_errors)

    # Take the square root of the mean squared error
    root_mean_squared_error = np.sqrt(mean_squared_error)

    # Calculate the relative error by dividing the root mean squared error by the mean of the true values
    relative_error = root_mean_squared_error / np.mean(y_true)

    # Return the RRMSE value
    return relative_error
RRMSE计算方式二:除以真实值最大值-真实值最小值
def rrmse(s, o):
    """
        Relative Root Mean Squared Error
        input:
            s: simulated
            o: observed
        output:
            relative root mean squared error
        """
    return 100*np.sqrt(np.mean((s-o)**2))/(o.max()-o.min())
# RSE
def root_squared_error(y_true, y_pred):
    """
    Calculate the Root Squared Error between two arrays (y_true and y_pred).

    Args:
        y_true (numpy.ndarray): Actual values.
        y_pred (numpy.ndarray): Predicted values.

    Returns:
        float: The Root Squared Error.
    """
    error = y_true - y_pred
    squared_error = np.square(error)
    mean_squared_error = np.mean(squared_error)
    root_squared_error = np.sqrt(mean_squared_error)

    return root_squared_error
# NSE
def nash_sutcliffe_efficiency(y_true, y_pred):
    """
    Calculate the Nash-Sutcliffe Efficiency (NSE) between two arrays (y_true and y_pred).

    Args:
        y_true (numpy.ndarray): Actual values.
        y_pred (numpy.ndarray): Predicted values.

    Returns:
        float: The Nash-Sutcliffe Efficiency.
    """
    numerator = np.sum(np.square(y_true - y_pred))
    denominator = np.sum(np.square(y_true - np.mean(y_true)))
    nse = 1 - (numerator / denominator)

    return nse
# MAE
def mean_absolute_error(y_true, y_pred):
    """
    Calculate the Mean Absolute Error (MAE) between two arrays (y_true and y_pred).

    Args:
        y_true (numpy.ndarray): Actual values.
        y_pred (numpy.ndarray): Predicted values.

    Returns:
        float: The Mean Absolute Error.
    """
    absolute_error = np.abs(y_true - y_pred)
    mae = np.mean(absolute_error)

    return mae
# R
def pearson_correlation_coefficient(y_true, y_pred):
    """
    Calculate the Pearson Correlation Coefficient (R) between two arrays (y_true and y_pred).

    Args:
        y_true (numpy.ndarray): Actual values.
        y_pred (numpy.ndarray): Predicted values.

    Returns:
        float: The Pearson Correlation Coefficient.
    """
    correlation_matrix = np.corrcoef(y_true, y_pred)
    r = correlation_matrix[0, 1]

    return r
# R2
def r_squared(y_true, y_pred):
    """
    Calculate the R squared value between two arrays (y_true and y_pred).

    Args:
        y_true (numpy.ndarray): Actual values.
        y_pred (numpy.ndarray): Predicted values.

    Returns:
        float: The R squared value.
    """
    correlation_matrix = np.corrcoef(y_true, y_pred)
    correlation_xy = correlation_matrix[0,1]
    r_squared = correlation_xy**2

    return r_squared
# ρ (RRMSE / (1 + R))
def relative_rmse(y_true, y_pred):
    rmse = np.sqrt(metrics.mean_squared_error(y_true, y_pred))
    return rmse / (np.max(y_true) - np.min(y_true))

def pearson_correlation_coefficient(y_true, y_pred):
    correlation_matrix = np.corrcoef(y_true, y_pred)
    r = correlation_matrix[0, 1]
    return r
代码来源:https://github.com/alifrmf/Evaluation-Metrics-for-Linear-Regression/blob/main/Regression%20Metrics%20for%20Machine%20Learning.py
2、Python计算bias、rbias、mae、rmse等指标
代码来源:https://github.com/dsi-llc/scripts/blob/d4445ef02a971754fdaef901250b42b8394539fa/EEstatslib.py#L80
import numpy as np

# ------------------------------------------------------------------------------
# statistic functions
# ------------------------------------------------------------------------------

def drop_nan(df):
    """
        this function reads in dataframe after using
        dffromdatfile function in dataFrameFromdatfiles.py
        then returns a dataframe without nan
        """
    df_dropped = df.dropna()
    return df_dropped

def data_paired(df):
    """
        this function return the number of data paired
        after dropping nan values
        """
    return df.shape[0]

def bias(s, o):
    """
        Bias
        input:
            s: simulated
            o: observed
        output:
            bias
        """
    return np.mean(s-o)

def rbias(s, o):
    """
        Relative Bias
        input:
            s: simulated
            o: observed
        output:
            relative bias
        """
    return 100*(np.sum(s-o))/np.sum(o)


def mae(s, o):
    """
        Mean(Average) Absolute Error
        input:
            s: simulated
            o: observed
        output:
            mean absolute error
        """
    return np.mean(np.abs(s-o))

def rmse(s, o):
    """
        Root Mean Squared Error
        input:
            s: simulated
            o: observed
        output:
            root mean squared error
        """
    return np.sqrt(np.mean((s-o)**2))

def rrmse(s, o):
    """
        Relative Root Mean Squared Error
        input:
            s: simulated
            o: observed
        output:
            relative root mean squared error
        """
    return 100*np.sqrt(np.mean((s-o)**2))/(o.max()-o.min())

def correlation(s, o):
    """
        Correlation Coefficient
        input:
            s: simulated
            o: observed
        output:
            correlation coefficient
        """
    return np.corrcoef(o, s)[0, 1]

def r_sqr(s, o):
    """
        R Squared (Square of Correlation Coefficient)
        input:
            s: simulated
            o: observed
        output:
            R Squared
        """
    return correlation(s, o)**2

def nsi(s, o):
    """
        Nash-Sutcliffe Index of Efficiency
        input:
            s: simulated
            o: observed
        output:
            nash-sutcliffe index of efficiency
        """
    return 1-np.sum((s-o)**2)/np.sum((o-np.mean(o))**2)

def coe(s, o):
    """
        Coefficient of Efficiency
        input:
            s: simulated
            o: observed
        output:
            coefficient of efficiency
        """
    return 1 - np.sum(np.abs(s-o))/np.sum(np.abs(o-np.mean(o)))

def ioa(s, o):
    """
        Index of Agreement
        input:
            s: simulated
            o: observed
        output:
            index of agreement
        """
    return 1 - (np.sum((o-s)**2))/\
               (np.sum((np.abs(s-np.mean(o))+np.abs(o-np.mean(o)))**2))

def kge(s, o):
    """
        Kling-Gupta Efficiency
        input:
            s: simulated
            o: observed
        output:
            kgef: kling-gupta efficiency
            cc: correlation
            alpha: ratio of the standard deviation
            beta: ratio of the mean
        """
    cc = correlation(s, o)
    alpha = np.std(s)/np.std(o)
    beta = np.sum(s)/np.sum(o)
    kgef = 1 - np.sqrt((cc-1)**2 + (alpha-1)**2 + (beta-1)**2)
    return kgef, cc, alpha, beta

def stats_summary(df, sim_column_idx=0, obs_column_idx=1, decimals=3):
    """
        Statistics Summary, output all statistics number in dictionary
        input:
            df: dataframe from EE.dat file
                (default just two columns, model and data)
            sim_column_idx: column index for simulated values (default 0)
            obs_column_idx: column index for observed values (default 1)
            decimals: round all statistics to the given number of decimals (default 3)
        output:
            statsummary: dictionary with all statistics number
        """


    df_drop = drop_nan(df)

    simulated = df_drop.iloc[:, sim_column_idx]
    observed = df_drop.iloc[:, obs_column_idx]
    statsummary = {'Data Paired': data_paired(df_drop),
                   'Bias': np.round(bias(simulated, observed), decimals),
                   'Percent Bias': np.round(rbias(simulated, observed), decimals),
                   'Mean Absolute Error': np.round(mae(simulated, observed), decimals),
                   'RMSE': np.round(rmse(simulated, observed), decimals),
                   'RRMSE': np.round(rrmse(simulated, observed), decimals),
                   'R': np.round(correlation(simulated, observed), decimals),
                   'R-Sqr': np.round(r_sqr(simulated, observed), decimals),
                   'Nash-Sutcliffe Efficiency': np.round(nsi(simulated, observed), decimals),
                   'Coefficient of Efficiency': np.round(coe(simulated, observed),decimals),
                   'Index of Agreement': np.round(ioa(simulated, observed), decimals),
                   'Kling-Gupta Efficiency': np.round(list(kge(simulated, observed))[0], decimals)}
    return statsummary


![[Windows] GIF动画、动图制作神器 ScreenToGif(免费)](https://img-blog.csdnimg.cn/direct/d87330c7962a474bae1afe65393afe7e.png)