Applied Spatial Statistics(四)点模式分析-KDE 分析和距离函数
---- 1853年伦敦霍乱爆发
在此示例中,我将演示如何使用 John Snow 博士的经典霍乱地图在 Python 中执行 KDE 分析和距离函数。
感谢 Robin Wilson 将所有数据数字化并将其转换为友好的 GIS 格式。 原始数据从这里获得:
http://blog.rtwilson.com/john-snows-known-cholera-analysis-data-in-modern-gis-formats/
具体来说,我们需要这些包来进行分析:
seaborn:这实际上是一个可视化包; 但是,它们确实具有可用于二维空间数据的 KDE 功能。pointpats:这是一个用于进行 PPA 和最近邻分析的软件包。 我们需要用它来计算例如 G距离函数。contextily:这是向您的地图添加底图(如谷歌地图)。
步骤1
导入所有需要的包
import geopandas as gpd
import seaborn as sns
import numpy as np
import matplotlib.pyplot as plt
第2步
读入两个 shapefile:
- SnowGIS/Cholera_Deaths.shp 是一个包含所有死亡和位置的点形状文件
- SnowGIS/Pumps.shp 是包含所有泵的点形状文件
由于它们都是 shapefile,一旦我们使用“gpd.read_file()”将它们读入 python,我们就得到了 GeoDataFrame。
cases = gpd.read_file("https://raw.githubusercontent.com/Ziqi-Li/GEO4162C/main/data/SnowGIS/Cholera_Deaths.shp")

pump = gpd.read_file("https://raw.githubusercontent.com/Ziqi-Li/GEO4162C/main/data/SnowGIS/Pumps.shp")
在我们进行下一步操作之前,最好先检查数据。 例如,您需要执行以下操作:
- 1.查看数据表,了解GeoDataFrame中的属性
- 2.检查几何图形,看看是否可以绘制它们
- 3.检查您读入的shapefile是否具有相同的
crs
cases.head() #This returns you the first 5 rows in the GeoDataFrame
| Id | Count | geometry | |
|---|---|---|---|
| 0 | 0 | 3 | POINT (529308.741 181031.352) |
| 1 | 0 | 2 | POINT (529312.164 181025.172) |
| 2 | 0 | 1 | POINT (529314.382 181020.294) |
| 3 | 0 | 1 | POINT (529317.380 181014.259) |
| 4 | 0 | 4 | POINT (529320.675 181007.872) |
cases.crs #This returns you the crs
<Projected CRS: EPSG:27700>
Name: OSGB36 / British National Grid
Axis Info [cartesian]:
- E[east]: Easting (metre)
- N[north]: Northing (metre)
Area of Use:
- name: United Kingdom (UK) - offshore to boundary of UKCS within 49°45'N to 61°N and 9°W to 2°E; onshore Great Britain (England, Wales and Scotland). Isle of Man onshore.
- bounds: (-9.01, 49.75, 2.01, 61.01)
Coordinate Operation:
- name: British National Grid
- method: Transverse Mercator
Datum: Ordnance Survey of Great Britain 1936
- Ellipsoid: Airy 1830
- Prime Meridian: Greenwich
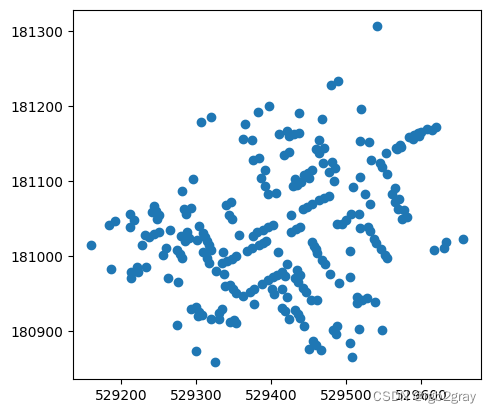
cases.plot() #This returns you a map of all the cases
<Axes: >
pump.crs
<Projected CRS: EPSG:27700>
Name: OSGB36 / British National Grid
Axis Info [cartesian]:
- E[east]: Easting (metre)
- N[north]: Northing (metre)
Area of Use:
- name: United Kingdom (UK) - offshore to boundary of UKCS within 49°45'N to 61°N and 9°W to 2°E; onshore Great Britain (England, Wales and Scotland). Isle of Man onshore.
- bounds: (-9.01, 49.75, 2.01, 61.01)
Coordinate Operation:
- name: British National Grid
- method: Transverse Mercator
Datum: Ordnance Survey of Great Britain 1936
- Ellipsoid: Airy 1830
- Prime Meridian: Greenwich
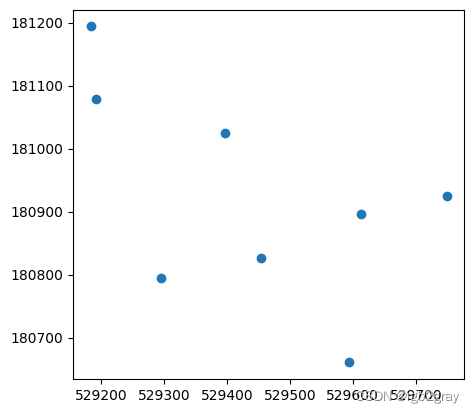
pump.plot()
<Axes: >
步骤 3
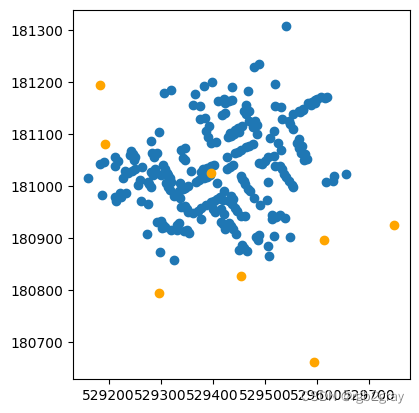
制作一个简单的地图,覆盖带有泵的案例
ax = cases.plot() #First we need to create an axis

pump.plot(ax=ax,color="orange") #Then plot the pumps using thes previously created axis as a parameter in the `plot()`
<Axes: >
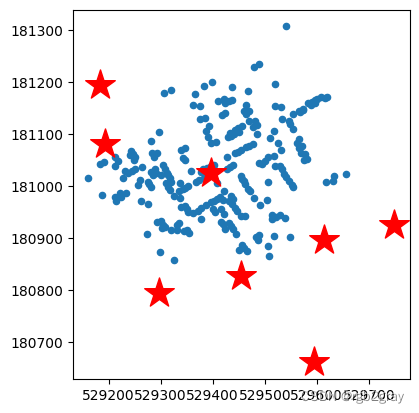
ax = cases.plot(markersize = 20)
#Check out here for differernt shapes of the markers:
#https://matplotlib.org/api/markers_api.html

pump.plot(ax=ax,markersize=500,marker="*",color="red")
<Axes: >
步骤4
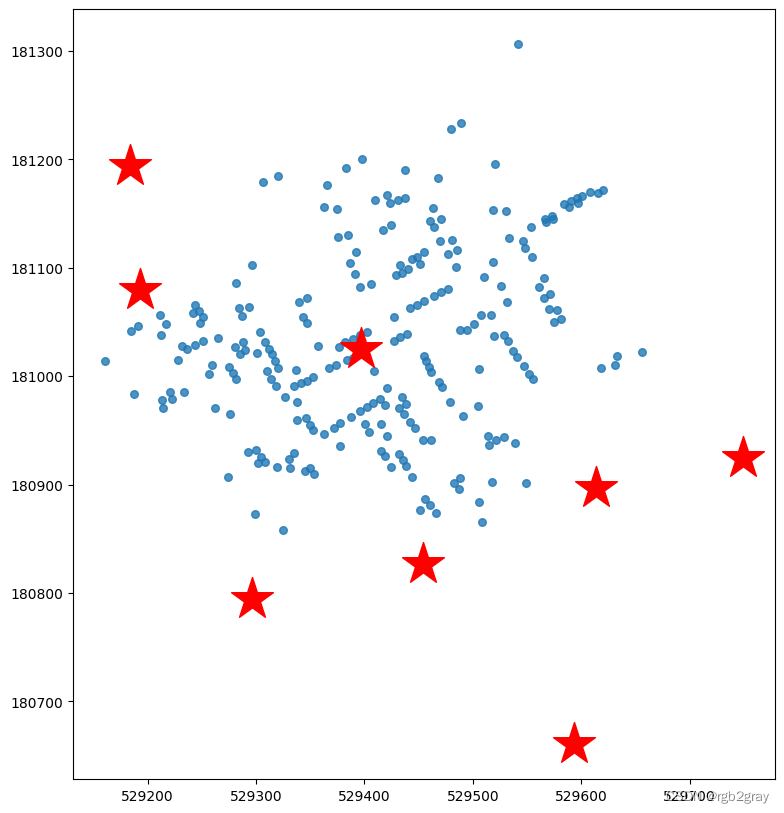
将地图叠加在一起
#First we create a figure with a size of (10,10)
f, ax = plt.subplots(figsize=(10,10))

cases.plot(ax=ax, markersize = 30, alpha=0.8)
pump.plot(ax=ax,markersize=1000, marker="*",color="red")
<Axes: >
步骤 5
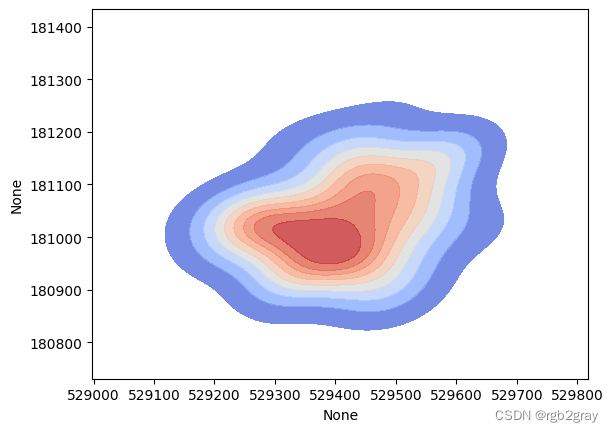
执行核密度估计(KDE)
函数 sns.kdeplot() 有几个参数:
-
- GeoDataFrame
cases
- GeoDataFrame
-
- x 和 y 坐标,我们可以从 GeoDataFrame 中提取为
cases.geometry.x和cases.geometry.y
- x 和 y 坐标,我们可以从 GeoDataFrame 中提取为
-
bw_method是 KDE 的带宽。
-
fill参数表示你想要计数图还是填充色图
-
cmap参数表示您要使用的颜色
-
alpha参数表示透明度的级别。
基本上 4、5、6 是您可以更改的样式参数。
执行 KDE 的代码是:
sns.kdeplot(data=cases,
            x=cases.geometry.x,
            y=cases.geometry.y,
            bw_method=0.5,
            fill=True,
            cmap="coolwarm",
            alpha=0.8)
<Axes: xlabel='None', ylabel='None'>
让我们将 kde 覆盖在我们的地图上。 请注意,您需要指定要在与其余地图相同的轴上绘制的 kdeplot。 所以我们需要在sns.kdeplot(ax=ax,...)中添加ax=ax。
f, ax = plt.subplots(figsize=(10,10))
cases.plot(ax=ax, markersize = 50)
pump.plot(ax=ax,markersize=1000,marker="*",color="red")

#4th layer
sns.kdeplot(ax=ax, data=cases,
            x=cases.geometry.x,
            y=cases.geometry.y,
            bw_method=0.5,
            fill=True,
            cmap="coolwarm",
            alpha=0.6)
<Axes: xlabel='None', ylabel='None'>
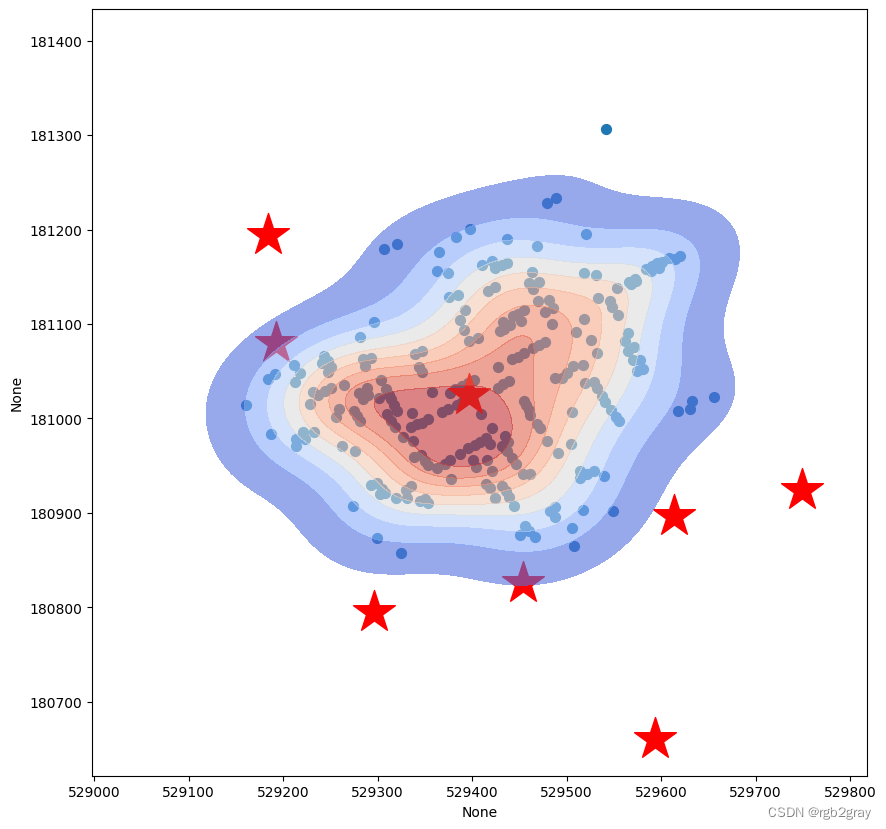
我们可以看到热点中心与中央泵对齐得很好!
Step 6 (Optional)
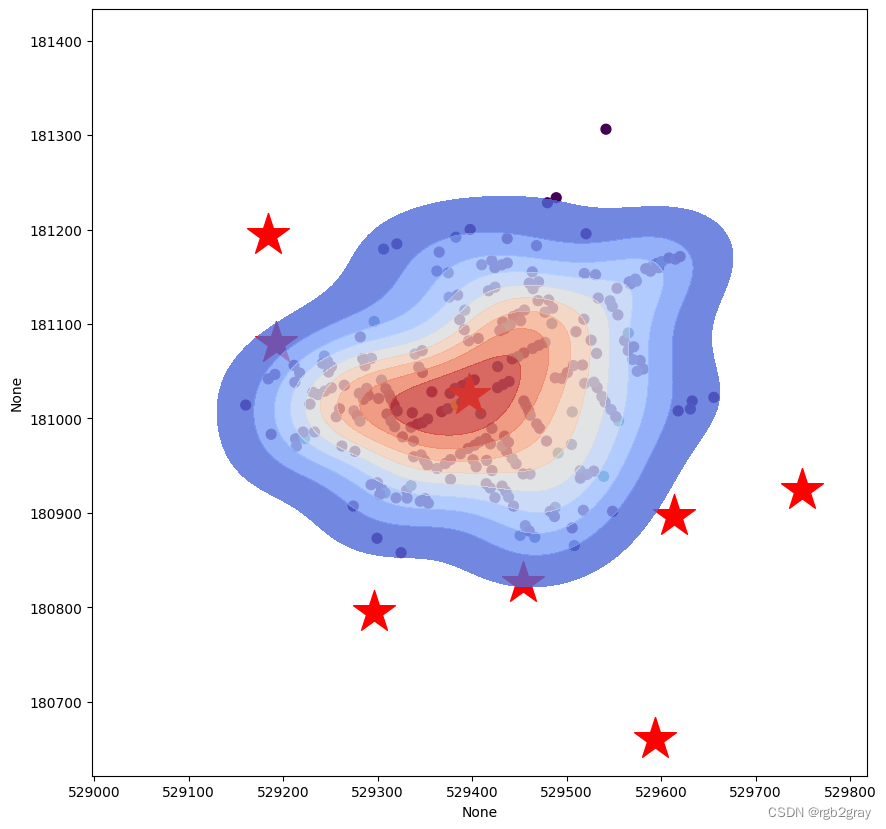
sns.kdeplot() 中的另一个重要参数是有一个 weights 参数,您可以使用它根据每个位置的案例数量来权衡您的位置。 这是可选的。
- 首先让我们回顾一下 GeoDataFrame 的情况,我们发现有一列名为“Count”。
- 然后,让我们使用这个“Count”作为 KDE 中的权重。 为此,请将“weights=cases.Count”添加到现有的 kde 函数中
cases.head()
| Id | Count | geometry | |
|---|---|---|---|
| 0 | 0 | 3 | POINT (529308.741 181031.352) |
| 1 | 0 | 2 | POINT (529312.164 181025.172) |
| 2 | 0 | 1 | POINT (529314.382 181020.294) |
| 3 | 0 | 1 | POINT (529317.380 181014.259) |
| 4 | 0 | 4 | POINT (529320.675 181007.872) |
</div>
f, ax = plt.subplots(figsize=(10,10))
cases.plot(ax=ax, markersize = 50,column="Count")
pump.plot(ax=ax,markersize=1000,marker="*",color="red")

sns.kdeplot(ax=ax,data=cases, x=cases.geometry.x, y=cases.geometry.y, bw_method=0.5, fill=True,
            cmap="coolwarm",alpha=0.8,weights=cases.Count)

plt.savefig('choloera.png',dpi=600)
步骤 7:添加底图
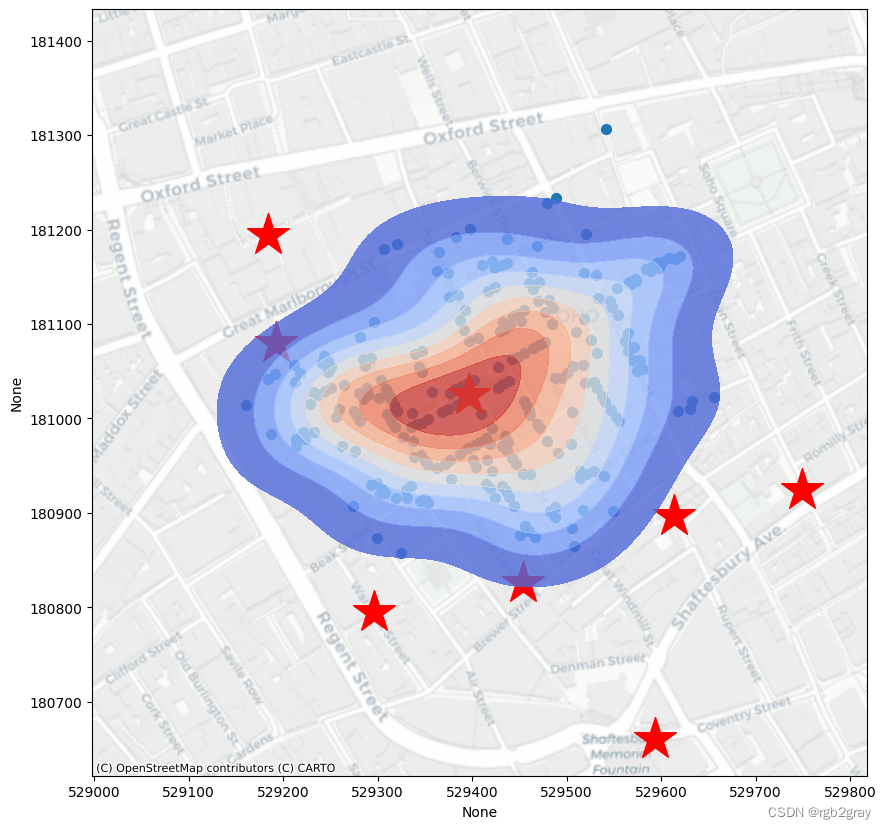
在这里,我添加了一小节关于使用“contextily”包将底图添加到绘图中的内容,这在大多数情况下非常有用,当我们没有另一个底图作为参考/提供必要的上下文时。
contextily 在 Google Colab 中不可用,所以我们需要在这里安装它。
pip install -q contextily
import contextily as cx
f, ax = plt.subplots(figsize=(10,10))

cases.plot(ax=ax, markersize = 50, figsize=(9,9))
pump.plot(ax=ax,markersize=1000,marker="*",color="red")
sns.kdeplot(ax=ax,data=cases, x=cases.geometry.x, y=cases.geometry.y, bw_method=0.5, fill=True,
            cmap="coolwarm",alpha=0.8,weights=cases.Count)

#This is the new line of code:
#We need to put a crs into the function.
#The source defines the style of the base map: https://contextily.readthedocs.io/en/latest/providers_deepdive.html
#There are many options available.
cx.add_basemap(ax, source=cx.providers.CartoDB.Positron, crs=cases.crs) # we need to put a crs into the function.
步骤 8
距离函数分析
下一节我们将使用距离函数和显着性检验进行最近邻分析。 这可以在很棒的“pointpats”包中轻松完成。
首先,让我们从“cases”GeoDataFrame 中提取 x 和 y 坐标,并将它们作为二维数组。
from pointpats import distance_statistics as stats
from pointpats import PointPattern, PoissonPointProcess
x = cases.geometry.x.values
y = cases.geometry.y.values

points = np.array(list(zip(x,y)))
其次,让我们使用点创建一个“PointPattern()”类
pp = PointPattern(points)
pp
<pointpats.pointpattern.PointPattern at 0x7a7f99a16bf0>
“knn”函数将返回每个点的最近邻居以及到该邻居的距离。
接下来,让我们生成 100 个 CSR(每个都是泊松过程)作为我们的空基准。 请记住,这将是我们进行显着性检验的置信区间。
CSRs = PoissonPointProcess(pp.window, pp.n, 100, asPP=True) # simulate CSR 100 times
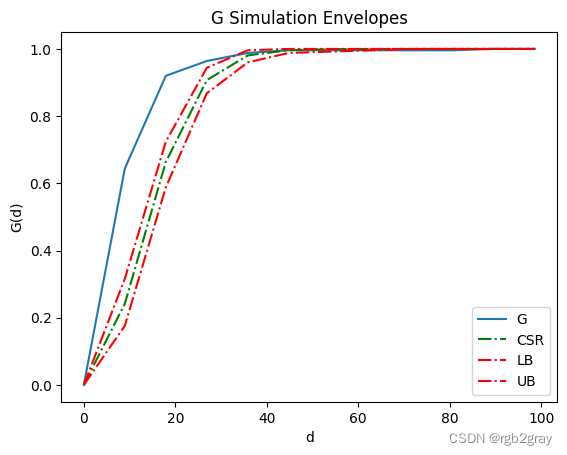
运行 G 距离 stats.Genv() 函数并将其可视化。 参数“pct=0.05”表示如果曲线在包络线之外,则该模式在 0.05 水平上将比随机模式具有统计显着性。
它显示 G 曲线高于置信包络线(红色曲线),表明我们在霍乱地图中观察到统计上的聚类模式(0.05 水平)。
genv = stats.Genv(pp, realizations=CSRs,pct=0.05)

genv.plot()
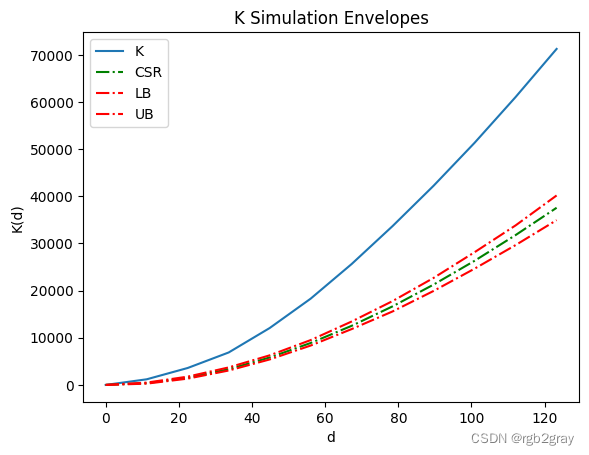
您还可以轻松执行 K 或 F 距离函数。 同样,K 曲线高于置信包络线(红色曲线),表明我们在霍乱地图中观察到聚集模式。
kenv = stats.Kenv(pp, realizations=CSRs,pct=0.05) # call Fenv for F function
kenv.plot()
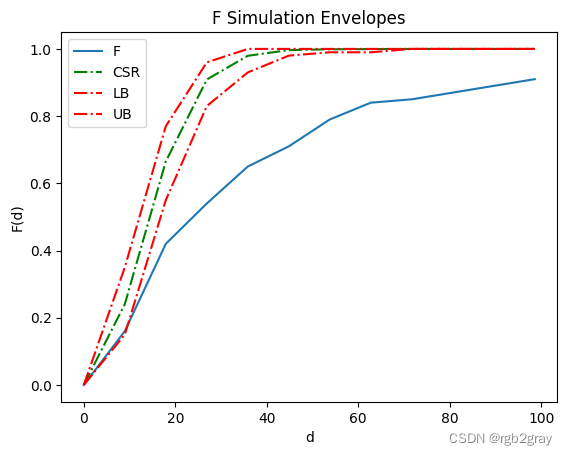
F 曲线低于置信包络线(红色曲线),表明我们在霍乱地图中观察到聚集模式。
import warnings
warnings.filterwarnings('ignore')
fenv = stats.Fenv(pp, realizations=CSRs) # call Fenv for F function
fenv.plot()
