code如下:
% SCD,积雪日数
% SCS,积雪初日
% SCM,积雪终日

% SCS SCD SCM
clc; clear;
% 读取 Excel 表
excel_file = 'E:\work\2024年\April20\积雪作图\tif文件\excel表\SCS.xlsx'; % Excel 文件路径
data = readtable(excel_file);

datavalue = data{:,2:end};
year = (2000:1:2019)';
coefficients = []; % y = b(1) + b(2)*x p值(置信度)

for i = 1:3
    X = [ones(size(year)) year];
    [b,~,~,~,stats] = regress(datavalue(:,i), X); % Removes NaN data
    coefficients(i,:) = [b(1) b(2) stats(3)];
end

% 创建图形窗口  #58CCFA
fig = figure('Position', [100, 200, 800, 700]);
yyaxis left; % 激活左边的轴  SCS
plot(year, datavalue(:,1), 'o-', 'MarkerSize', 4, 'MarkerFaceColor', '#58CCFA', 'Color', '#58CCFA', 'LineWidth', 2,'DisplayName','初雪日期');
hold on;
plot(year, coefficients(1,1)+coefficients(1,2)*year, '--',  'LineWidth', 1.5,Color=[253 230 100]/256, DisplayName ='线性(初雪日期)'); % 拟合线
annotation('textbox', [.44 .1+.12 .4 .15], 'String', sprintf('y = %.4fx + %.4f    p > 0.1', coefficients(1,2), coefficients(1,1)), 'FontSize', 14, 'EdgeColor', 'none', 'Color', 'black', 'HorizontalAlignment', 'center'); % 调整注释框位置


% 绘制SCM
plot(year, datavalue(:,3), 'o-', 'MarkerSize', 4, 'MarkerFaceColor', '#67BC97', 'Color', '#67BC97', 'LineWidth', 2,'DisplayName','终雪日期');
plot(year, coefficients(3,1)+coefficients(3,2)*year, '--',  'LineWidth', 1.5,Color=[234 105 100]/256,DisplayName='线性(终雪日期)'); % 拟合线
xlim([2000 2019]); ylim([25,145]);
annotation('textbox', [.44 .7+.02 .4 .15], 'String', sprintf('y = %.4fx + %.4f    p > 0.1', coefficients(3,2), coefficients(3,1)), 'FontSize', 14, 'EdgeColor', 'none', 'Color', 'black', 'HorizontalAlignment', 'center'); % 调整注释框位置

ax = gca;
ax.TickDir = 'out';
% 设置Y轴属性
set(gca, 'fontsize', 12, 'yminortick', 'on', 'YColor', 'k'); % 打开次刻度
ylabel('日数/d','fontsize',14)

yyaxis right; % 激活右边的轴
% 绘制SCD
plot(year, datavalue(:,2), 'o-', 'MarkerSize', 4, 'MarkerFaceColor', '#6884FF', 'Color', '#6884FF', 'LineWidth', 2,'DisplayName','积雪持续时间');
plot(year, coefficients(2,1)+coefficients(2,2)*year, '--',  'LineWidth', 1.5,Color='#58CCFA',DisplayName='积雪持续时间'); % 拟合线
xlim([2000 2019]); ylim([10,80]);
annotation('textbox', [.44 .29+.08 .4 .15], 'String', sprintf('y = %.4fx + %.4f    p > 0.1', coefficients(2,2), coefficients(2,1)), 'FontSize', 14, 'EdgeColor', 'none', 'Color', 'black', 'HorizontalAlignment', 'center'); % 调整注释框位置


% 设置X轴属性
set(gca, 'fontsize', 12, 'xminortick', 'on', 'XTick', (2000:2:2019)); % 设置主刻度
ax = gca;
ax.XAxis.MinorTickValues = 2000:1:2019; % 设置次刻度

% 设置Y轴属性
set(gca, 'fontsize', 12, 'yminortick', 'on', 'YTick', (10:10:80), 'linewidth', 1.5, 'YColor', 'k'); % 打开次刻度并设置坐标轴粗细

ylabel('积雪持续天数/days','fontsize',14)
xlabel('水文年','fontsize',14)

legend('Location','southoutside','FontSize',12)
legend('boxoff')
lgd = legend;
lgd.NumColumns = 3;

print(fig, 'data.tif', '-dtiff', '-r1000'); % 保存为 TIFF 文件,300 DPI 分辨率
hold off;
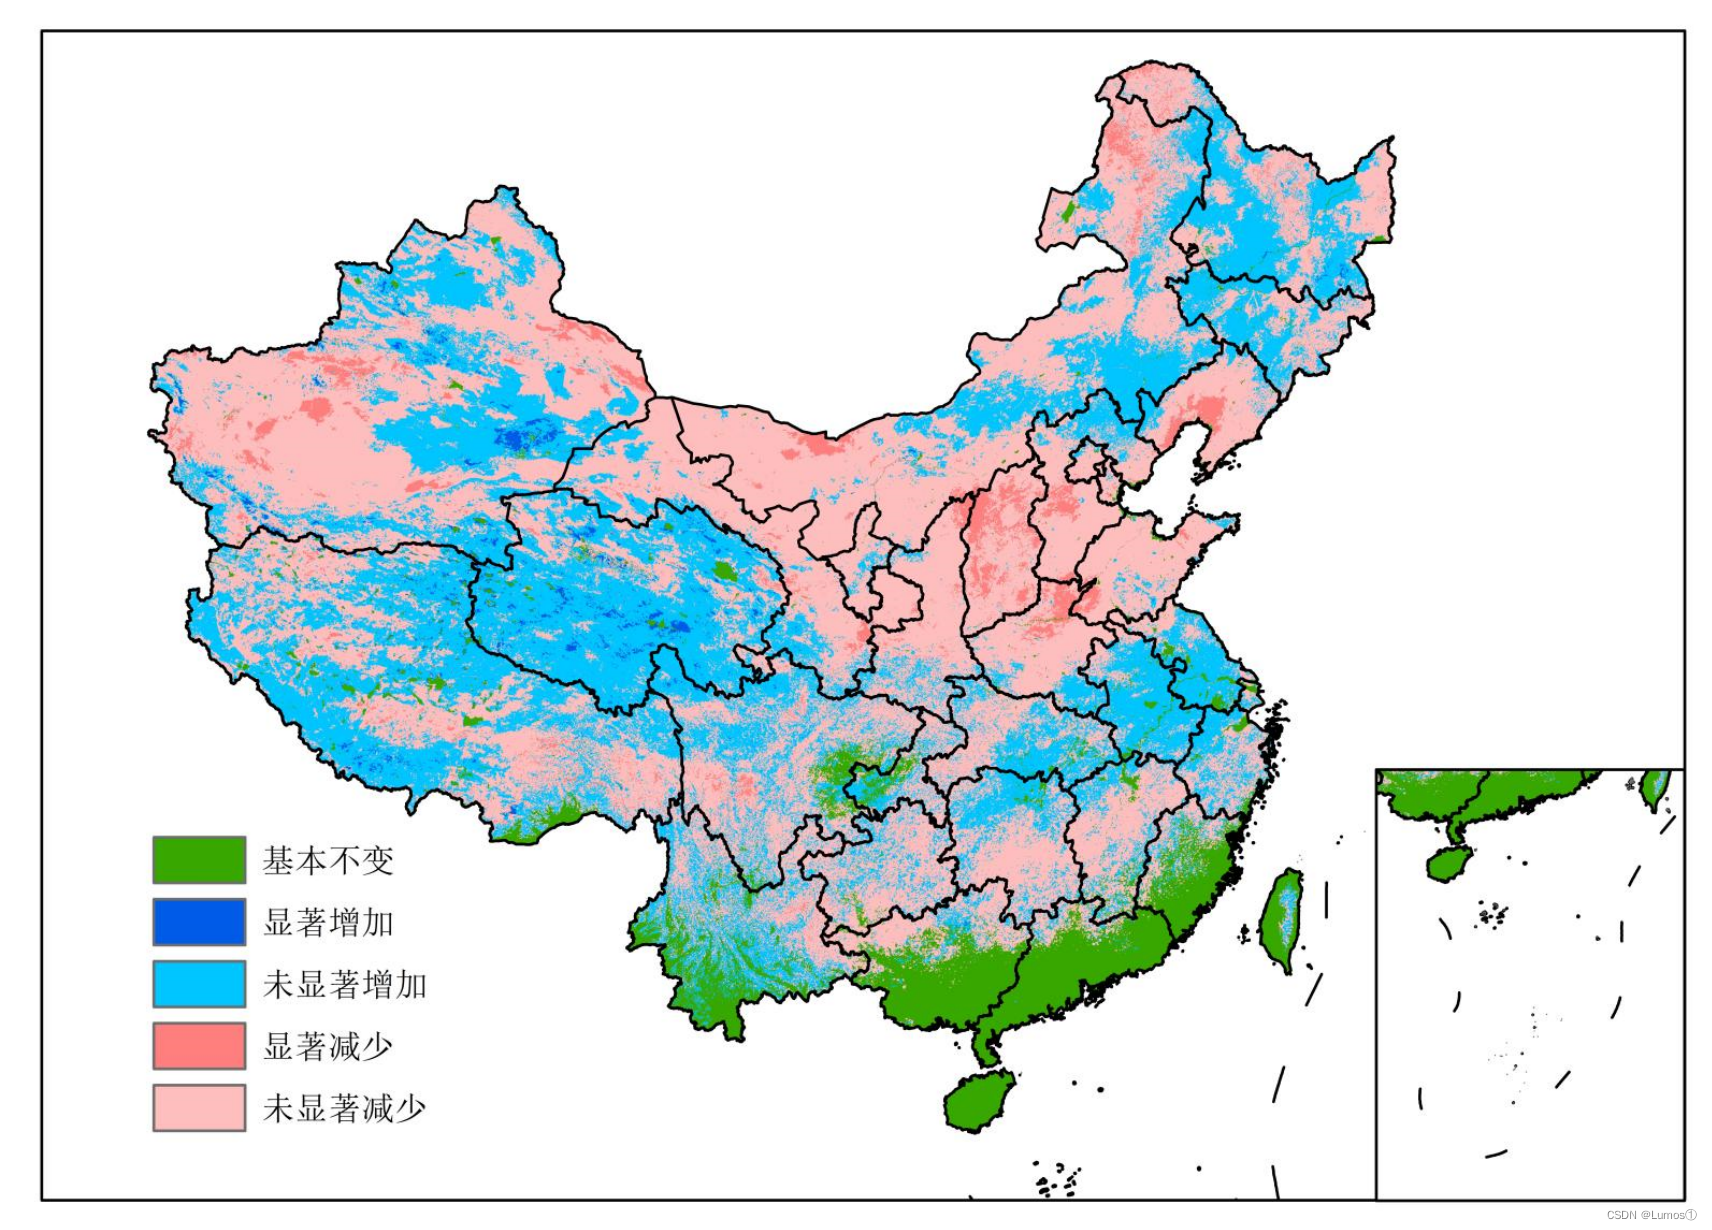
利用趋势分析的Slope方法得到趋势(还是需要去学一下MK检验):
本文所有的资源在我的同名资源下,刚上传,还在审核,后面有时间再添加
