效果图
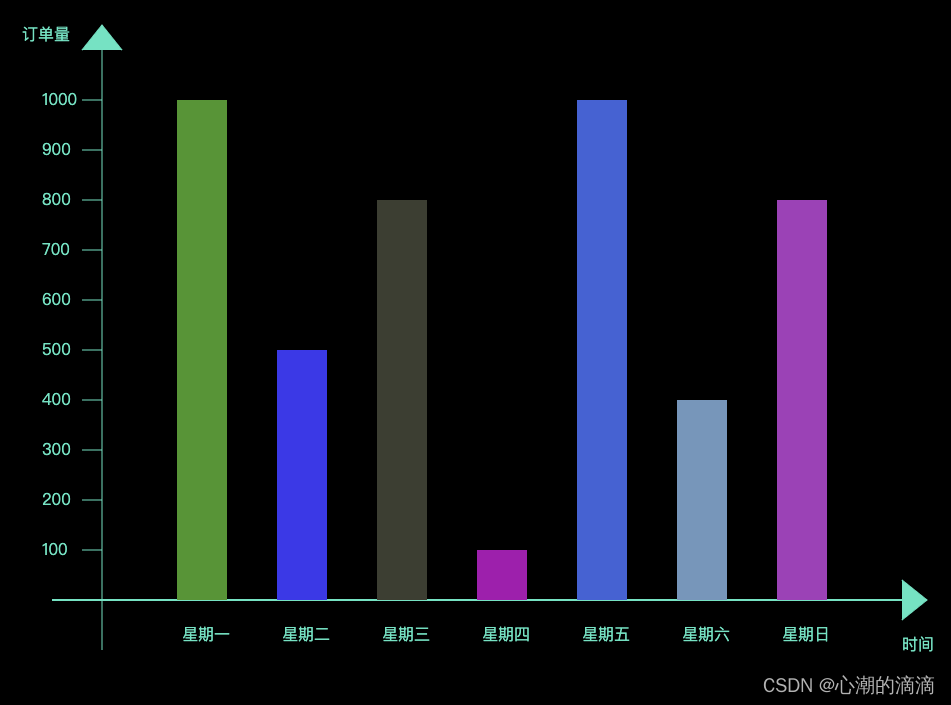
定义背景色和坐标轴颜色
 :root {
   	--cord-color: #2be7ca;
}
 body {
     background-color: #000;
 }
画坐标轴
画X轴
<!-- 坐标轴 -->
<g id="cordinate">
     <!-- x轴 -->
     <line x1="50" y1="600" x2="900" y2="600" stroke="var(--cord-color)" stroke-width="2" />" stroke-width="1"></line>
     <path d="M 900,580 L 925,600 L 900,620" fill="var(--cord-color)" stroke="var(--cord-color)" stroke-width="1"></path>
     <text x="20" y="40" fill="var(--cord-color)">订单量</text>
 </g>
画Y轴
<!-- y轴 -->
 <line x1="100" y1="650" x2="100" y2="50" stroke="var(--cord-color)" stroke-width="1"></line>
 <path d="M 80,50 L 100,25 L 120,50" fill="var(--cord-color)" stroke="var(--cord-color)" stroke-width="1"></path>
 <text x="900" y="650" fill="var(--cord-color)">时间</text>
画刻度
首先定义假数据
const data = [
    {
        time: "星期一",
        orders: 1000
    },
    {
        time: "星期二",
        orders: 500
    },
    {
        time: "星期三",
        orders: 800
    },
    {
        time: "星期四",
        orders: 100
    },
    {
        time: "星期五",
        orders: 1000
    },
    {
        time: "星期六",
        orders: 400
    },
    {
        time: "星期日",
        orders: 800
    }
]
画X轴刻度
<!-- x轴刻度 -->
<g id="xkedu"></g>
使用JavaScript来渲染
// 计算x轴刻度及条形图
const xjgLength = 700 / data.length;
const xkedu = document.getElementById("xkedu");
for (let i = 1; i <= data.length; i++) {
   render(100 + i * xjgLength, i)
}
// 绘制x轴刻度
const render = (posX, index) => {
     const lineDom = document.createElement("line");
     lineDom.setAttribute("stroke", "var(--cord-color)");
     lineDom.setAttribute("stroke-width", "1");
     lineDom.setAttribute("x1", posX);
     lineDom.setAttribute("y1", "600");
     lineDom.setAttribute("x2", posX);
     lineDom.setAttribute("y2", "580");
     xkedu.innerHTML += lineDom.outerHTML
     xkedu.innerHTML += `<text x="${posX - 20}" y="640" fill="var(--cord-color)">${data[index - 1].time}</text>`
 }
画Y轴刻度
<!-- y轴刻度 -->
<g id="ykedu"></g>
渲染
const ykedu = document.getElementById("ykedu");
const yjgLength = 350 / data.length;
for (let i = 1; i <= 10; i++) {
    renderYKedu(600 - i * yjgLength, i)
}
// 绘制y轴刻度
const renderYKedu = (posY, num) => {
   const lineDom = document.createElement("line");
    lineDom.setAttribute("stroke", "var(--cord-color)");
    lineDom.setAttribute("stroke-width", "1");
    lineDom.setAttribute("x1", "100");
    lineDom.setAttribute("y1", posY);
    lineDom.setAttribute("x2", "80");
    lineDom.setAttribute("y2", posY);
    ykedu.innerHTML += lineDom.outerHTML
    ykedu.innerHTML += `<text x="40" y="${posY + 5}" fill="var(--cord-color)">${100 * num}</text>`
}
绘制条形图
这里,我们可以直接在绘制x轴刻度的同时绘制条形图
<!-- 条形图 -->
<g id="barList"></g>
const barList = document.getElementById("barList");
const render = (posX, index) => {
   // 绘制条形图
   const color = `rgb(${parseInt(Math.random() * 255)}, ${parseInt(Math.random() * 255)}, ${parseInt(Math.random() * 255)})`
   barList.innerHTML += `<rect x="${posX - 25}" y="${600 - data[index - 1].orders / 2}" width="50" height="${data[index - 1].orders / 2}" fill="${color}"></rect>`
}
