提示:文章写完后,目录可以自动生成,如何生成可参考右边的帮助文档
文章目录
- 1.解决坐标轴刻度负号乱码
- 2.解决中文乱码问题
- 3.折线图Series.plot()&DataFrame.plot()
- 4.条形图
- 5.箱线图
- 6.区域面积图(堆积折线图)
- 7.散点图
- 8.饼图
1.解决坐标轴刻度负号乱码
import matplotlib.pyplot as plt
plt.rcParams['axes.unicode_minus']=False
2.解决中文乱码问题
# 以下方式二选一
plt.rcParams['font.sans-serif']=['Simhei']
plt.rcParams['font.sans-serif'] = ['Microsoft YaHei']
3.折线图Series.plot()&DataFrame.plot()
- Series.plot():
kind:line(折线图),bar(垂直条形图)、barh(水平条形图)、hist(直方图)、box(箱型图)、kde(核密度估计图)与density相同,area(面积图)、pie(饼图)
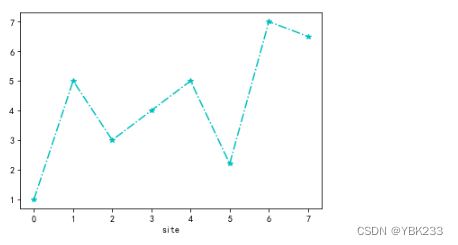
da = pd.Series([1,5,3,4,5,2.2,7,6.5])
da.index.name='site'
da.plot(kind='line',linestyle='-.',color='c',marker='*')
- DataFrame.plot():
kind:line(折线图,默认),bar或barh(条形图)、hist(频率柱状图)、box(箱型图)、kde(密度图,需引用scipy包)与density相同,area(区域图,不同区域面积占比)、pie(饼图)、scatter(散点图)、hexbin()
da = pd.DataFrame({'A':[3,5,3,4,5,5,7,6.5],'B':[2,6,2,1,7,2.4,6,8.3]})
da.plot(kind='line',linestyle='-',color='c',marker='o',
        xticks=[2,4,6,8,10],yticks=[2,4,6,8,10],xlim=[-1,9],title='对比折线图')

4.条形图
da = pd.Series([1,5,3,4,5,2.2,7,6.5])
da.index=['a','b','c','d','e','f','g','h']
da.index.name='site'
da.plot(kind='bar',fontsize=12)

da = pd.DataFrame({'A':[3,5,3,4,5,5,7,6.5],'B':[2,6,2,1,7,2.4,6,8.3]})
da.index=['a','b','c','d','e','f','g','h']
da.index.name='site'
da.plot(kind='bar',fontsize=12)

直方图是一种可以对值频率进行离散化显示的柱状图。数据点被拆分到离散的、间隔均匀的面元中,绘制的是各面元中数据点的数量,bins=20表示数值分辨率,具体来说是将随机数设定一个范围
a = np.random.randn(100)

df = pd.DataFrame({'length':a})
df.plot.hist(bins=20)

df = pd.DataFrame({'a':np.random.randn(100)+1,'b':np.random.randn(100),'c':np.random.randn(100)-1},
                  index=range(1,101),columns=['a','b','c'])

df.plot.hist()


下图是对数值进行累加,并绘制横向直方图,横轴表示频率,cumulative=True表示将频率从大到小排列


df.diff().hist()的效果是将DataFrame当中column分开,即将a,b,c分开绘制成三张图,df.diff().hist()可达到这个效果

5.箱线图
线条从上到下分布表示:最小值,第一四分位、中位数、第三四分和最大值
- 绘制方法:
Series.plot.box()
DataFrame.boxplot()
DataFrame.plot.box() - 参数:
boxes:盒身
whiskers:盒须
medians:中位数
caps:最大值,最小值

df.plot.box(color=dict(boxes='c',whiskers='r',medians='b',caps='g'),sym='r+') #sym设置极端值样式

水平箱线图

6.区域面积图(堆积折线图)
np.random.seed(80)
a=np.random.rand(10,5)

df = pd.DataFrame(a,columns=['a','b','c','d','e'])

df.plot.area()#生成堆积图


7.散点图
np.random.seed(80)
a=np.random.rand(10,5)

df = pd.DataFrame(a,columns=['a','b','c','d','e'])

df.plot.scatter(x='b',y='a')

图形嵌套

8.饼图
Series.plot.pie()
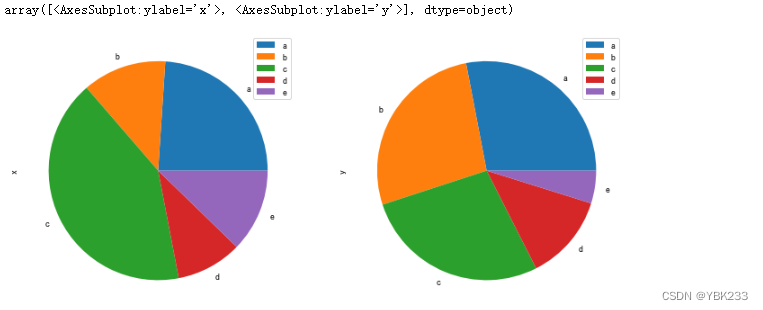
DataFrame.plot.pie()
np.random.seed(80)

df = pd.Series(np.random.rand(5),index=['a','b','c','d','e'],name='series')
df.plot.pie(figsize=(6,6))

np.random.seed(80)

df = pd.DataFrame(np.random.rand(5,2),index=['a','b','c','d','e'],columns=['x','y'])
df.plot.pie(subplots=True, figsize=(12,6))
