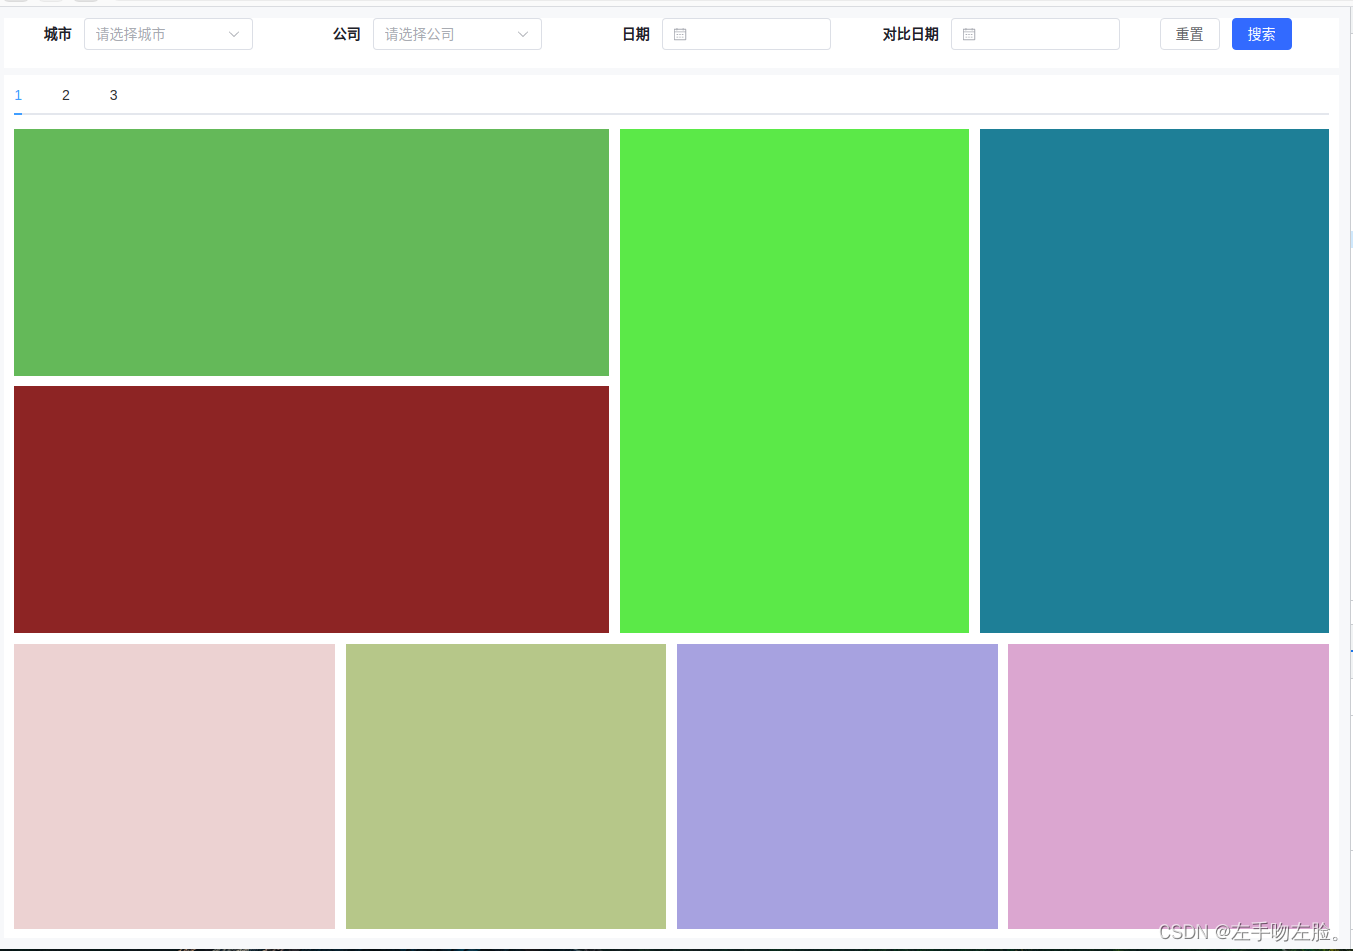
一、布局
<template>
    <div class="container1">
        <div class="form white">
            <el-form :inline="true" :rules="rules" :model="queryParams" label-width="80px" ref="querParmRef">
                <el-form-item label="城市" prop="cityId">

                    <el-select v-model="queryParams.cityId" clearable filterable placeholder="请选择城市" style="width: 169px">
                        <el-option v-for="item in citylists" :key="item.english" :label="item.english"
                            :value="item.chinese">
                        </el-option> </el-select>

                </el-form-item>
                <el-form-item label="公司" prop="companyId">

                    <el-select v-model="queryParams.companyId" clearable filterable placeholder="请选择公司"
                        style="width: 169px">
                        <el-option v-for="item in citylists" :key="item.english" :label="item.english"
                            :value="item.chinese">
                        </el-option> </el-select>

                </el-form-item>
                <el-form-item label="日期" prop="date">
                    <el-date-picker v-model="queryParams.date" value-format="YYYY-MM-DD" style="width: 169px" type="date"
                        placeholder="" />

                </el-form-item>

                <el-form-item label="对比日期" prop="date">
                    <el-date-picker v-model="queryParams.date" value-format="YYYY-MM-DD" style="width: 169px" type="date"
                        placeholder="" />

                </el-form-item>
                <el-form-item>
                    <el-button @click="resetQuery">重置</el-button>
                    <el-button type="primary" @click="btntop()" class="btnClick">搜索</el-button>
                </el-form-item>

                <!-- <el-form-item label="起止时间">
                    <el-date-picker style="width: 358px" v-model="queryParams.timeValue" type="datetimerange"
                        range-separator="-" value-format="YYYY-MM-DD HH:mm:ss" start-placeholder="开始时间"
                        end-placeholder="结束时间" :size="size" />
                </el-form-item> -->
                <div>
                </div>
            </el-form>
        </div>

        <div class="echartsBot white">
            <el-tabs v-model="activeName" class="tabs">
                <el-tab-pane label="1" name="first"></el-tab-pane>
                <el-tab-pane label="2" name="second">2</el-tab-pane>
                <el-tab-pane label="3" name="third">3</el-tab-pane>
            </el-tabs>
            <!-- 上部分 -->
            <div class="top">
                <!-- 左边 -->
                <div class="left">
                    <div class="chart chart1"></div>
                    <div class="chart chart2"></div>
                </div>
                <!-- 中间 -->
                <div class="middle">
                    <div class="chart chart3"></div>
                </div>
                <!-- 右边 -->
                <div class="right">
                    <div class="chart chart4"></div>
                </div>
            </div>
            <!-- 下部分 -->
            <div class="bottom">
                <div class="chart chart5"></div>
                <div class="chart chart6"></div>
                <div class="chart chart7"></div>
                <div class="chart chart8"></div>
            </div>
        </div>
    </div>
</template>

<style scoped lang="scss">
.container1 {
    padding: calc(100vw * 15 / 1920);
    display: flex;
    flex-direction: column;
    /* 设置垂直方向排列 */
    height: 100%;
    width: 100%;
    background-color: #F7F8FA;

}

.white {
    background-color: #fff;
}

.echartsBot {
    flex: 1;
    width: 100%;
    padding: 0 calc(100vw * 15 / 1920) calc(100vw * 15 / 1920);
    margin-top: calc(100vw * 10 / 1920);
}

.titles1 {
    width: 100%;
    height: calc(100vw * 20 / 1920);
    font-size: calc(100vw * 14 / 1920);
    font-weight: 600;
    color: #1d2129;
    line-height: calc(100vw * 20 / 1920);
    padding-left: 1vh;
}


/* 上部分 */
.echartsBot .top {
    display: flex;
    height: calc(65% - 50px)
}

/* 左边 */
.echartsBot .left {
    width: 46%;
    display: flex;
    flex-direction: column;
    margin-right: calc(100vw * 15 / 1920);

}

/* 中间 */
.echartsBot .middle {
    width: 27%;
    background-color: #5be948;
    margin-right: calc(100vw * 15 / 1920);

}

/* 右边 */
.echartsBot .right {
    width: 27%;
    background-color: #1e7f97;

}

/* 柱状图 */
.echartsBot .chart {
    /* 修改为需要的宽度和高度 */
    // width: 300px;
    // height: 200px;
}

/* 左边的柱状图 */
.echartsBot .left .chart1 {
    /* 样式设置 */
    flex:1;
    margin-bottom: calc(100vw * 15 / 1920);
    background-color: #64b959;

}

.echartsBot .left .chart2 {
    /* 样式设置 */
    flex:1;
    background-color: #8d2424;

}

/* 中间的柱状图 */
.echartsBot .middle .chart3 {
    /* 样式设置 */
}

/* 右边的柱状图 */
.echartsBot .right .chart4 {
    /* 样式设置 */
}

/* 下部分 */
.echartsBot .bottom {
    display: flex;
    // height: 40%;
    margin-top: calc(100vw * 15 / 1920); // height: calc(50%- 10px);
    height: calc(35% - calc(100vw * 19 / 1920));
}

/* 底部柱状图 */
.echartsBot .bottom .chart {
    /* 修改为需要的宽度和高度 */
    // width: 200px;
    // height: 150px;
}

.echartsBot .bottom .chart5 {
    /* 样式设置 */
    flex: 1;
    background-color: #ecd2d2;
    height: 100%;
    margin-right: calc(100vw * 15 / 1920);


}

.echartsBot .bottom .chart6 {
    /* 样式设置 */
    flex: 1;
    margin-right: calc(100vw * 15 / 1920);

    background-color: #b6c789;
    height: 100%;

}

.echartsBot .bottom .chart7 {
    /* 样式设置 */
    flex: 1;
    margin-right: calc(100vw * 15 / 1920);

    background-color: #a7a2e0;
    height: 100%;

}

.echartsBot .bottom .chart8 {
    /* 样式设置 */
    flex: 1;

    background-color: #dba6d0;
    height: 100%;

}
</style>
上面效果图的代码,用的flex布局,宽高边距都用了动态的,浏览器窗口大小改变也会自适应
二、分完模块优化
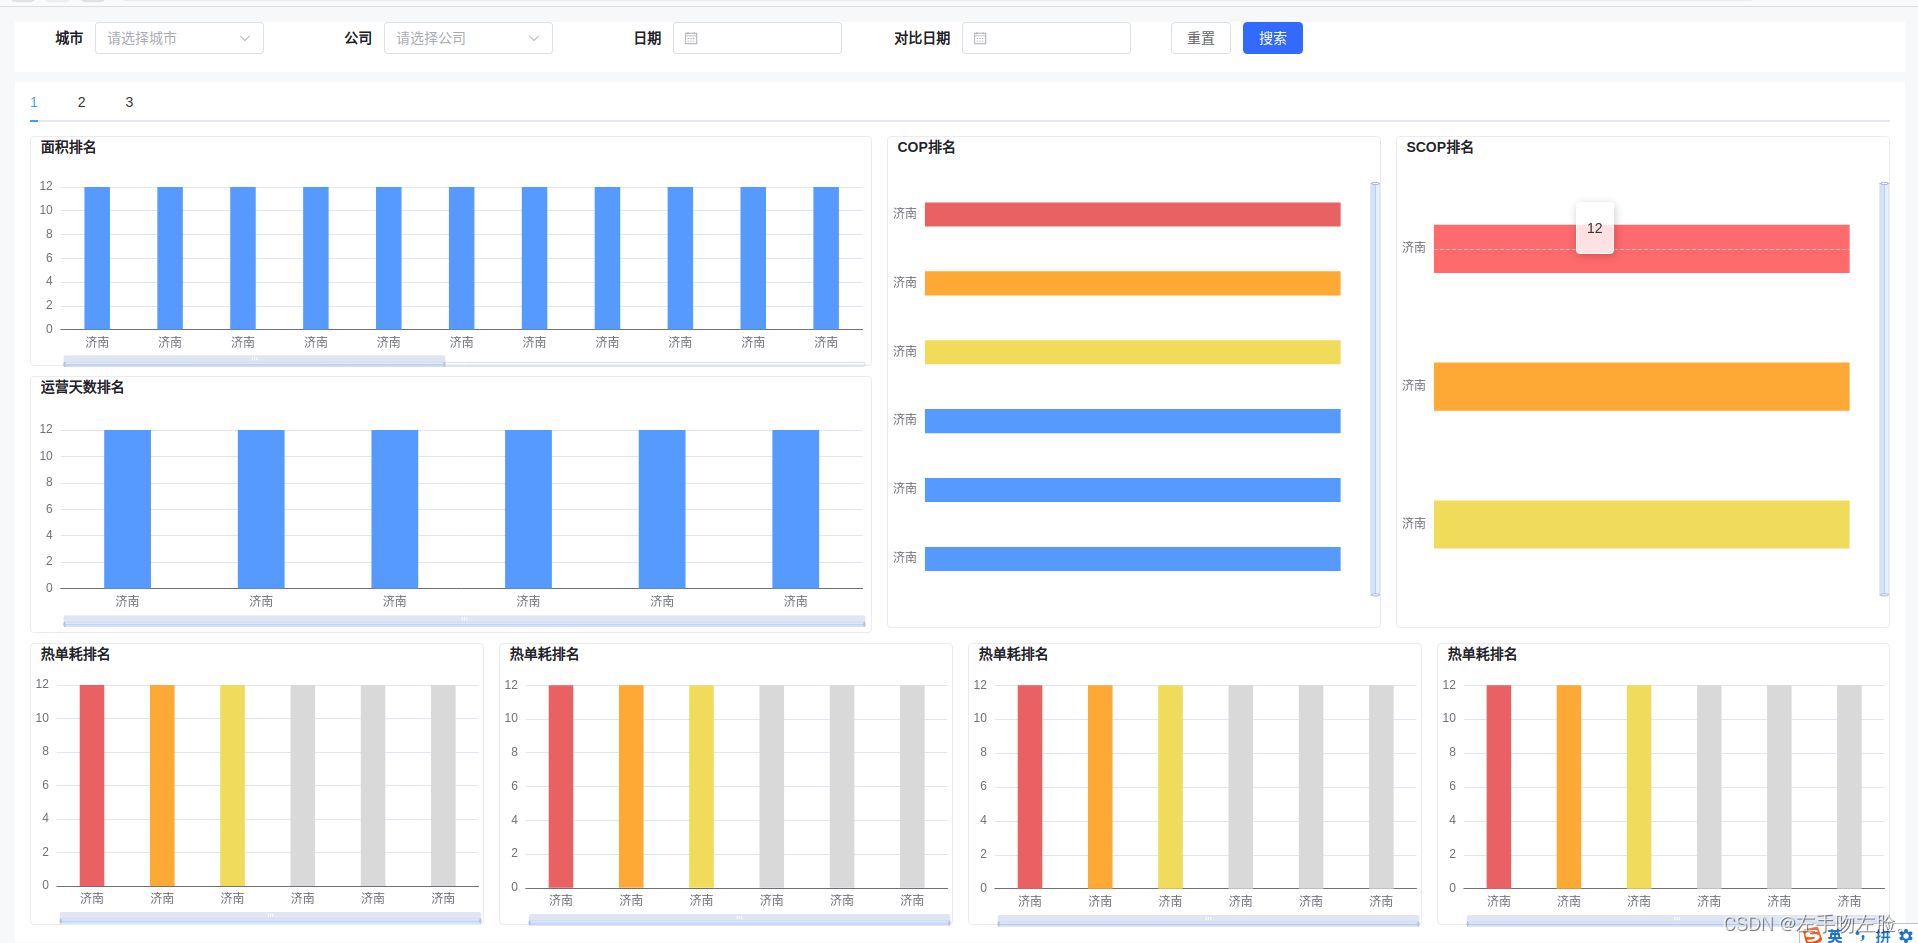
最终效果图如上
完整版代码
<template>
    <div class="container1">
        <div class="form white">
            <el-form :inline="true" :rules="rules" :model="queryParams" label-width="80px" ref="querParmRef">
                <el-form-item label="城市" prop="cityId">

                    <el-select v-model="queryParams.cityId" clearable filterable placeholder="请选择城市" style="width: 169px">
                        <el-option v-for="item in citylists" :key="item.english" :label="item.english"
                            :value="item.chinese">
                        </el-option> </el-select>

                </el-form-item>

                <el-form-item label="公司" prop="companyId">

                    <el-select v-model="queryParams.companyId" clearable filterable placeholder="请选择公司"
                        style="width: 169px">
                        <el-option v-for="item in citylists" :key="item.english" :label="item.english"
                            :value="item.chinese">
                        </el-option> </el-select>

                </el-form-item>
                <el-form-item label="日期" prop="date">
                    <el-date-picker v-model="queryParams.date" value-format="YYYY-MM-DD" style="width: 169px" type="date"
                        placeholder="" />

                </el-form-item>

                <el-form-item label="对比日期" prop="date">
                    <el-date-picker v-model="queryParams.date" value-format="YYYY-MM-DD" style="width: 169px" type="date"
                        placeholder="" />

                </el-form-item>
                <el-form-item>
                    <el-button @click="resetQuery">重置</el-button>
                    <el-button type="primary" @click="btntop()" class="btnClick">搜索</el-button>
                </el-form-item>

                <!-- <el-form-item label="起止时间">
                    <el-date-picker style="width: 358px" v-model="queryParams.timeValue" type="datetimerange"
                        range-separator="-" value-format="YYYY-MM-DD HH:mm:ss" start-placeholder="开始时间"
                        end-placeholder="结束时间" :size="size" />
                </el-form-item> -->
                <div>
                </div>
            </el-form>
        </div>

        <div class="echartsBot white">
            <el-tabs v-model="activeName" class="tabs">
                <el-tab-pane label="1" name="first"></el-tab-pane>
                <!-- <el-tab-pane label="冷热能效耗能排名总览" name="first"></el-tab-pane> -->
                <el-tab-pane label="2" name="second">2</el-tab-pane>
                <el-tab-pane label="3" name="third">3</el-tab-pane>
            </el-tabs>
            <!-- 上部分 -->
            <div class="top">
                <!-- 左边 -->
                <div class="left">
                    <div class="chart chart1">
                        <div class="titles1">面积排名</div>
                        <Echarts1 :echartList="echartList1" />

                    </div>
                    <div class="chart chart2">
                        <div class="titles1">运营天数排名</div>

                        <Echarts2 :echartList="echartList2" />

                    </div>
                </div>
                <!-- 中间 -->
                <div class="middle">
                    <div class="titles1">COP排名</div>
                    <Echarts3 :echartList="echartList3" />

                    <!-- <div class="chart chart3"></div> -->

                </div>
                <!-- 右边 -->
                <div class="right">
                    <div class="titles1">SCOP排名</div>
                    <Echarts4 :echartList="echartList4" />
                </div>
            </div>
            <!-- 下部分 -->
            <div class="bottom">
                <div class="chart chart5">
                    <div class="titles1">热单耗排名</div>

                    <Echarts5 :echartList="echartList5" />

                </div>
                <div class="chart chart6">
                    <div class="titles1">热单耗排名</div>

                    <Echarts6 :echartList="echartList6" />
                </div>
                <div class="chart chart7">
                    <div class="titles1">热单耗排名</div>

                    <Echarts7 :echartList="echartList7" />
                </div>
                <div class="chart chart8">
                    <div class="titles1">热单耗排名</div>

                    <Echarts8 :echartList="echartList8" />
                </div>
            </div>
        </div>
    </div>
</template>
<script setup>
import { ElMessageBox, ElMessage, ElLoading } from "element-plus";
import Echarts1 from "./echarts/echarts1.vue";
import Echarts2 from "./echarts/echarts2.vue";
import Echarts3 from "./echarts/echarts3.vue";
import Echarts4 from "./echarts/echarts4.vue";
import Echarts5 from "./echarts/echarts5.vue";
import Echarts6 from "./echarts/echarts6.vue";
import Echarts7 from "./echarts/echarts7.vue";
import Echarts8 from "./echarts/echarts8.vue";
const { proxy } = getCurrentInstance();
import { parseTime } from "@/utils/ruoyi";
import { useRoute } from "vue-router";

const echartList1 = ref([
    { cityName: '济南', parkArea: 12 }, { cityName: '济南', parkArea: 12 }, { cityName: '济南', parkArea: 12 },
    { cityName: '济南', parkArea: 12 }, { cityName: '济南', parkArea: 12 }, { cityName: '济南', parkArea: 12 },
    { cityName: '济南', parkArea: 12 }, { cityName: '济南', parkArea: 12 }, { cityName: '济南', parkArea: 12 },
    { cityName: '济南', parkArea: 12 }, { cityName: '济南', parkArea: 12 }, { cityName: '济南', parkArea: 12 },
    { cityName: '济南', parkArea: 12 }, { cityName: '济南', parkArea: 12 }, { cityName: '济南', parkArea: 12 },
    { cityName: '济南', parkArea: 12 }, { cityName: '济南', parkArea: 12 }, { cityName: '济南', parkArea: 12 },
    { cityName: '济南', parkArea: 12 }, { cityName: '济南', parkArea: 12 }, { cityName: '济南', parkArea: 12 },
]);
const echartList2 = ref([
    { cityName: '济南', parkArea: 12 }, { cityName: '济南', parkArea: 12 }, { cityName: '济南', parkArea: 12 },
    { cityName: '济南', parkArea: 12 }, { cityName: '济南', parkArea: 12 }, { cityName: '济南', parkArea: 12 },


]);
const echartList3 = ref([
    { cityName: '济南', parkArea: 12 }, { cityName: '济南', parkArea: 12 }, { cityName: '济南', parkArea: 12 },
    { cityName: '济南', parkArea: 12 }, { cityName: '济南', parkArea: 12 }, { cityName: '济南', parkArea: 12 },


]);
const echartList4 = ref([
    { cityName: '济南', parkArea: 12 }, { cityName: '济南', parkArea: 12 }, { cityName: '济南', parkArea: 12 }


])
const echartList5 = ref([
    { cityName: '济南', parkArea: 12 }, { cityName: '济南', parkArea: 12 }, { cityName: '济南', parkArea: 12 },
    { cityName: '济南', parkArea: 12 }, { cityName: '济南', parkArea: 12 }, { cityName: '济南', parkArea: 12 }


])
const echartList6 = ref([
    { cityName: '济南', parkArea: 12 }, { cityName: '济南', parkArea: 12 }, { cityName: '济南', parkArea: 12 }, { cityName: '济南', parkArea: 12 }, { cityName: '济南', parkArea: 12 }, { cityName: '济南', parkArea: 12 }


])
const echartList7 = ref([
    { cityName: '济南', parkArea: 12 }, { cityName: '济南', parkArea: 12 }, { cityName: '济南', parkArea: 12 }, { cityName: '济南', parkArea: 12 }, { cityName: '济南', parkArea: 12 }, { cityName: '济南', parkArea: 12 }


])
const echartList8 = ref([
    { cityName: '济南', parkArea: 12 }, { cityName: '济南', parkArea: 12 }, { cityName: '济南', parkArea: 12 }, { cityName: '济南', parkArea: 12 }, { cityName: '济南', parkArea: 12 }, { cityName: '济南', parkArea: 12 }


])
const activeName = ref('first')
</script>
<style scoped lang="scss">
.container1 {
    padding: calc(100vw * 15 / 1920);
    display: flex;
    flex-direction: column;
    /* 设置垂直方向排列 */
    height: 100%;
    width: 100%;
    background-color: #F7F8FA;

}

.white {
    background-color: #fff;
}

.echartsBot {
    flex: 1;
    width: 100%;
    padding: 0 calc(100vw * 15 / 1920) ;
    margin-top: calc(100vw * 10 / 1920);
}

.titles1 {
    width: 100%;
    height: calc(100vw * 20 / 1920);
    font-size: calc(100vw * 14 / 1920);
    font-weight: 600;
    color: #1d2129;
    line-height: calc(100vw * 20 / 1920);
    padding-left: 1vh;
}


/* 上部分 */
.echartsBot .top {
    display: flex;
    height: calc(63% - 50px)
}

/* 左边 */
.echartsBot .left {
    width: 46%;
    display: flex;
    flex-direction: column;
    margin-right: calc(100vw * 15 / 1920);

}

/* 中间 */
.echartsBot .middle {
    width: 27%;
    // padding: calc(100vw * 15 / 1920);

    margin-right: calc(100vw * 15 / 1920);
    border-radius: 4px 4px 4px 4px;
    border: 1px solid rgba(61, 61, 61, 0.1);
}

/* 右边 */
.echartsBot .right {
    width: 27%;
    // padding: calc(100vw * 15 / 1920);

    border-radius: 4px 4px 4px 4px;
    border: 1px solid rgba(61, 61, 61, 0.1);
}

/* 柱状图 */
.chart {
    /* 修改为需要的宽度和高度 */
    // width: 300px;
    // height: 200px;
    // padding: calc(100vw * 15 / 1920);

}

/* 左边的柱状图 */
.echartsBot .left .chart1 {
    /* 样式设置 */
    height: calc(50% - calc(100vw * 16 / 1920));
    margin-bottom: calc(100vw * 10 / 1920);
    border-radius: 4px 4px 4px 4px;
    border: 1px solid rgba(61, 61, 61, 0.1);
}

.echartsBot .left .chart2 {
    /* 样式设置 */
    flex: 1;
    border-radius: 4px 4px 4px 4px;
    border: 1px solid rgba(61, 61, 61, 0.1);
}

/* 中间的柱状图 */
.echartsBot .middle .chart3 {
    /* 样式设置 */
}

/* 右边的柱状图 */
.echartsBot .right .chart4 {
    /* 样式设置 */
}

/* 下部分 */
.echartsBot .bottom {
    display: flex;
    // height: 40%;
    margin-top: calc(100vw * 15 / 1920); // height: calc(50%- 10px);
    height: calc(35% - calc(100vw * 19 / 1920));
}

/* 底部柱状图 */
.echartsBot .bottom .chart {
    /* 修改为需要的宽度和高度 */
    // width: 200px;
    // height: 150px;
}

.echartsBot .bottom .chart5 {
    /* 样式设置 */
    flex: 1;
    height: 100%;
    margin-right: calc(100vw * 15 / 1920);
    border-radius: 4px 4px 4px 4px;
    border: 1px solid rgba(61, 61, 61, 0.1);

}

.echartsBot .bottom .chart6 {
    /* 样式设置 */
    flex: 1;
    margin-right: calc(100vw * 15 / 1920);

    height: 100%;
    border-radius: 4px 4px 4px 4px;
    border: 1px solid rgba(61, 61, 61, 0.1);
}

.echartsBot .bottom .chart7 {
    /* 样式设置 */
    flex: 1;
    margin-right: calc(100vw * 15 / 1920);

    height: 100%;
    border-radius: 4px 4px 4px 4px;
    border: 1px solid rgba(61, 61, 61, 0.1);
}

.echartsBot .bottom .chart8 {
    /* 样式设置 */
    flex: 1;

    height: 100%;
    border-radius: 4px 4px 4px 4px;
    border: 1px solid rgba(61, 61, 61, 0.1);
}
</style>
具体echarts图
第一个
<template>
  <div id="echarts1"></div>
</template>

<script setup>
import * as echarts from "echarts";
const emit = defineEmits();

const props = defineProps({
  echartList: {
    default: [],
  },
});
const initChart = () => {
  let xdata = [];
  let ydata1 = [];
  let xdataid = [];
  props.echartList.forEach((item) => {
    xdata.push(item.cityName);
    xdataid.push(item.cityId);
    ydata1.push(item.parkArea);
  });
  const machart = echarts.init(document.getElementById("echarts1"));
  var defaultShowNum = 10; // 默认显示的数据条数

  var start = 0;
  var end = Math.min(defaultShowNum, xdata.length) / xdata.length * 100;
  var option = {
    tooltip: {
      trigger: "axis",
      formatter: '{c}', // 修改为只显示名称和数值

      backgroundColor: 'rgba(255,255,255,0.8)', // 气泡框背景颜色
      textStyle: {
        color: '#333', // 文字颜色
        fontSize: 14 // 文字大小
      },
      position: function (pos, params, el, elRect, size) {
        return { left: pos[0], top: pos[1] };
      }, // 设置气泡框的位置在鼠标悬浮的地方
      padding: [10, 10, 10, 10], // 设置气泡框的内边距
      extraCssText: 'width: auto; height: auto; text-align: center; line-height: 30px;', // 设置气泡框的宽度、高度、文本居中显示

    },
    dataZoom: [
      {
        type: 'slider', // 缩放条类型为滑动条
        show: true, // 显示缩放条
        start: start, // 根据数据计算的开始位置
        end: end, // 根据数据计算的结束位置
        bottom: '5%', // 距离底部的距离
        height: 5, // 设置高度
      },
      {
        type: 'inside', // 内置缩放条
        start: start,
        end: end,
      },
    ],
    calculable: true,
    // legend: {
    //   // data: ["xxx"],
    //   left: "left",s
    //   x: "left",
    //   top: "0%",
    //   left: "2%",
    //   icon: "roundRect",
    //   itemWidth: 10, // 设置宽度
    //   itemHeight: 10, // 设置高度
    // },
    color: ["#579AFF", "#B1B1F0", "#F7BEBE", '#BDF6E6'],
    grid: {
      top: "14sss%",
      bottom: "10%",
      left: "1%",
      right: "1%",
      containLabel: true,
    },
    xAxis: [
      {
        type: "category",
        data: xdata,
        axisTick: {
          show: false, // 不显示刻度
        },

      },
    ],
    yAxis: [
      {
        type: "value",

      },
    ],

    series: [
      {
        // name: "城市占比",
        type: "bar",
        data: ydata1,
        barWidth: "35%",
        //   label: { // 添加标签配置
        //   show: true, // 显示标签
        //   position: 'top', // 标签位置为柱子顶部
        //   formatter: '{c} ', // 标签内容格式为数据加单位
        // },
      },

    ],
  };
  machart.setOption(option);
  setTimeout(() => {
    window.addEventListener("resize", resizeFn);
  }, 100);
  const resizeFn = () => {
    return machart.resize();
  };
  machart.on("click", (params) => {
    if (params.componentType === "series") {
      const dataIndex = params.dataIndex;
      const yValue = xdata[dataIndex]; // 获取对应柱子的y值
      const cidtyid = xdataid[dataIndex]; // 获取对应柱子的y值
      emit("changedi", yValue, cidtyid);

      // 在这里你可以对获取到的y值进行其他操作,比如弹窗显示等
    }
  });
};
setTimeout(() => {
  initChart();
}, 800);
defineExpose({
  initChart,
});
onBeforeUnmount(() => {
  // 离开页面必须进行移除,否则会造成内存泄漏,导致卡顿
  window.removeEventListener("resize", initChart);
});
</script>

<style scoped>
#echarts1 {
  width: 100%;
  height: 95%;
  /* height:    calc(30vh- 10px); */
}
</style>
右边两个
<template>
  <div id="echarts3"></div>
</template>

<script setup>
import * as echarts from "echarts";
const emit = defineEmits();

const props = defineProps({
  echartList: {
    default: [],
  },
});
const initChart = () => {
  let xdata = [];
  let ydata1 = [];
  let xdataid = [];
  props.echartList.forEach((item) => {
    xdata.push(item.cityName);
    xdataid.push(item.cityId);
    ydata1.push(item.parkArea);
  });
  const machart = echarts.init(document.getElementById("echarts3"));
  var defaultShowNum = 10; // 默认显示的数据条数

  var start = 0;
  var end = Math.min(defaultShowNum, xdata.length) / xdata.length * 100;
  var option = {
    tooltip: {
      trigger: "axis",
      formatter: '{c}', // 修改为只显示名称和数值

      backgroundColor: 'rgba(255,255,255,0.8)', // 气泡框背景颜色
      textStyle: {
        color: '#333', // 文字颜色
        fontSize: 14 // 文字大小
      },
      position: function (pos, params, el, elRect, size) {
        return { left: pos[0], top: pos[1] };
      }, // 设置气泡框的位置在鼠标悬浮的地方
      padding: [10, 10, 10, 10], // 设置气泡框的内边距
      extraCssText: 'width: auto; height: auto; text-align: center; line-height: 30px;', // 设置气泡框的宽度、高度、文本居中显示

    },
    dataZoom: [
      {
        type: 'slider',
        orient: 'vertical', // 设置为垂直方向
        show: true,
        start: start,
        end: end,
        right: 0, // 距离右侧的距离
        width: 10, // 设置宽度
      },
      {
        type: 'inside', // 内置缩放条
        start: start,
        end: end,
      },
    ],
    calculable: true,
    // legend: {
    //   // data: ["xxx"],
    //   left: "left",s
    //   x: "left",
    //   top: "0%",
    //   left: "2%",
    //   icon: "roundRect",
    //   itemWidth: 10, // 设置宽度
    //   itemHeight: 10, // 设置高度
    // },
    // color: ["#579AFF", "#B1B1F0", "#F7BEBE", '#BDF6E6'],
    grid: {
      top: "5%",
      bottom: "1%",
      left: "1%",
      right: "8%",
      containLabel: true,
    },
    yAxis: [
      {
        type: "category",
        data: xdata.reverse(),
        axisLine: {
          show: false, // 隐藏坐标轴线
        },
        axisTick: {
          show: false, // 不显示刻度线
        },
        axisLabel: {
          show: true, // 显示坐标轴标签
        },
      },
    ],
    xAxis: [
      {
        type: "value",
        show: false, // 不显示x轴
      },
    ],

    series: [
      {
        // name: "城市占比",
        type: "bar",
        data: ydata1.reverse(),
        barWidth: "35%",
        itemStyle: {
          color: function (params) {
            if (params.dataIndex >= xdata.length - 3) {
              // 最后三条数据
              if (params.dataIndex === xdata.length - 1) {
                return '#E96163'; // 设置最后一条数据的颜色
              } else if (params.dataIndex === xdata.length - 2) {
                return '#FEA935'; // 设置倒数第二条数据的颜色
              } else {
                return '#F0DC5A'; // 设置倒数第三条数据的颜色
              }
            } else {
              return '#579AFF'; // 其他数据的颜色
            }
          }
        },

      },

    ],
  };
  machart.setOption(option);
  setTimeout(() => {
    window.addEventListener("resize", resizeFn);
  }, 100);
  const resizeFn = () => {
    return machart.resize();
  };
  machart.on("click", (params) => {
    if (params.componentType === "series") {
      const dataIndex = params.dataIndex;
      const yValue = xdata[dataIndex]; // 获取对应柱子的y值
      const cidtyid = xdataid[dataIndex]; // 获取对应柱子的y值
      emit("changedi", yValue, cidtyid);

      // 在这里你可以对获取到的y值进行其他操作,比如弹窗显示等
    }
  });
};
setTimeout(() => {
  initChart();
}, 800);
defineExpose({
  initChart,
});
onBeforeUnmount(() => {
  // 离开页面必须进行移除,否则会造成内存泄漏,导致卡顿
  window.removeEventListener("resize", initChart);
});
</script>

<style scoped>
#echarts3 {
  width: 100%;
  height: 95%;
  /* height:    calc(30vh- 10px); */
}
</style>
最下面的
<template>
  <div id="echarts8"></div>
</template>

<script setup>
import * as echarts from "echarts";
const emit = defineEmits();

const props = defineProps({
  echartList: {
    default: [],
  },
});
const initChart = () => {
  let xdata = [];
  let ydata1 = [];
  let xdataid = [];
  props.echartList.forEach((item) => {
    xdata.push(item.cityName);
    xdataid.push(item.cityId);
    ydata1.push(item.parkArea);
  });
  const machart = echarts.init(document.getElementById("echarts8"));
  var defaultShowNum = 10; // 默认显示的数据条数

  var start = 0;
  var end = Math.min(defaultShowNum, xdata.length) / xdata.length * 100;
  var option = {
    tooltip: {
      trigger: "axis",
      formatter: '{c}', // 修改为只显示名称和数值

      backgroundColor: 'rgba(255,255,255,0.8)', // 气泡框背景颜色
      textStyle: {
        color: '#333', // 文字颜色
        fontSize: 14 // 文字大小
      },
      position: function (pos, params, el, elRect, size) {
        return { left: pos[0], top: pos[1] };
      }, // 设置气泡框的位置在鼠标悬浮的地方
      padding: [10, 10, 10, 10], // 设置气泡框的内边距
      extraCssText: 'width: auto; height: auto; text-align: center; line-height: 30px;', // 设置气泡框的宽度、高度、文本居中显示

    },
    dataZoom: [
      {
        type: 'slider', // 缩放条类型为滑动条
        show: true, // 显示缩放条
        start: start, // 根据数据计算的开始位置
        end: end, // 根据数据计算的结束位置
        bottom: 10, // 距离底部的距离
        height: 5, // 设置高度
      },
      {
        type: 'inside', // 内置缩放条
        start: start,
        end: end,
      },
    ],
    calculable: true,
    // legend: {
    //   // data: ["xxx"],
    //   left: "left",s
    //   x: "left",
    //   top: "0%",
    //   left: "2%",
    //   icon: "roundRect",
    //   itemWidth: 10, // 设置宽度
    //   itemHeight: 10, // 设置高度
    // },
    color: ["#579AFF", "#B1B1F0", "#F7BEBE", '#BDF6E6'],
    grid: {
      top: "8%",
      bottom: "8%",
      left: "1%",
      right: "1%",
      containLabel: true,
    },
    xAxis: [
      {
        type: "category",
        data: xdata,
        axisTick: {
          show: false, // 不显示刻度
        },

      },
    ],
    yAxis: [
      {
        type: "value",

      },
    ],

    series: [
      {
        // name: "城市占比",
        type: "bar",
        data: ydata1,
        barWidth: "35%",
        itemStyle: {
          color: function (params) {
            // 判断是否为最上面的三个柱子,分别设置为红色、橘色、黄色
            if (params.dataIndex <= 2) {
              return params.dataIndex === 0 ? '#E96163' : params.dataIndex === 1 ? '#FEA935' : '#F0DC5A';
            } else {
              return '#D9D9D9'; // 设置其他柱子的颜色
            }
          }
        },
      },

    ],
  };
  machart.setOption(option);
  setTimeout(() => {
    window.addEventListener("resize", resizeFn);
  }, 100);
  const resizeFn = () => {
    return machart.resize();
  };
  machart.on("click", (params) => {
    if (params.componentType === "series") {
      const dataIndex = params.dataIndex;
      const yValue = xdata[dataIndex]; // 获取对应柱子的y值
      const cidtyid = xdataid[dataIndex]; // 获取对应柱子的y值
      emit("changedi", yValue, cidtyid);

      // 在这里你可以对获取到的y值进行其他操作,比如弹窗显示等
    }
  });
};
setTimeout(() => {
  initChart();
}, 800);
defineExpose({
  initChart,
});
onBeforeUnmount(() => {
  // 离开页面必须进行移除,否则会造成内存泄漏,导致卡顿
  window.removeEventListener("resize", initChart);
});
</script>

<style scoped>
#echarts8 {
  width: 100%;
  height: 95%;
  /* height:    calc(30vh- 10px); */
}
</style>