❤ 作者主页:Java技术一点通的博客
❀ 个人介绍:大家好,我是Java技术一点通!( ̄▽ ̄)~*
🍊 记得关注、点赞、收藏、评论⭐️⭐️⭐️
📣 认真学习,共同进步!!!🎉🎉
课程详情页面功能完善
一、修改课程详情接口
1. 在service_order模块添加接口
OrderController
 //3.根据课程id和用户id查询订单表中订单状态
    @GetMapping("isBuyCourse/{courseId}/{memberId}")
    public boolean isBuyCourse(@PathVariable String courseId, @PathVariable String memberId) {

        QueryWrapper<Order> wrapper = new QueryWrapper<>();
        wrapper.eq("course_id", courseId);
        wrapper.eq("member_id", memberId);
        wrapper.eq("status", 1); //支付状态,1表示以及支付
        int count = orderService.count(wrapper);

        if (count > 0) { //已经支付
            return true;
        } else {
            return false;
        }
    }
2. 在service_edu模块课程详情接口远程调用
-
创建OrderClient接口
@Component
@FeignClient(name = "service-order", fallback = OrderFile.class)
public interface OrdersClient {

    //3.根据课程id和用户id查询订单表中订单状态
    @GetMapping("/eduorder/order/isBuyCourse/{courseId}/{memberId}")
    public boolean isBuyCourse(@PathVariable("courseId") String courseId, @PathVariable("memberId") String memberId);
}
@Component public class OrderFile implements OrdersClient{ @Override public boolean isBuyCourse(String courseId, String memberId) { return false; } } -
在课程详情接口调用
    //课程详情的方法
    @GetMapping("getFrontCourseInfo/{courseId}")
    public R getFrontCourseInfo(@PathVariable String courseId, HttpServletRequest request) {
        //根据课程id,编写sql语句查询课程信息
        CourseWebVo courseWebVo = courseService.getBaseCourseInfo(courseId);

        //根据课程id查询章节和小节
        List<ChapterVo> chapterVideoList = chapterService.getChapterVideoByCourseId(courseId);

        // 根据课程id和用户id查询当前课程是否支付过了
        boolean buyCourse = ordersClient.isBuyCourse(courseId, JwtUtils.getMemberIdByJwtToken(request));

        return R.ok().data("courseWebVo",courseWebVo).data("chapterVideoList",chapterVideoList).data("isBuy", buyCourse);
    }
二、修改课程详情页面
1. 页面内容修改
 <section v-if="isbuy || Number(courseWebVo.price) == 0" class="c-attr-mt">
         <a  href="#" title="立即观看" class="comm-btn c-btn-3">立即观看</a>
 </section>
<section v-else class="c-attr-mt">
        <a @click="createOrders()" href="#" title="立即购买" class="comm-btn c-btn-3">立即购买</a>
  </section>
2. 调用方法修改
<script>
import course from '@/api/course'
export default {
  // asyncData({ params, error }) {
  //   return course.getCourseInfo(params.id)
  //     .then(response => {
  //       return {
  //         courseInfo: response.data.data.courseFrontInfo,
  //         chapterVideoList: response.data.data.chapterVideoList,
  //         isbuy: response.data.data.isbuy,
  //         courseId:params.id
  //       }
  //     })
  // },
   //和页面异步开始的
  asyncData({ params, error }) {
    return {courseId: params.id}

  },
  data() {
    return {
      courseInfo: {},
        chapterVideoList: [],
         isbuy: false,
    }
  },
  created() {
    this.initCourseInfo()
  },
  methods:{
    initCourseInfo() {
      course.getCourseInfo(this.courseId)
        .then(response => {
          this.courseInfo=response.data.data.courseFrontInfo,
          this.chapterVideoList=response.data.data.chapterVideoList,
          this.isbuy=response.data.data.isbuy
        })
    },
    createOrder(){
      course.createOrder(this.courseId).then(response => {
        if(response.data.success){
            this.$router.push({ path: '/order/'+ response.data.data.orderId })
        }
      })
    }
  }
};
</script>
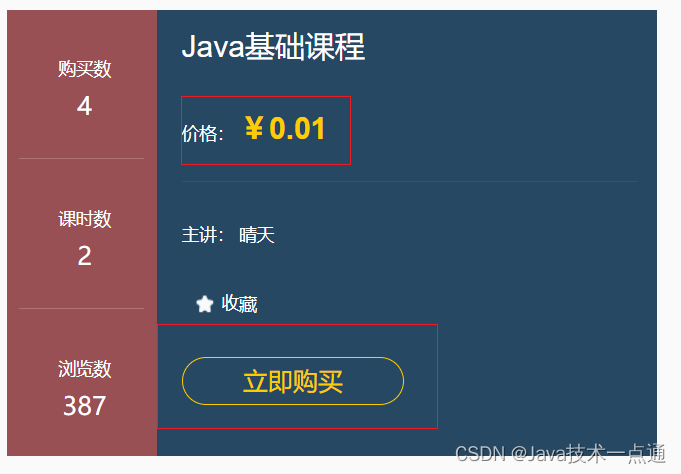
3. 测试


生成统计数据后端开发
一、数据库设计
1. 数据库
guli_statistics
2. 数据表
guli_statistics.sql
#
# Structure for table "statistics_daily"
#

CREATE TABLE `statistics_daily` (
  `id` char(19) NOT NULL COMMENT '主键',
  `date_calculated` varchar(20) NOT NULL COMMENT '统计日期',
  `register_num` int(11) NOT NULL DEFAULT '0' COMMENT '注册人数',
  `login_num` int(11) NOT NULL DEFAULT '0' COMMENT '登录人数',
  `video_view_num` int(11) NOT NULL DEFAULT '0' COMMENT '每日播放视频数',
  `course_num` int(11) NOT NULL DEFAULT '0' COMMENT '每日新增课程数',
  `gmt_create` datetime NOT NULL COMMENT '创建时间',
  `gmt_modified` datetime NOT NULL COMMENT '更新时间',
  PRIMARY KEY (`id`),
  KEY `statistics_day` (`date_calculated`)
) ENGINE=InnoDB DEFAULT CHARSET=utf8 COMMENT='网站统计日数据';

#
# Data for table "statistics_daily"
#
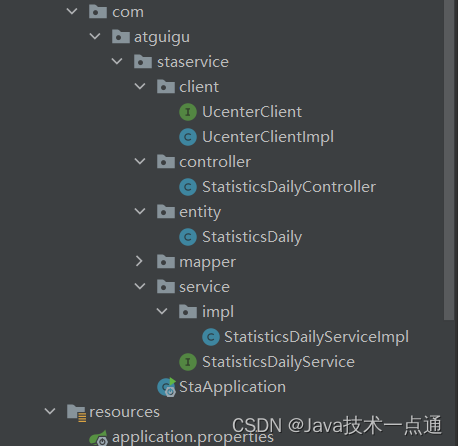
二、创建微服务
1. 在service模块下创建子模块service_statistics

2. MP代码生成器生成代码
public class CodeGenerator {

    @Test
    public void run() {

        // 1、创建代码生成器
        AutoGenerator mpg = new AutoGenerator();

        // 2、全局配置
        GlobalConfig gc = new GlobalConfig();
        String projectPath = System.getProperty("user.dir");
        gc.setOutputDir("D:\\IDEA\\guli_parent\\service\\service_statistics" + "/src/main/java"); //输出目录

        gc.setAuthor("jyu_zwy"); //作者名
        gc.setOpen(false); //生成后是否打开资源管理器
        gc.setFileOverride(false); //重新生成时文件是否覆盖

        gc.setServiceName("%sService");	//去掉Service接口的首字母I
        gc.setIdType(IdType.ID_WORKER_STR); //主键策略
        gc.setDateType(DateType.ONLY_DATE);//定义生成的实体类中日期类型
        gc.setSwagger2(true);//开启Swagger2模式

        mpg.setGlobalConfig(gc);

        // 3、数据源配置
        DataSourceConfig dsc = new DataSourceConfig();
        dsc.setUrl("jdbc:mysql://localhost:3306/guli?useUnicode=true&characterEncoding=UTF-8&serverTimezone=GMT%2B8");
        dsc.setDriverName("com.mysql.cj.jdbc.Driver");
        dsc.setUsername("root");
        dsc.setPassword("abc123");
        dsc.setDbType(DbType.MYSQL);
        mpg.setDataSource(dsc);

        // 4、包配置
        PackageConfig pc = new PackageConfig();

        //生成包:com.atguigu.eduservice
        pc.setModuleName("staservice"); //模块名
        pc.setParent("com.atguigu");

        //生成包:com.atguigu.controller
        pc.setController("controller");
        pc.setEntity("entity");
        pc.setService("service");
        pc.setMapper("mapper");
        mpg.setPackageInfo(pc);

        // 5、策略配置
        StrategyConfig strategy = new StrategyConfig();
        strategy.setInclude("statistics_daily");//根据数据库哪张表生成,有多张表就加逗号继续填写

        strategy.setNaming(NamingStrategy.underline_to_camel);//数据库表映射到实体的命名策略
        strategy.setTablePrefix(pc.getModuleName() + "_"); //生成实体时去掉表前缀

        strategy.setColumnNaming(NamingStrategy.underline_to_camel);//数据库表字段映射到实体的命名策略
        strategy.setEntityLombokModel(true); // lombok 模型 @Accessors(chain = true) setter链式操作

        strategy.setRestControllerStyle(true); //restful api风格控制器
        strategy.setControllerMappingHyphenStyle(true); //url中驼峰转连字符

        mpg.setStrategy(strategy);

        // 6、执行
        mpg.execute();

    }
}
3. application.properties
# 服务端口
server.port=8008

# 服务名
spring.application.name=service-statistics

# mysql数据库连接
spring.datasource.driver-class-name=com.mysql.cj.jdbc.Driver
spring.datasource.url=jdbc:mysql://localhost:3306/guli?serverTimezone=GMT%2B8
spring.datasource.username=root
spring.datasource.password=123456

# 返回json的全局格式
spring.jackson.date-format=yyyy-MM-dd HH:mm:ss
spring.jackson.time-zone=GMT+8

# 配置mybatis xml文件的路径
mybatis-plus.mapper-locations=classpath:com.atguigu.staservice.mapper.xml/*.xml

# mybatis日志
mybatis-plus.configuration.log-impl=org.apache.ibatis.logging.stdout.StdOutImpl

# nacos服务地址
spring.cloud.nacos.discovery.server-addr=localhost:8848

# 开启熔断机制
feign.hystrix.enabled=true

# 设置hystrix超时时间,默认1000ms
#hystrix.command.default.execution.isolation.thread.timeoutInMilliseconds=3000
4. 创建SpringBoot启动类
@SpringBootApplication
@MapperScan("com.atguigu.staservice.mapper")
@ComponentScan("com.atguigu")
@EnableDiscoveryClient
@EnableFeignClients
public class StaApplication {
    public static void main(String[] args) {
        SpringApplication.run(StaApplication.class, args);
    }
}
三、实现服务调用
1. 在service_ucenter模块创建接口,统计某一天的注册人数
-
UcenterMemberController//查询某一天注册人数 @GetMapping("countRegister/{day}") public R countRegister(@PathVariable String day) { Integer count = memberService.countRegisterDay(day); return R.ok().data("countRegister", count); } -
UcenterMemberService//查询某一天注册人数 Integer countRegisterDay(String day); -
UcenterMemberServiceImpl//查询某一天注册人数 @Override public Integer countRegisterDay(String day) { return baseMapper.countRegisterDay(day); } -
UcenterMemberMapperpublic interface UcenterMemberMapper extends BaseMapper<UcenterMember> { //查询某一天注册人数 Integer countRegisterDay(String day); } -
UcenterMemberMapper.xml<!--询某一天注册人数--> <select id="countRegisterDay" resultType="java.lang.Integer"> select count(1) from ucenter_member uc where date(uc.gmt_create) = #{day} </select>
2. 在service_statistics模块创建远程调用接口
创建 client 包和 UcenterClient 接口 和 UcenterClientImpl 实现类:
-
UcenterClient@Component @FeignClient(value = "service-ucenter",fallback = UcenterClientImpl.class) public interface UcenterClient { //根据日期,获取那天注册人数 @GetMapping("/educenter/member/countRegister/{day}") public R countRegister(@PathVariable("day") String day); } -
UcenterClientImpl@Component public class UcenterClientImpl implements UcenterClient{ @Override public R countRegister(String day) { return null; } }
3. 在service_statistics模块调用微服务
-
controller层
@RestController @CrossOrigin @RequestMapping("/staservice/sta") public class StatisticsDailyController { @Autowired private StatisticsDailyService staService; //统计某一天注册的人数,生成统计数据 @PostMapping("registerCount/{day}") public R registerCount(@PathVariable String day) { staService.registerCount(day); return R.ok(); } } -
service层
public interface StatisticsDailyService extends IService<StatisticsDaily> {

    //统计某一天注册的人数,生成统计数据
    void registerCount(String day);
}
@Service public class StatisticsDailyServiceImpl extends ServiceImpl<StatisticsDailyMapper, StatisticsDaily> implements StatisticsDailyService { @Autowired private UcenterClient ucenterClient; //统计某一天注册的人数,生成统计数据 @Override public void registerCount(String day) { //添加记录之前删除相同日期的数据 QueryWrapper<StatisticsDaily> wrapper = new QueryWrapper<>(); wrapper.eq("date_calculated", day); baseMapper.delete(wrapper); //远程调用得到某一天注册人数 R registerR = ucenterClient.countRegister(day); Integer countRegister = (Integer)registerR.getData().get("countRegister"); //把获取数据添加到数据库,统计分析表里面 StatisticsDaily sta = new StatisticsDaily(); sta.setRegisterNum(countRegister); //注册人数 sta.setDateCalculated(day); //统计日期 //TODO sta.setCourseNum(RandomUtils.nextInt(100,200));//新增课程数 sta.setLoginNum(RandomUtils.nextInt(200,300));//登录数 sta.setVideoViewNum(RandomUtils.nextInt(200,300));//视频流量数 baseMapper.insert(sta); } } -
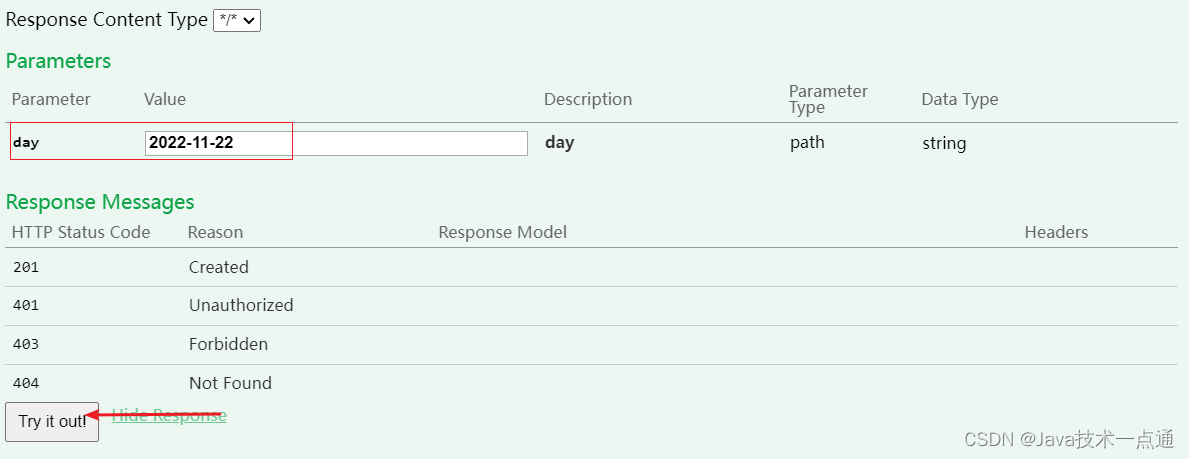
Swagger测试


四、添加定时任务
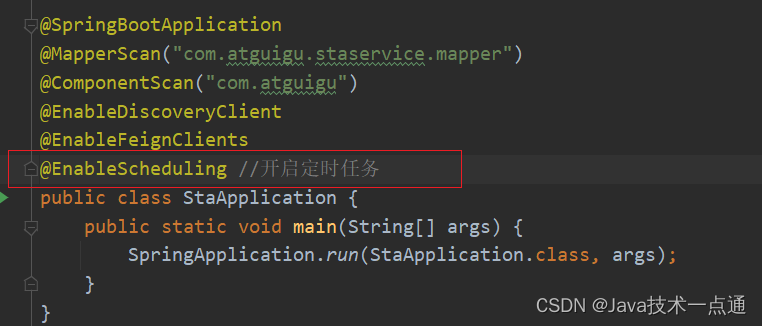
1. 在启动类上添加注解
@EnableScheduling 开启定时任务
2. 创建定时任务类,使用cron表达式
- 测试
@Component
public class ScheduledTask {

    @Autowired
    private StatisticsDailyService staService;

    /**
     * 测试
     * (0/5 * * * * ?):每隔5秒执行一次
     */
    @Scheduled(cron = "0/5 * * * * ?") //指定cron表达式规则
    public void task1(){
        System.out.println("=========task1执行了");
    }
}

3. 添加日期操作工具类
/**
 * 日期操作工具类
 */
public class DateUtil {

    private static final String dateFormat = "yyyy-MM-dd";

    /**
     * 格式化日期
     *
     * @param date
     * @return
     */
    public static String formatDate(Date date) {
        SimpleDateFormat sdf = new SimpleDateFormat(dateFormat);
        return sdf.format(date);

    }

    /**
     * 在日期date上增加amount天 。
     *
     * @param date   处理的日期,非null
     * @param amount 要加的天数,可能为负数
     */
    public static Date addDays(Date date, int amount) {
        Calendar now =Calendar.getInstance();
        now.setTime(date);
        now.set(Calendar.DATE,now.get(Calendar.DATE)+amount);
        return now.getTime();
    }

    public static void main(String[] args) {
        System.out.println(DateUtil.formatDate(new Date()));
        System.out.println(DateUtil.formatDate(DateUtil.addDays(new Date(), -1)));
    }
}
4. 整合
-
访问 https://cron.qqe2.com/ 生成
cron在线表达式:
-
通过工具类,在每天凌晨1点执行方法,把前一天的数据查询进行添加
@Component
public class ScheduledTask {

    @Autowired
    private StatisticsDailyService staService;

    //在每天凌晨1点执行方法,把前一天的数据查询进行添加
    @Scheduled(cron = "0 0 1 * * ? ")//指定cron表达式规则
    public void task02(){
        staService.registerCount(DateUtil.formatDate(DateUtil.addDays(new Date(), -1)));
    }


}
生成统计数据前端整合
一、nginx配置
location ~ /staservice/ {
    proxy_pass http://localhost:8008;
}
二、前端页面实现
1. 创建api
src/api/sta.js
import request from '@/utils/request' //引入已经封装好的axios 和 拦截器

export default{
    //生成统计数据
    createStaByDay(day){
        return request({
            url:'/staservice/sta/registerCount/'+day,
            method: 'post'
        })
    }

}
2. 增加路由
src/router/index.js
//统计分析
    {
      path: '/sta',
      component: Layout,
      redirect: '/sta/create',
      name: '统计分析',
      meta: { title: '统计分析', icon: 'nested' },
      children: [
        {
          path: 'create',
          name: '生成数据',
          component: () => import('@/views/sta/create.vue'),
          meta: { title: '生成数据', icon: 'table' }
        },
        {
          path: 'show',
          name: '图表显示',
          component: () => import('@/views/sta/show.vue'),
          meta: { title: '图表显示', icon: 'nested' }
        }
      ]
    },
3. 创建组件
src/views/sta/create.vue
-
页面部分
<template> <div class="app-container"> <!--表单--> <el-form :inline="true" class="demo-form-inline"> <el-form-item label="日期"> <el-date-picker v-model="day" type="date" placeholder="选择要统计的日期" value-format="yyyy-MM-dd" /> </el-form-item> <el-button :disabled="btnDisabled" type="primary" @click="create()" >生成</el-button > </el-form> </div> </template> -
js脚本
<script>
import sta from "@/api/sta"

export default {

  data() {
    return {
      day: "",
      btnDisabled: false,
    };
  },

  created() {},

  methods: {
    create() {
      sta.createStaByDay(this.day)
        .then((resp) => {
            //提示
            this.$message({
            type: "success",
            message: "生成成功!",
            });
            //跳转页面到show
            this.$router.push({path:'/sta/show'})
        })
    },
  }
};
</script>
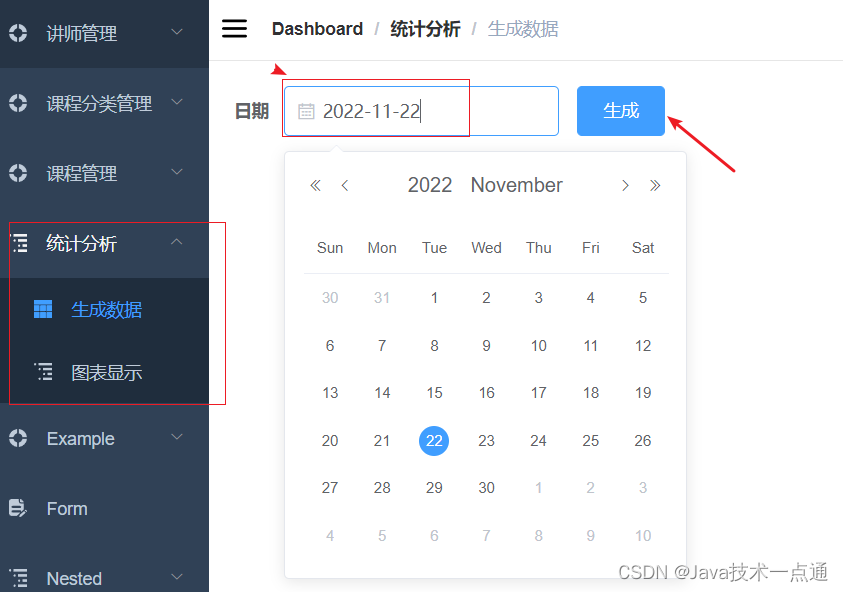
4. 测试


统计数据图表显示
一、ECharts
1. 简介
ECharts 是百度的一个项目,后来百度把Echart捐给apache,用于图表展示,提供了常规的折线图、柱状图、散点图、饼图、K线图,用于统计的盒形图,用于地理数据可视化的地图、热力图、线图,用于关系数据可视化的关系图、treemap、旭日图,多维数据可视化的平行坐标,还有用于 BI 的漏斗图,仪表盘,并且支持图与图之间的混搭。
官方网站:https://echarts.baidu.com/
2. 基本使用
入门参考:官网->文档->教程->5分钟上手ECharts
-
创建html页面:柱图.html
-
引入ECharts
<!-- 引入 ECharts 文件 --> <script src="echarts.min.js"></script> -
定义图表区域
<!-- 为ECharts准备一个具备大小(宽高)的Dom --> <div id="main" style="width: 600px;height:400px;"></div> -
渲染图表
<script type="text/javascript"> // 基于准备好的dom,初始化echarts实例 var myChart = echarts.init(document.getElementById("main")); // 指定图表的配置项和数据 var option = { title: { text: "ECharts 入门示例", }, tooltip: {}, legend: { data: ["销量"], }, xAxis: { data: ["衬衫", "羊毛衫", "雪纺衫", "裤子", "高跟鞋", "袜子"], }, yAxis: {}, series: [ { name: "销量", type: "bar", data: [5, 20, 36, 10, 10, 20], }, ], }; // 使用刚指定的配置项和数据显示图表。 myChart.setOption(option); </script> -
效果图

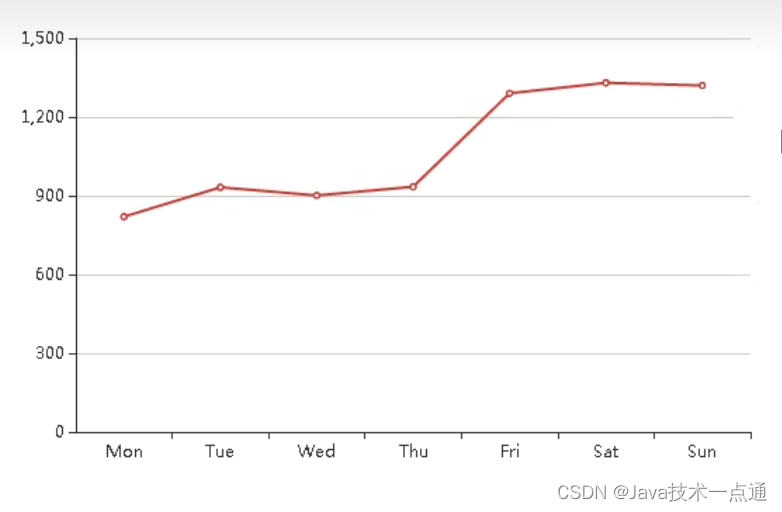
3. 折线图
实例参考:官网->实例->官方实例 https://echarts.baidu.com/examples/
折线图.html
<script>
    var myChart = echarts.init(document.getElementById('main'));
    var option = {
        //x轴是类目轴(离散数据),必须通过data设置类目数据
        xAxis: {
            type: 'category',
            data: ['Mon', 'Tue', 'Wed', 'Thu', 'Fri', 'Sat', 'Sun']
        },
        //y轴是数据轴(连续数据)
        yAxis: {
            type: 'value'
        },
        //系列列表。每个系列通过 type 决定自己的图表类型
        series: [{
            //系列中的数据内容数组
            data: [820, 932, 901, 934, 1290, 1330, 1320],
            //折线图

            type: 'line'
        }]
    };
    myChart.setOption(option);

</script>
二、项目中集成ECharts
1. 安装ECharts
npm install --save echarts@4.1.0
2. 增加路由

3. 创建组件
页面模板:
src\views\sta\show.vue
<template>
  <div class="app-container">
    <!--表单-->
    <el-form :inline="true" class="demo-form-inline">
      <el-form-item>
        <el-select v-model="searchObj.type" clearable placeholder="请选择">
          <el-option label="学员登录数统计" value="login_num" />
          <el-option label="学员注册数统计" value="register_num" />
          <el-option label="课程播放数统计" value="video_view_num" />
          <el-option label="每日课程数统计" value="course_num" />
        </el-select>
      </el-form-item>
      <el-form-item>
        <el-date-picker
          v-model="searchObj.begin"
          type="date"
          placeholder="选择开始日期"
          value-format="yyyy-MM-dd"
        />
      </el-form-item>
      <el-form-item>
        <el-date-picker
          v-model="searchObj.end"
          type="date"
          placeholder="选择截止日期"
          value-format="yyyy-MM-dd"
        />
      </el-form-item>
      <el-button
        :disabled="btnDisabled"
        type="primary"
        icon="el-icon-search"
        @click="showChart()"
        >查询</el-button
      >
    </el-form>
    <div class="chart-container">
      <div id="chart" class="chart" style="height: 500px; width: 100%" />
    </div>
  </div>
</template>
js:暂时显示临时数据
<script>
import echarts from "echarts";
export default {
  data() {
    return {
      searchObj: {
        begin: "",
        end: "",
        type: "",
      },
      btnDisabled: false,
      chart: null,
      title: "",
      xData: [],
      yData: [],
    };
  },
  methods: {
    showChart() {
      // 基于准备好的dom,初始化echarts实例
      this.chart = echarts.init(document.getElementById("chart"));
      // console.log(this.chart)
      // 指定图表的配置项和数据
      var option = {
        // x轴是类目轴(离散数据),必须通过data设置类目数据
        xAxis: {
          type: "category",
          data: ["Mon", "Tue", "Wed", "Thu", "Fri", "Sat", "Sun"],
        },
        // y轴是数据轴(连续数据)
        yAxis: {
          type: "value",
        },
        // 系列列表。每个系列通过 type 决定自己的图表类型
        series: [
          {
            // 系列中的数据内容数组
            data: [820, 932, 901, 934, 1290, 1330, 1320],
            // 折线图
            type: "line",
          },
        ],
      };
      this.chart.setOption(option);
    },
  },
  created() {},
};
</script>
4. 临时效果显示

三、完成后端业务
1. controller层
StatisticsDailyController
// 图标显示,返回两部分数据,日期json数组,数量json数组
    @GetMapping("showData/{type}/{begin}/{end}")
    public R showData(@PathVariable String type, @PathVariable String begin, @PathVariable String end) {
        Map<String, Object> map = staService.getShowData(type, begin, end);
        return  R.ok().data(map);
    }
2. service层
-
StatisticsDailyService接口// 图标显示,返回两部分数据,日期json数组,数量json数组 Map<String, Object> getShowData(String type, String begin, String end); -
StatisticsDailyServiceImpl实现类// 图标显示,返回两部分数据,日期json数组,数量json数组 @Override public Map<String, Object> getShowData(String type, String begin, String end) { //根据条件查询对应数据 QueryWrapper<StatisticsDaily> wrapper = new QueryWrapper<>(); wrapper.select("date_calculated", type); wrapper.between("date_calculated", begin, end); List<StatisticsDaily> staList = baseMapper.selectList(wrapper); //因为返回有两部分数据:日期 和 日期对应的数量 //前端要求数组json结构,对应后端java代码是list集合 //创建两个list集合,一个是日期list,一个数量list List<String> date_calculatedList = new ArrayList<>(); List<Integer> numDataList = new ArrayList<>(); //遍历查询所有数据list集合,进行拼接 for (int i = 0; i < staList.size(); i ++ ) { StatisticsDaily daily = staList.get(i); //封装日期list集合 date_calculatedList.add(daily.getDateCalculated()); //封装日期对应的数量 switch (type) { case "register_num": numDataList.add(daily.getRegisterNum()); break; case "login_num": numDataList.add(daily.getLoginNum()); break; case "video_view_num": numDataList.add(daily.getVideoViewNum()); break; case "course_num": numDataList.add(daily.getCourseNum()); break; default: break; } } // 把封装之后两个list集合放到map集合,进行返回 Map<String, Object> map = new HashMap<>(); map.put("date_calculatedList", date_calculatedList); map.put("numDataList", numDataList); return map; }
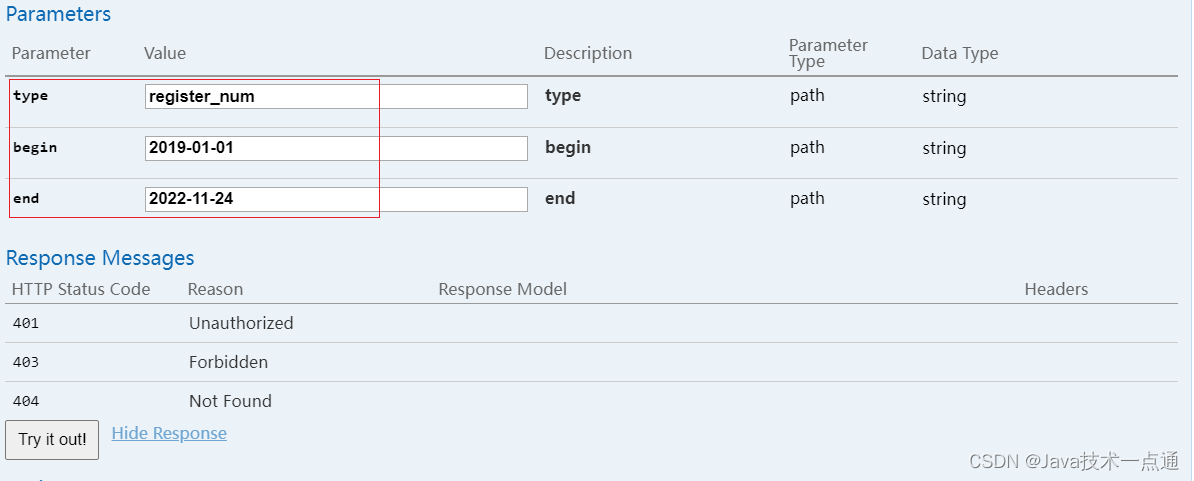
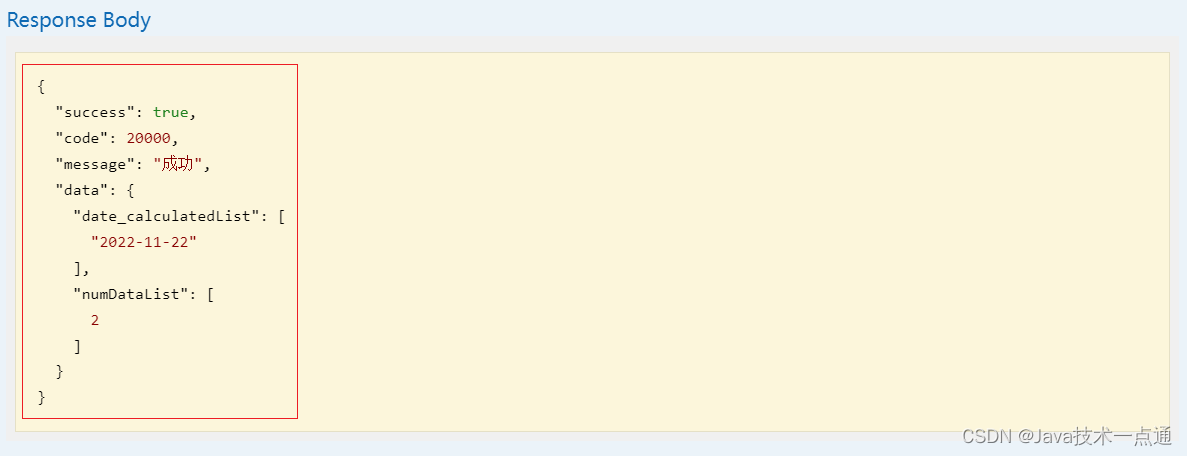
3. Swagger测试
四、前后端整合
1. 创建api
src\api\sta.js
 //获取统计数据
    getDataSta(searchObj) {
        return request({
            url: `/staservice/sta/showData/${searchObj.type}/${searchObj.begin}/${searchObj.end}`,
            method: 'get'
        })
    }
2. show.vue中引入api模块
import staApi from '@/api/sta'
3. js脚本
<script>
import echarts from "echarts"
import staApi from '@/api/sta'

export default {
  data() {
    return {
      searchObj: {
        begin: "",
        end: "",
        type: "",
      },
      btnDisabled: false,
      chart: null,
      title: "",
      xData: [],
      yData: [],
    };
  },
  methods: {

    showChart(){
        staApi.getDataSta(this.searchObj)
            .then(response => {
                //x轴 时间
                this.xData = response.data.date_calculatedList
                //y轴 数据
                this.yData = response.data.numDataList

                //调用下面生成图表方法,改变值
                this.setChart();
            })
    },

    setChart() {
      // 基于准备好的dom,初始化echarts实例
      this.chart = echarts.init(document.getElementById("chart"));
      // console.log(this.chart)
      // 指定图表的配置项和数据
      var option = {
        // x轴是类目轴(离散数据),必须通过data设置类目数据
        xAxis: {
          type: "category",
          data: this.xData,
        },
        // y轴是数据轴(连续数据)
        yAxis: {
          type: "value",
        },
        // 系列列表。每个系列通过 type 决定自己的图表类型
        series: [
          {
            // 系列中的数据内容数组
            data: this.yData,
            // 折线图
            type: "line",
          },
        ],
      };
      this.chart.setOption(option);
    },
  },
  created() {},
};
</script>
4. 测试

五、样式调整
参考配置手册:https://echarts.baidu.com/option.html#title
1. 显示标题
title: {
    text: this.title
},

2. x坐标轴触发提示
tooltip: {
    trigger: 'axis'
},
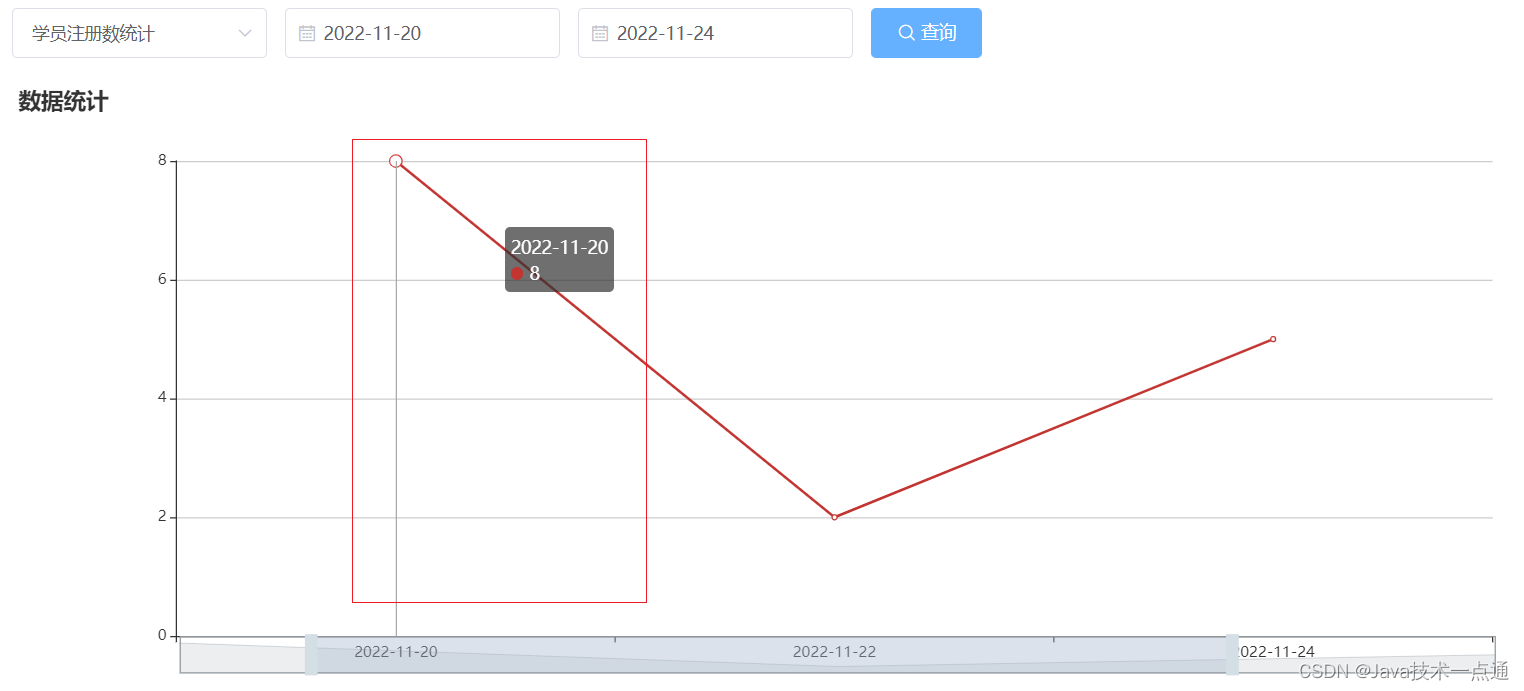
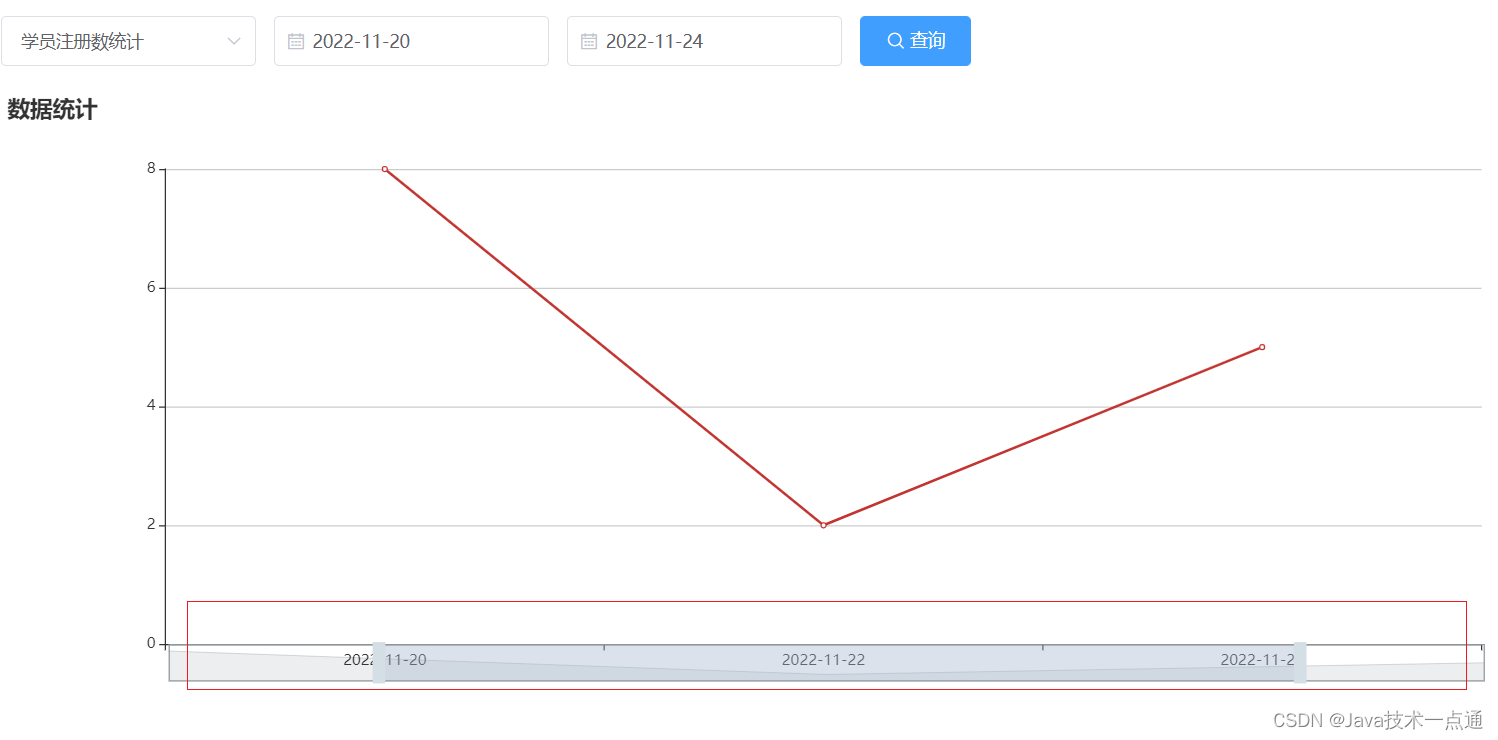
3. 区域缩放
dataZoom: [
    {
        show: true,
        height: 30,
        xAxisIndex: [0],
        bottom: 30,
        start: 10,
        end: 80,
        handleIcon:
        "path://M306.1,413c0,2.2-1.8,4-4,4h-59.8c-2.2,0-4-1.8-4-4V200.8c0-2.2, 1.8-4, 4-4h59.8c2.2, 0, 4, 1.8, 4, 4V413z",
        handleSize: "110%",
        handleStyle: {
            color: "#d3dee5",
        },
        textStyle: {
            color: "#fff",
        },
        borderColor: "#90979c",
    },
    {
        type: "inside",
        show: true,
        height: 15,
        start: 1,
        end: 35,
    },
],
创作不易,如果有帮助到你,请给文章点个赞和收藏,让更多的人看到!!!
关注博主不迷路,内容持续更新中。

