目录
一、config.ini
二、config.json
三、stats.txt
官方教程:gem5: Understanding gem5 statistics and output
在运行 gem5 之后,除了仿真脚本打印的仿真信息外,还会在根目录中名为 m5out 的目录中生成三个文件:
- config.ini:包含仿真过程中创建的每个 SimObject 及其参数值的列表。
- config.json:与 config.ini 相同,但以 JSON 格式存储。
- stats.txt:gem5 仿真期间注册的所有统计信息的文本表示。
这些文件存储在名为 m5out 的目录中。

一、config.ini
该文件是仿真过程中所模拟内容的确切版本。它显示了每个被仿真的 SimObject 的所有参数,无论这些参数是在配置脚本中设置的还是使用了默认值。
下面是从在运行 simple-config-chapter 中的 simple.py 配置文件时生成的 config.ini 文件中提取的内容。
该文件是仿真过程中所模拟内容的确切版本。它显示了每个被仿真的 SimObject 的所有参数,无论这些参数是在配置脚本中设置的还是使用了默认值。
以下是我自己的配置文件时生成的 config.ini 文件中提取的内容(只截取了部分)。
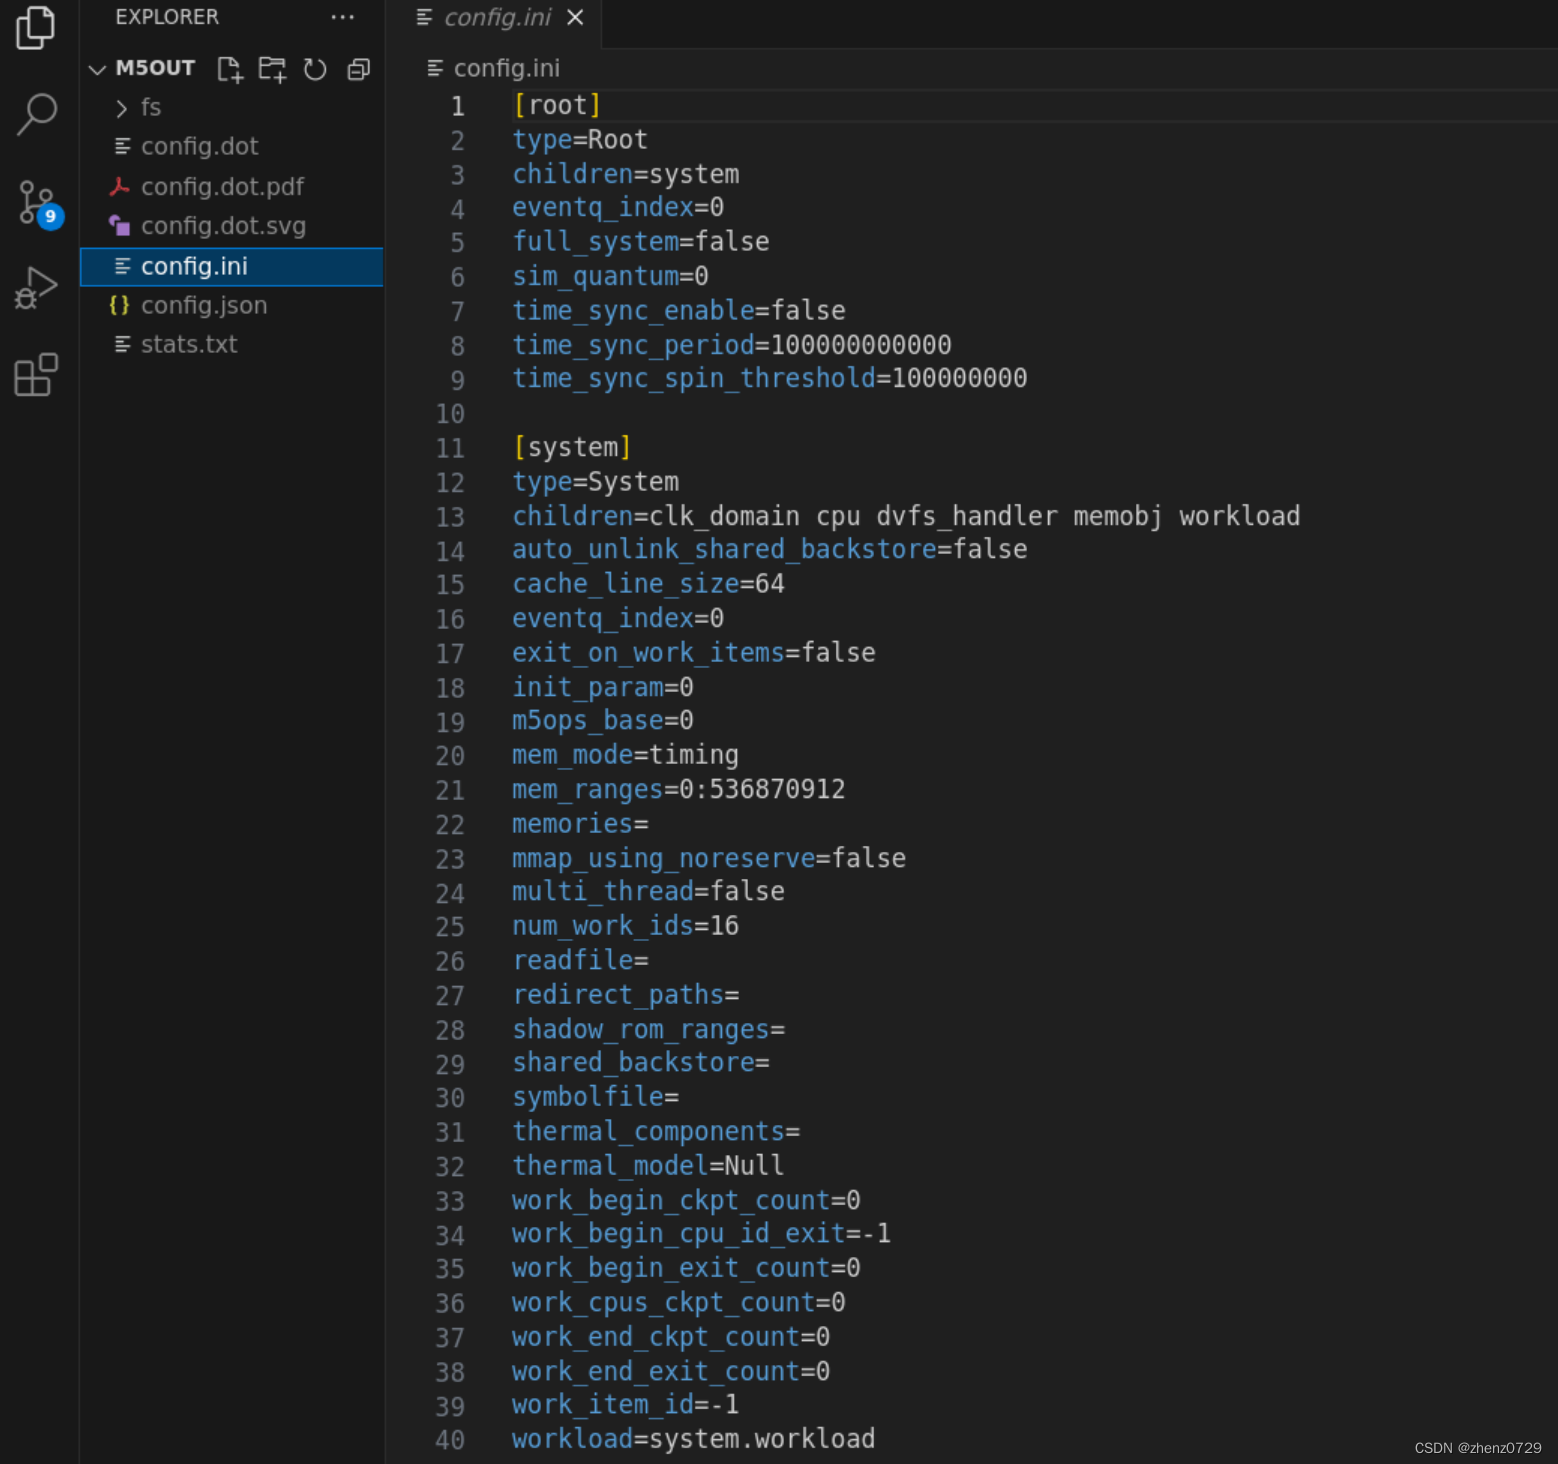
在每个 SimObject 的描述开头,首先是它在配置文件中创建时用方括号括起来的名称(例如[system])。
接下来,显示了每个 SimObject 的每个参数及其值(在截取的部分主要看system),包括在配置文件中未明确设置的参数。例如,配置文件将时钟域设置为 1 GHz(在此情况下为 1000 个时钟周期)。然而,它没有设置 cache line size(在系统中为 64)对象。
config.ini 文件类似于一个对照工具,用来确保仿真配置和预期相同。gem5有多重设置默认值和覆盖默认值的可能,所以对config.ini进行合理性检查,用来确保子啊配置文件中设置的参数传递到实际的类中。
二、config.json
与 config.ini 相同,但以 JSON 格式存储(不作过多说明)。
三、stats.txt
gem5拥有一个灵活的统计信息生成系统。gem5统计信息在Statistics - gem5上有详细介绍。每个SimObject的实例化都有自己的统计信息。在仿真结束时,或者当发出特殊的统计信息转储命令时,所有SimObject的当前统计信息状态将被转储到一个文件中。
首先,统计文件包含有关执行的一般统计信息:
(这里是我自己的配置文件,只起示范作用)
---------- Begin Simulation Statistics ----------
simSeconds                                   0.000057                       # Number of seconds simulated (Second)
simTicks                                     57467000                       # Number of ticks simulated (Tick)
finalTick                                    57467000                       # Number of ticks from beginning of simulation (restored from checkpoints and never reset) (Tick)
simFreq                                  1000000000000                       # The number of ticks per simulated second ((Tick/Second))
hostSeconds                                      0.03                       # Real time elapsed on the host (Second)
hostTickRate                               2295882330                       # The number of ticks simulated per host second (ticks/s) ((Tick/Second))
hostMemory                                     665792                       # Number of bytes of host memory used (Byte)
simInsts                                         6225                       # Number of instructions simulated (Count)
simOps                                          11204                       # Number of ops (including micro ops) simulated (Count)
hostInstRate                                   247382                       # Simulator instruction rate (inst/s) ((Count/Second))
hostOpRate                                     445086                       # Simulator op (including micro ops) rate (op/s) ((Count/Second))

---------- Begin Simulation Statistics ----------
simSeconds                                   0.000490                       # Number of seconds simulated (Second)
simTicks                                    490394000                       # Number of ticks simulated (Tick)
finalTick                                   490394000                       # Number of ticks from beginning of simulation (restored from checkpoints and never reset) (Tick)
simFreq                                  1000000000000                       # The number of ticks per simulated second ((Tick/Second))
hostSeconds                                      0.03                       # Real time elapsed on the host (Second)
hostTickRate                              15979964060                       # The number of ticks simulated per host second (ticks/s) ((Tick/Second))
hostMemory                                     657488                       # Number of bytes of host memory used (Byte)
simInsts                                         6225                       # Number of instructions simulated (Count)
simOps                                          11204                       # Number of ops (including micro ops) simulated (Count)
hostInstRate                                   202054                       # Simulator instruction rate (inst/s) ((Count/Second))
hostOpRate                                     363571                       # Simulator op (including micro ops) rate (op/s) ((Count/Second))
统计信息开始于 "---------- Begin Simulation Statistics ----------"。如果在gem5执行期间进行了多次统计信息转储,则在单个文件中会有多个此类转储。常见于运行时间较长的应用程序或从检查点恢复时。
每个统计信息具有名称(第一列)、值(第二列)和描述(前面带有#的最后一列),后面是统计信息的单位。
大多数统计信息从其描述中很容易理解。其中几个重要的统计信息包括 sim_seconds,它是仿真的总时间;sim_insts,它是CPU提交的指令数量;host_inst_rate,它告诉您gem5的性能。
接下来,将打印SimObjects的统计信息。例如,CPU统计信息包含有关系统调用数量、缓存系统和翻译缓冲区等的信息。
system.clk_domain.clock                          1000                       # Clock period in ticks (Tick)
system.clk_domain.voltage_domain.voltage            1                       # Voltage in Volts (Volt)
system.cpu.numCycles                            57467                       # Number of cpu cycles simulated (Cycle)
system.cpu.numWorkItemsStarted                      0                       # Number of work items this cpu started (Count)
system.cpu.numWorkItemsCompleted                    0                       # Number of work items this cpu completed (Count)
system.cpu.dcache.demandHits::cpu.data           1941                       # number of demand (read+write) hits (Count)
system.cpu.dcache.demandHits::total              1941                       # number of demand (read+write) hits (Count)
system.cpu.dcache.overallHits::cpu.data          1941                       # number of overall hits (Count)
system.cpu.dcache.overallHits::total             1941                       # number of overall hits (Count)
system.cpu.dcache.demandMisses::cpu.data          133                       # number of demand (read+write) misses (Count)
system.cpu.dcache.demandMisses::total             133                       # number of demand (read+write) misses (Count)
system.cpu.dcache.overallMisses::cpu.data          133                       # number of overall misses (Count)
system.cpu.dcache.overallMisses::total            133                       # number of overall misses (Count)
system.cpu.dcache.demandMissLatency::cpu.data     14301000                       # number of demand (read+write) miss ticks (Tick)
system.cpu.dcache.demandMissLatency::total     14301000                       # number of demand (read+write) miss ticks (Tick)
system.cpu.dcache.overallMissLatency::cpu.data     14301000                       # number of overall miss ticks (Tick)
system.cpu.dcache.overallMissLatency::total     14301000                       # number of overall miss ticks (Tick)
system.cpu.dcache.demandAccesses::cpu.data         2074                       # number of demand (read+write) accesses (Count)
system.cpu.dcache.demandAccesses::total          2074                       # number of demand (read+write) accesses (Count)
system.cpu.dcache.overallAccesses::cpu.data         2074                       # number of overall (read+write) accesses (Count)
system.cpu.dcache.overallAccesses::total         2074                       # number of overall (read+write) accesses (Count)
system.cpu.dcache.demandMissRate::cpu.data     0.064127                       # miss rate for demand accesses (Ratio)
system.cpu.dcache.demandMissRate::total      0.064127                       # miss rate for demand accesses (Ratio)
system.cpu.dcache.overallMissRate::cpu.data     0.064127                       # miss rate for overall accesses (Ratio)
system.cpu.dcache.overallMissRate::total     0.064127                       # miss rate for overall accesses (Ratio)
system.cpu.dcache.demandAvgMissLatency::cpu.data 107526.315789                       # average overall miss latency ((Cycle/Count))
system.cpu.dcache.demandAvgMissLatency::total 107526.315789                       # average overall miss latency ((Cycle/Count))
system.cpu.dcache.overallAvgMissLatency::cpu.data 107526.315789                       # average overall miss latency ((Cycle/Count))
system.cpu.dcache.overallAvgMissLatency::total 107526.315789                       # average overall miss latency ((Cycle/Count))
...
system.cpu.mmu.dtb.rdAccesses                    1123                       # TLB accesses on read requests (Count)
system.cpu.mmu.dtb.wrAccesses                     953                       # TLB accesses on write requests (Count)
system.cpu.mmu.dtb.rdMisses                        11                       # TLB misses on read requests (Count)
system.cpu.mmu.dtb.wrMisses                         9                       # TLB misses on write requests (Count)
system.cpu.mmu.dtb.walker.power_state.pwrStateResidencyTicks::UNDEFINED     57467000                       # Cumulative time (in ticks) in various power states (Tick)
system.cpu.mmu.itb.rdAccesses                       0                       # TLB accesses on read requests (Count)
system.cpu.mmu.itb.wrAccesses                    7940                       # TLB accesses on write requests (Count)
system.cpu.mmu.itb.rdMisses                         0                       # TLB misses on read requests (Count)
system.cpu.mmu.itb.wrMisses                        37                       # TLB misses on write requests (Count)
system.cpu.mmu.itb.walker.power_state.pwrStateResidencyTicks::UNDEFINED     57467000                       # Cumulative time (in ticks) in various power states (Tick)
system.cpu.power_state.pwrStateResidencyTicks::ON     57467000                       # Cumulative time (in ticks) in various power states (Tick)
system.cpu.thread_0.numInsts                        0                       # Number of Instructions committed (Count)
system.cpu.thread_0.numOps                          0                       # Number of Ops committed (Count)
system.cpu.thread_0.numMemRefs                      0                       # Number of Memory References (Count)
system.cpu.workload.numSyscalls                    11                       # Number of system calls (Count)
文件中稍后出现的是内存控制器的统计信息。其中包含每个组件读取的字节数以及这些组件使用的平均带宽等信息。
system.mem_ctrl.bytesReadWrQ                        0                       # Total number of bytes read from write queue (Byte)
system.mem_ctrl.bytesReadSys                    23168                       # Total read bytes from the system interface side (Byte)
system.mem_ctrl.bytesWrittenSys                     0                       # Total written bytes from the system interface side (Byte)
system.mem_ctrl.avgRdBWSys               403153113.96105593                       # Average system read bandwidth in Byte/s ((Byte/Second))
system.mem_ctrl.avgWrBWSys                 0.00000000                       # Average system write bandwidth in Byte/s ((Byte/Second))
system.mem_ctrl.totGap                       57336000                       # Total gap between requests (Tick)
system.mem_ctrl.avgGap                      158386.74                       # Average gap between requests ((Tick/Count))
system.mem_ctrl.requestorReadBytes::cpu.inst        14656                       # Per-requestor bytes read from memory (Byte)
system.mem_ctrl.requestorReadBytes::cpu.data         8512                       # Per-requestor bytes read from memory (Byte)
system.mem_ctrl.requestorReadRate::cpu.inst 255033323.472601681948                       # Per-requestor bytes read from memory rate ((Byte/Second))
system.mem_ctrl.requestorReadRate::cpu.data 148119790.488454252481                       # Per-requestor bytes read from memory rate ((Byte/Second))
system.mem_ctrl.requestorReadAccesses::cpu.inst          229                       # Per-requestor read serviced memory accesses (Count)
system.mem_ctrl.requestorReadAccesses::cpu.data          133                       # Per-requestor read serviced memory accesses (Count)
system.mem_ctrl.requestorReadTotalLat::cpu.inst      6234000                       # Per-requestor read total memory access latency (Tick)
system.mem_ctrl.requestorReadTotalLat::cpu.data      4141000                       # Per-requestor read total memory access latency (Tick)
system.mem_ctrl.requestorReadAvgLat::cpu.inst     27222.71                       # Per-requestor read average memory access latency ((Tick/Count))
system.mem_ctrl.requestorReadAvgLat::cpu.data     31135.34                       # Per-requestor read average memory access latency ((Tick/Count))
system.mem_ctrl.dram.bytesRead::cpu.inst        14656                       # Number of bytes read from this memory (Byte)
system.mem_ctrl.dram.bytesRead::cpu.data         8512                       # Number of bytes read from this memory (Byte)
system.mem_ctrl.dram.bytesRead::total           23168                       # Number of bytes read from this memory (Byte)
system.mem_ctrl.dram.bytesInstRead::cpu.inst        14656                       # Number of instructions bytes read from this memory (Byte)
system.mem_ctrl.dram.bytesInstRead::total        14656                       # Number of instructions bytes read from this memory (Byte)
system.mem_ctrl.dram.numReads::cpu.inst           229                       # Number of read requests responded to by this memory (Count)
system.mem_ctrl.dram.numReads::cpu.data           133                       # Number of read requests responded to by this memory (Count)
system.mem_ctrl.dram.numReads::total              362                       # Number of read requests responded to by this memory (Count)
system.mem_ctrl.dram.bwRead::cpu.inst       255033323                       # Total read bandwidth from this memory ((Byte/Second))
system.mem_ctrl.dram.bwRead::cpu.data       148119790                       # Total read bandwidth from this memory ((Byte/Second))
system.mem_ctrl.dram.bwRead::total          403153114                       # Total read bandwidth from this memory ((Byte/Second))
system.mem_ctrl.dram.bwInstRead::cpu.inst    255033323                       # Instruction read bandwidth from this memory ((Byte/Second))
system.mem_ctrl.dram.bwInstRead::total      255033323                       # Instruction read bandwidth from this memory ((Byte/Second))
system.mem_ctrl.dram.bwTotal::cpu.inst      255033323                       # Total bandwidth to/from this memory ((Byte/Second))
system.mem_ctrl.dram.bwTotal::cpu.data      148119790                       # Total bandwidth to/from this memory ((Byte/Second))
system.mem_ctrl.dram.bwTotal::total         403153114                       # Total bandwidth to/from this memory ((Byte/Second))
system.mem_ctrl.dram.readBursts                   362                       # Number of DRAM read bursts (Count)
system.mem_ctrl.dram.writeBursts                    0                       # Number of DRAM write bursts (Count)
今天心情比较好,更两篇~
